
|
|||||
|
 | |
| |
| |
| |
| |
| |
|
Gene: TNNI2 |
Gene summary for TNNI2 |
| Gene information | Species | Human | Gene symbol | TNNI2 | Gene ID | 7136 |
| Gene name | troponin I2, fast skeletal type | |
| Gene Alias | AMCD2B | |
| Cytomap | 11p15.5 | |
| Gene Type | protein-coding | GO ID | GO:0003008 | UniProtAcc | P48788 |
Top |
Malignant transformation analysis |
| Identification of the aberrant gene expression in precancerous and cancerous lesions by comparing the gene expression of stem-like cells in diseased tissues with normal stem cells |
| Entrez ID | Symbol | Replicates | Species | Organ | Tissue | Adj P-value | Log2FC | Malignancy |
| 7136 | TNNI2 | C30 | Human | Oral cavity | OSCC | 9.69e-19 | 6.77e-01 | 0.3055 |
| 7136 | TNNI2 | C08 | Human | Oral cavity | OSCC | 3.90e-03 | -2.84e-01 | 0.1919 |
| 7136 | TNNI2 | C09 | Human | Oral cavity | OSCC | 2.35e-36 | 1.79e+00 | 0.1431 |
| 7136 | TNNI2 | EOLP-2 | Human | Oral cavity | EOLP | 1.88e-02 | -3.28e-01 | -0.0203 |
| 7136 | TNNI2 | SYSMH2 | Human | Oral cavity | OSCC | 3.05e-18 | -3.62e-03 | 0.2326 |
| 7136 | TNNI2 | P1_cSCC | Human | Skin | cSCC | 1.58e-02 | 3.44e-01 | 0.0292 |
| 7136 | TNNI2 | P4_cSCC | Human | Skin | cSCC | 5.14e-03 | 1.57e-01 | -0.00290000000000005 |
| 7136 | TNNI2 | cSCC_p11 | Human | Skin | cSCC | 3.02e-07 | 1.77e-01 | -0.2102 |
| 7136 | TNNI2 | cSCC_p4 | Human | Skin | cSCC | 5.03e-08 | 2.51e-01 | -0.2022 |
| 7136 | TNNI2 | cSCC_p9 | Human | Skin | cSCC | 3.33e-10 | 1.99e-01 | -0.1991 |
| Page: 1 |
| Tissue | Expression Dynamics | Abbreviation |
| Oral Cavity | 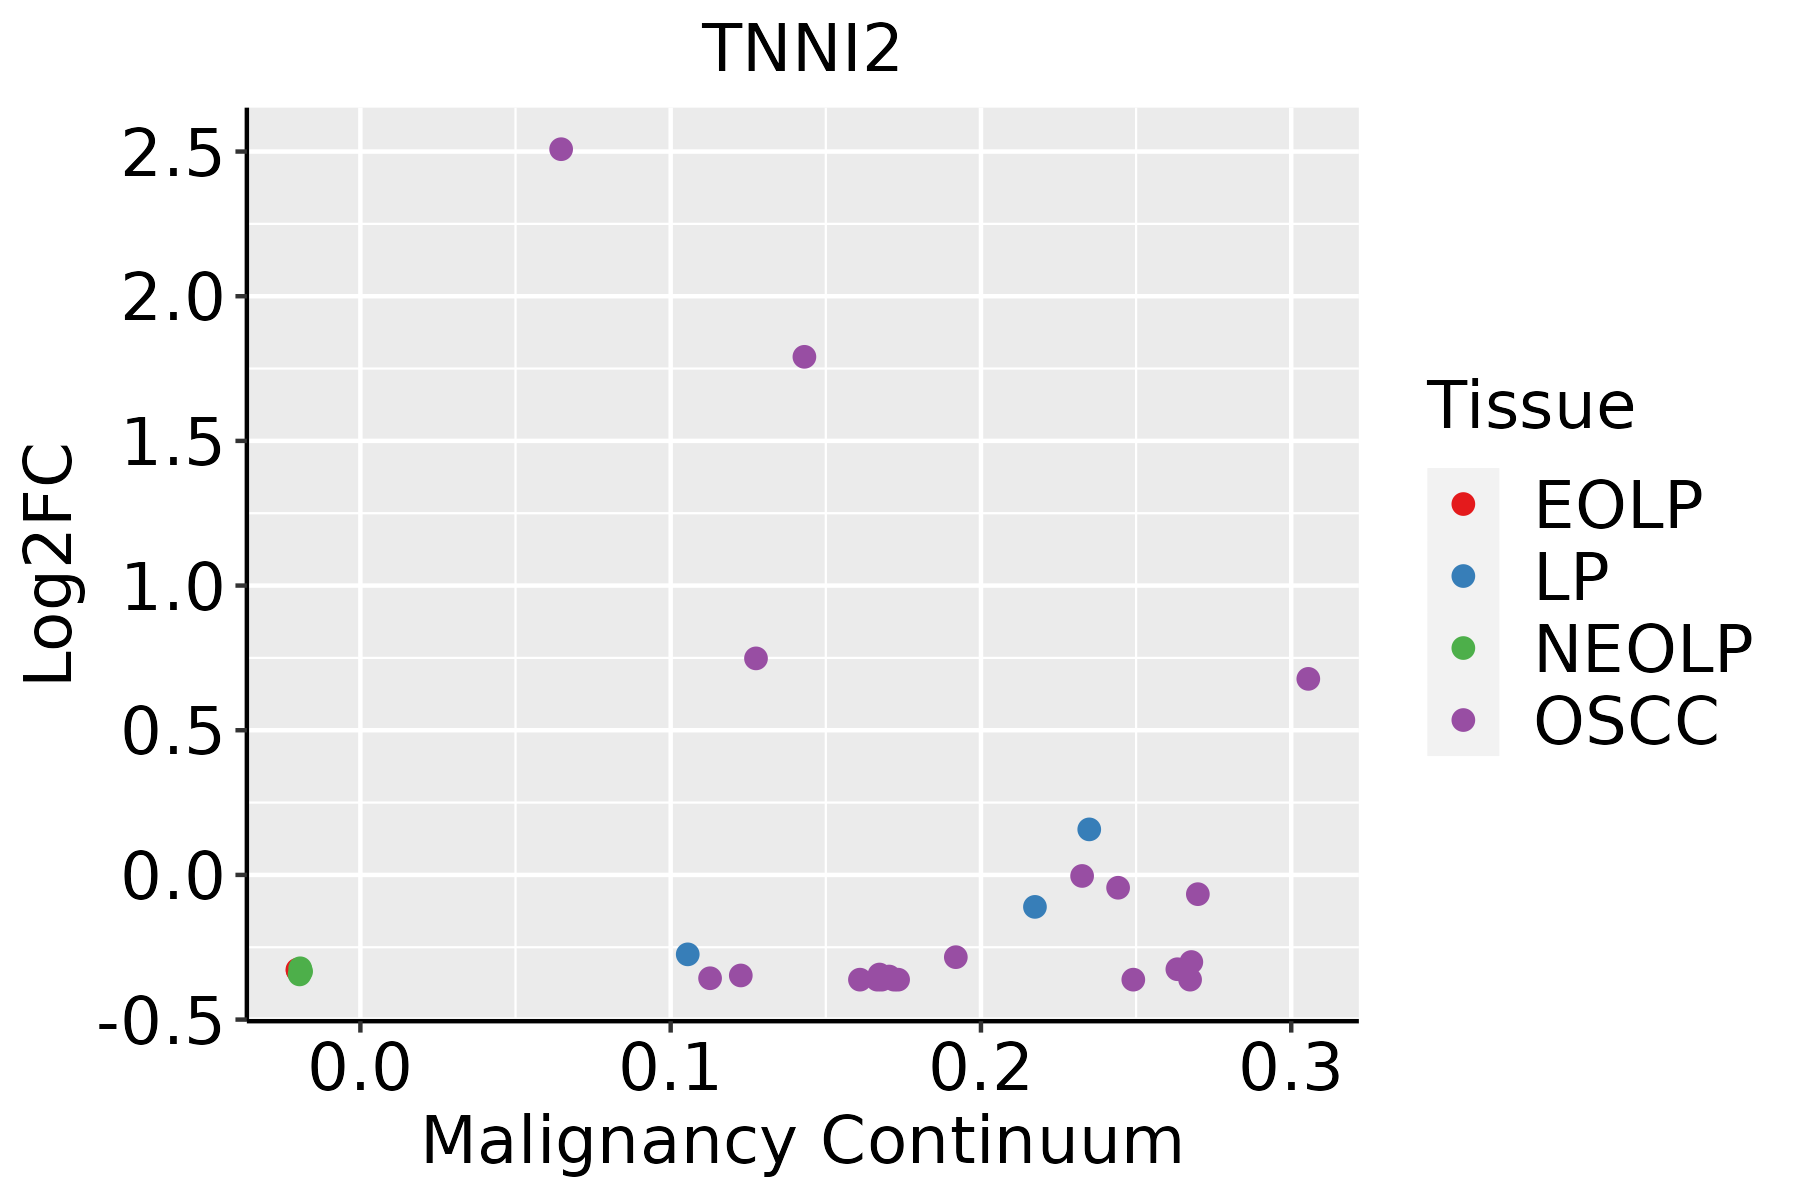 | EOLP: Erosive Oral lichen planus |
| LP: leukoplakia | ||
| NEOLP: Non-erosive oral lichen planus | ||
| OSCC: Oral squamous cell carcinoma | ||
| Skin | 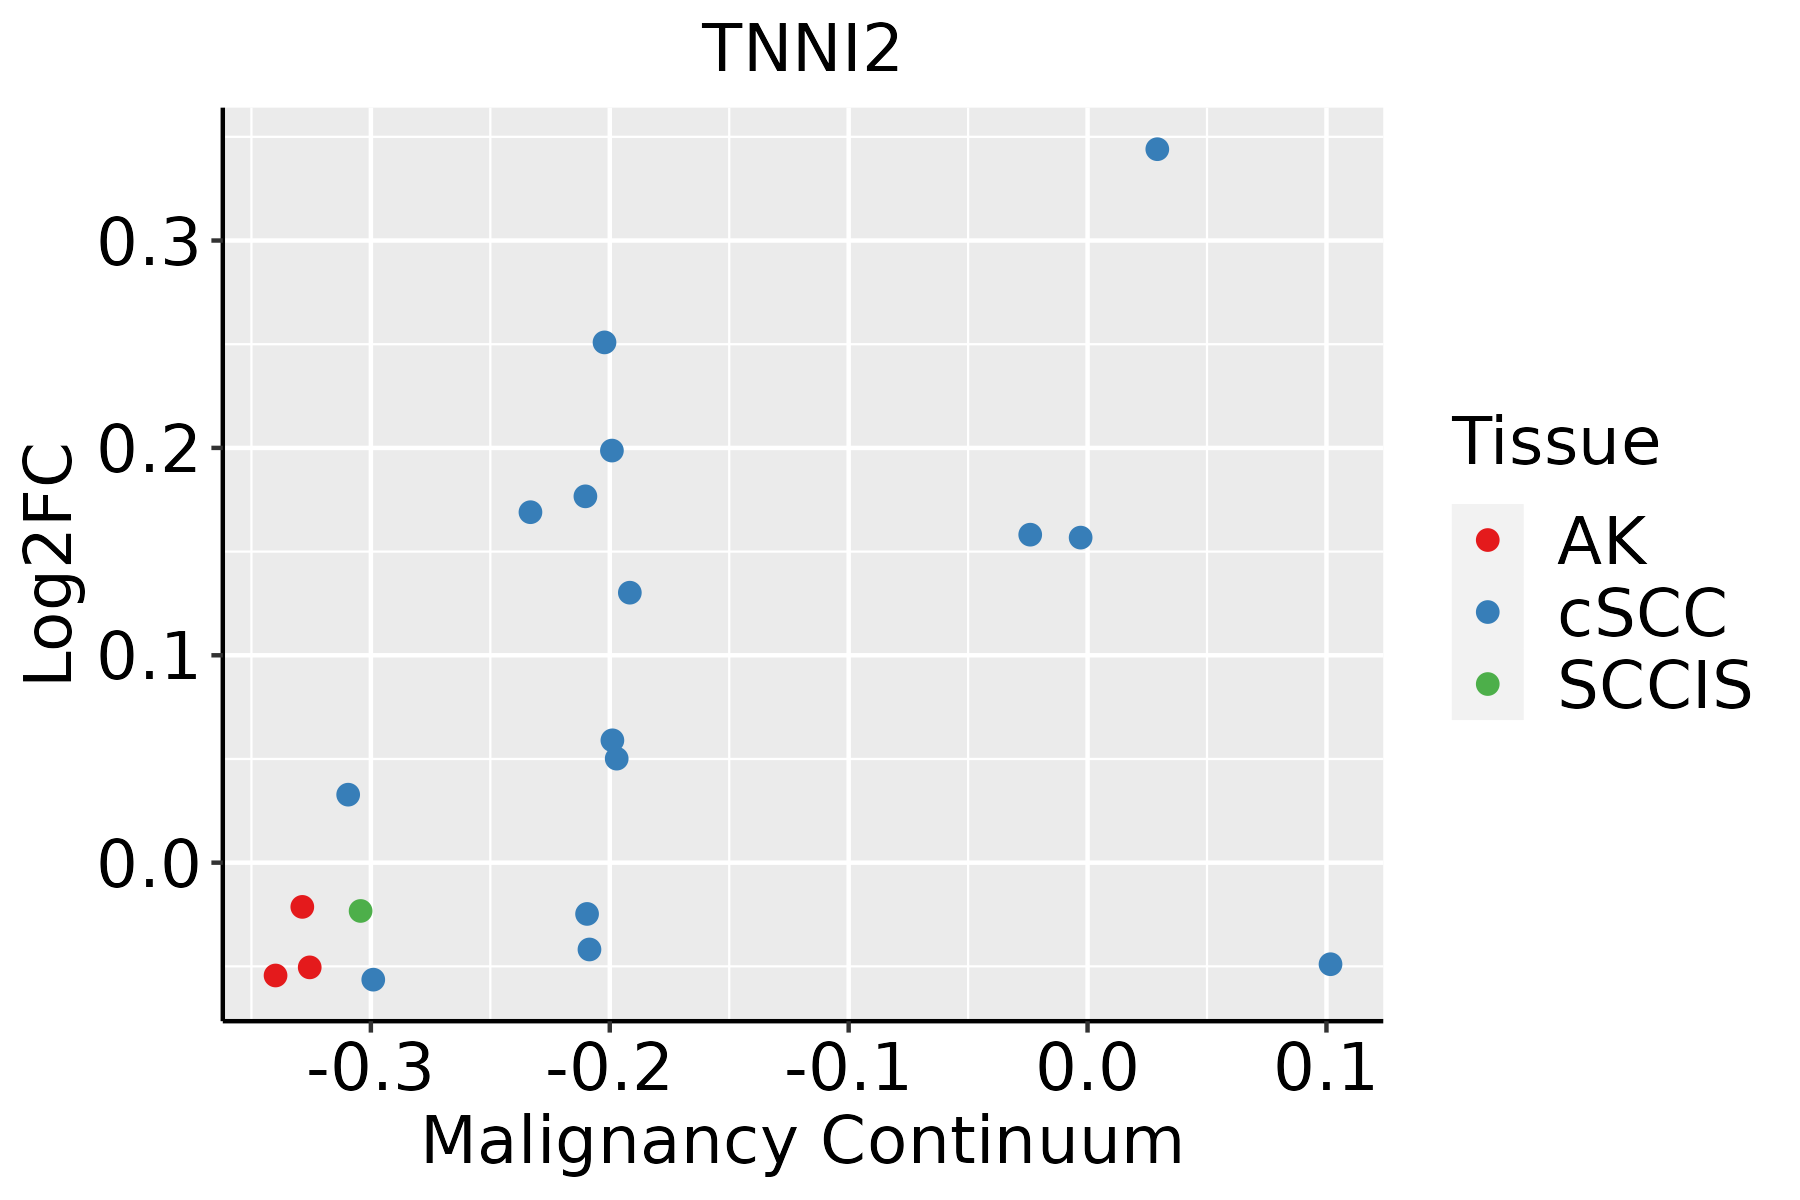 | AK: Actinic keratosis |
| cSCC: Cutaneous squamous cell carcinoma | ||
| SCCIS:squamous cell carcinoma in situ |
| ∗log2FC in expression of this searched gene in stem-like cells from each diseased tissue sample relative to stem-like cells in normal samples in each tissue plotted against the malignancy continuum. Samples are colored based on if they are from different disease stage. |
Top |
Malignant transformation related pathway analysis |
| Find out the enriched GO biological processes and KEGG pathways involved in transition from healthy to precancer to cancer |
| Tissue | Disease Stage | Enriched GO biological Processes |
| Colorectum | AD |  |
| Colorectum | SER |  |
| Colorectum | MSS |  |
| Colorectum | MSI-H |  |
| Colorectum | FAP |  |
| ∗Top 15 enriched GO BP terms are showed in the bar plot of each disease state in each tissue. Each row represents a significant GO biological process which is colored according to the -log10(p.adjust). |
| Page: 1 2 3 4 5 6 7 8 9 |
| GO ID | Tissue | Disease Stage | Description | Gene Ratio | Bg Ratio | pvalue | p.adjust | Count |
| GO:00030128 | Oral cavity | EOLP | muscle system process | 71/2218 | 452/18723 | 7.83e-03 | 3.73e-02 | 71 |
| Page: 1 |
| Pathway ID | Tissue | Disease Stage | Description | Gene Ratio | Bg Ratio | pvalue | p.adjust | qvalue | Count |
| Page: 1 |
Top |
Cell-cell communication analysis |
| Identification of potential cell-cell interactions between two cell types and their ligand-receptor pairs for different disease states |
| Ligand | Receptor | LRpair | Pathway | Tissue | Disease Stage |
| Page: 1 |
Top |
Single-cell gene regulatory network inference analysis |
| Find out the significant the regulons (TFs) and the target genes of each regulon across cell types for different disease states |
| TF | Cell Type | Tissue | Disease Stage | Target Gene | RSS | Regulon Activity |
| ∗The dot plots of a searched regulon are shown for all cell subpopulations in each disease state of each tissue based on the regulon specific score inferred using pySCENIC and by calculating the average expression. |
| Page: 1 |
Top |
Somatic mutation of malignant transformation related genes |
| Annotation of somatic variants for genes involved in malignant transformation |
| Hugo Symbol | Variant Class | Variant Classification | dbSNP RS | HGVSc | HGVSp | HGVSp Short | SWISSPROT | BIOTYPE | SIFT | PolyPhen | Tumor Sample Barcode | Tissue | Histology | Sex | Age | Stage | Therapy Types | Drugs | Outcome |
| TNNI2 | SNV | Missense_Mutation | rs104894311 | c.521G>A | p.Arg174Gln | p.R174Q | P48788 | protein_coding | deleterious(0) | probably_damaging(0.981) | TCGA-B6-A0IK-01 | Breast | breast invasive carcinoma | Female | <65 | III/IV | Unknown | Unknown | PD |
| TNNI2 | SNV | Missense_Mutation | novel | c.288N>A | p.Met96Ile | p.M96I | P48788 | protein_coding | deleterious(0) | benign(0.027) | TCGA-VS-A953-01 | Cervix | cervical & endocervical cancer | Female | <65 | I/II | Unknown | Unknown | PD |
| TNNI2 | SNV | Missense_Mutation | rs774378823 | c.467N>A | p.Arg156Gln | p.R156Q | P48788 | protein_coding | tolerated(0.08) | benign(0.347) | TCGA-AA-3492-01 | Colorectum | colon adenocarcinoma | Female | >=65 | I/II | Unknown | Unknown | SD |
| TNNI2 | SNV | Missense_Mutation | rs754224223 | c.208N>A | p.Ala70Thr | p.A70T | P48788 | protein_coding | tolerated(0.28) | benign(0.084) | TCGA-AD-6895-01 | Colorectum | colon adenocarcinoma | Male | >=65 | III/IV | Unknown | Unknown | SD |
| TNNI2 | SNV | Missense_Mutation | c.88N>A | p.Leu30Met | p.L30M | P48788 | protein_coding | deleterious(0.04) | possibly_damaging(0.896) | TCGA-EI-7004-01 | Colorectum | rectum adenocarcinoma | Female | <65 | III/IV | Chemotherapy | xeloda | SD | |
| TNNI2 | SNV | Missense_Mutation | novel | c.310C>T | p.Arg104Trp | p.R104W | P48788 | protein_coding | deleterious(0) | probably_damaging(0.978) | TCGA-AJ-A3BH-01 | Endometrium | uterine corpus endometrioid carcinoma | Female | Unknown | I/II | Unknown | Unknown | SD |
| TNNI2 | SNV | Missense_Mutation | novel | c.304G>A | p.Asp102Asn | p.D102N | P48788 | protein_coding | deleterious(0) | possibly_damaging(0.781) | TCGA-AJ-A3EL-01 | Endometrium | uterine corpus endometrioid carcinoma | Female | <65 | I/II | Unknown | Unknown | SD |
| TNNI2 | SNV | Missense_Mutation | c.206A>G | p.His69Arg | p.H69R | P48788 | protein_coding | deleterious(0) | probably_damaging(0.969) | TCGA-AP-A0LM-01 | Endometrium | uterine corpus endometrioid carcinoma | Female | <65 | III/IV | Chemotherapy | cisplatin | SD | |
| TNNI2 | SNV | Missense_Mutation | c.217G>A | p.Asp73Asn | p.D73N | P48788 | protein_coding | deleterious(0.04) | possibly_damaging(0.673) | TCGA-AX-A0J0-01 | Endometrium | uterine corpus endometrioid carcinoma | Female | <65 | I/II | Unknown | Unknown | SD | |
| TNNI2 | SNV | Missense_Mutation | c.71A>G | p.Gln24Arg | p.Q24R | P48788 | protein_coding | tolerated(0.11) | benign(0.427) | TCGA-BS-A0TJ-01 | Endometrium | uterine corpus endometrioid carcinoma | Female | <65 | I/II | Unknown | Unknown | SD |
| Page: 1 2 3 4 |
Top |
Related drugs of malignant transformation related genes |
| Identification of chemicals and drugs interact with genes involved in malignant transfromation |
| (DGIdb 4.0) |
| Entrez ID | Symbol | Category | Interaction Types | Drug Claim Name | Drug Name | PMIDs |
| 7136 | TNNI2 | NA | activator | CHEMBL3039529 | TIRASEMTIV | |
| 7136 | TNNI2 | NA | TIRAMSETIV |
| Page: 1 |

Copyright 2023-Present -The University of Texas Health Science Center at Houston |