
|
|||||
|
 | |
| |
| |
| |
| |
| |
|
Gene: TNNC1 |
Gene summary for TNNC1 |
| Gene information | Species | Human | Gene symbol | TNNC1 | Gene ID | 7134 |
| Gene name | troponin C1, slow skeletal and cardiac type | |
| Gene Alias | CMD1Z | |
| Cytomap | 3p21.1 | |
| Gene Type | protein-coding | GO ID | GO:0002086 | UniProtAcc | P63316 |
Top |
Malignant transformation analysis |
| Identification of the aberrant gene expression in precancerous and cancerous lesions by comparing the gene expression of stem-like cells in diseased tissues with normal stem cells |
| Entrez ID | Symbol | Replicates | Species | Organ | Tissue | Adj P-value | Log2FC | Malignancy |
| 7134 | TNNC1 | C09 | Human | Oral cavity | OSCC | 4.87e-04 | 9.85e-02 | 0.1431 |
| 7134 | TNNC1 | SYSMH5 | Human | Oral cavity | OSCC | 8.47e-05 | 2.11e+00 | 0.0647 |
| Page: 1 |
| Tissue | Expression Dynamics | Abbreviation |
| Oral Cavity | 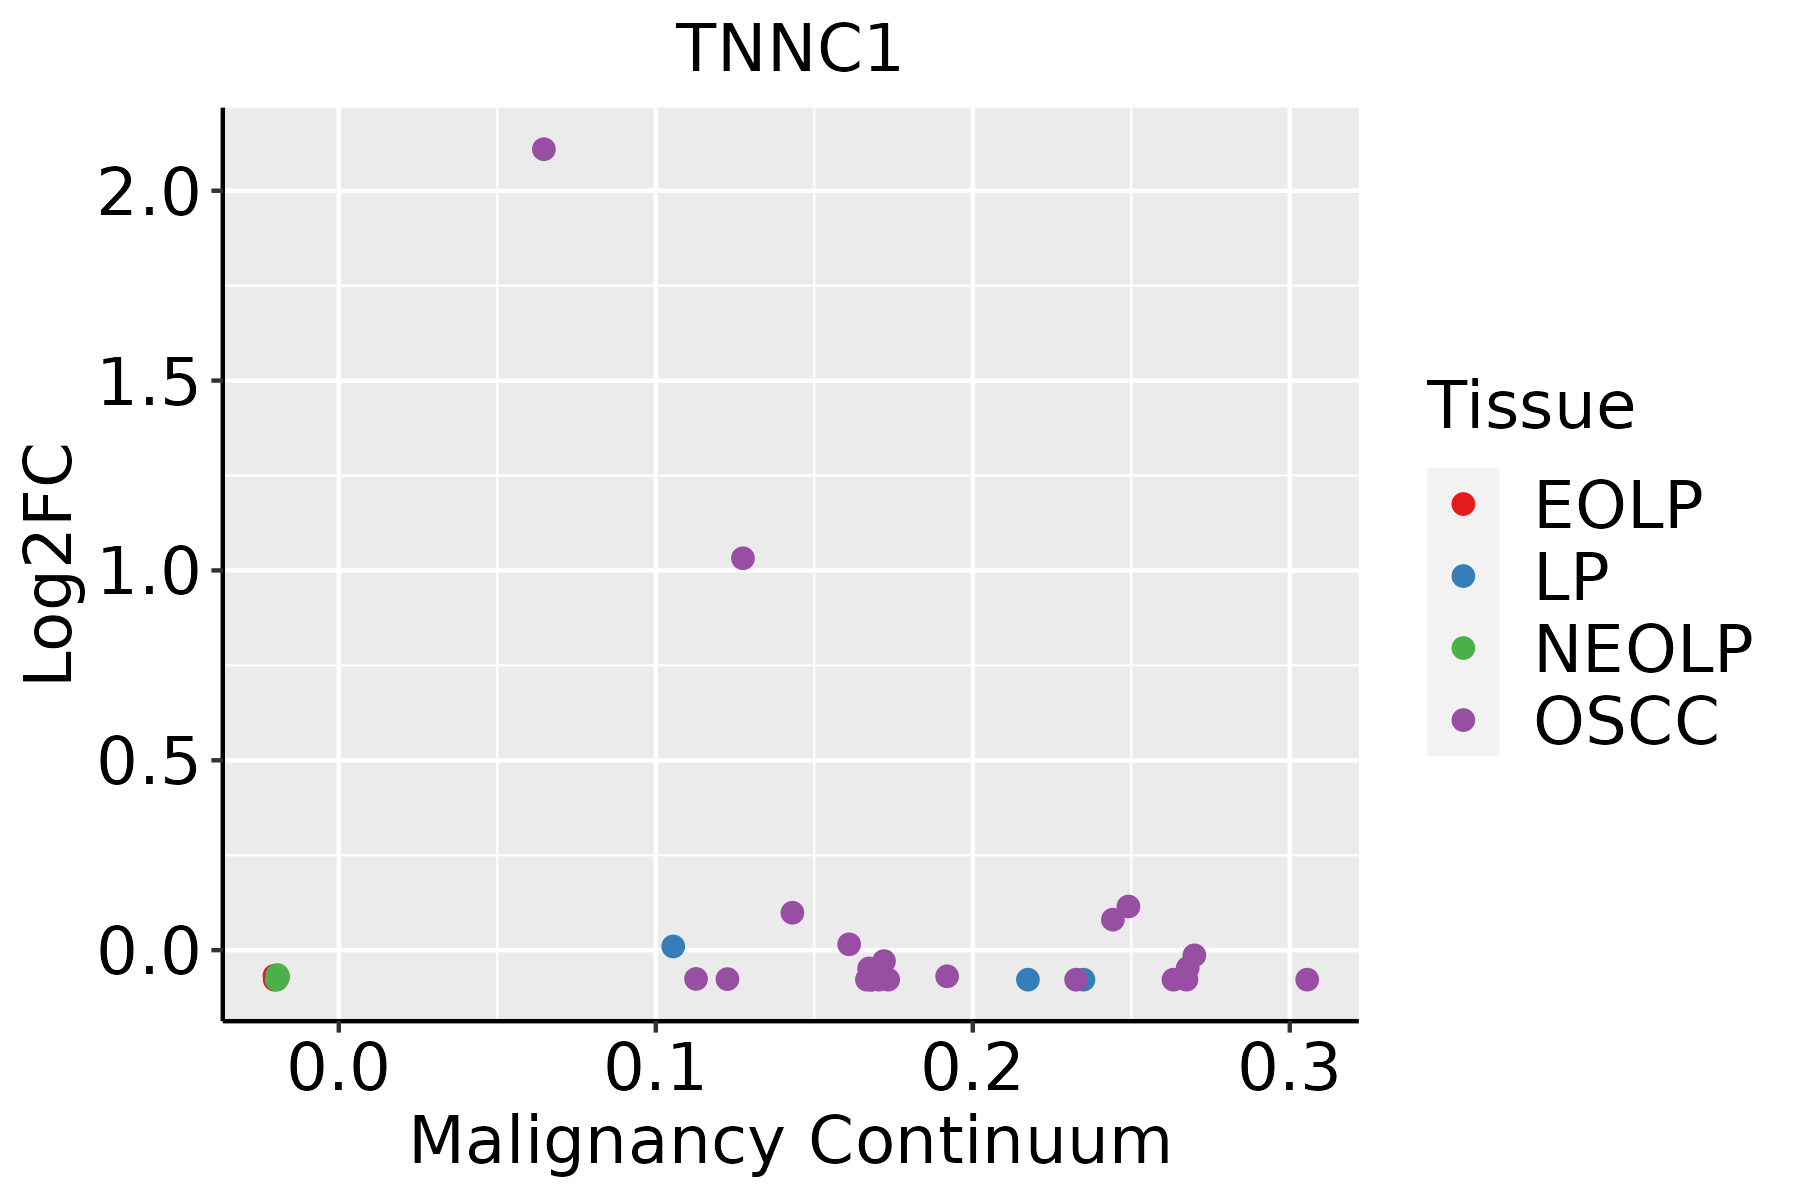 | EOLP: Erosive Oral lichen planus |
| LP: leukoplakia | ||
| NEOLP: Non-erosive oral lichen planus | ||
| OSCC: Oral squamous cell carcinoma |
| ∗log2FC in expression of this searched gene in stem-like cells from each diseased tissue sample relative to stem-like cells in normal samples in each tissue plotted against the malignancy continuum. Samples are colored based on if they are from different disease stage. |
Top |
Malignant transformation related pathway analysis |
| Find out the enriched GO biological processes and KEGG pathways involved in transition from healthy to precancer to cancer |
| Tissue | Disease Stage | Enriched GO biological Processes |
| Colorectum | AD |  |
| Colorectum | SER |  |
| Colorectum | MSS |  |
| Colorectum | MSI-H |  |
| Colorectum | FAP |  |
| ∗Top 15 enriched GO BP terms are showed in the bar plot of each disease state in each tissue. Each row represents a significant GO biological process which is colored according to the -log10(p.adjust). |
| Page: 1 2 3 4 5 6 7 8 9 |
| GO ID | Tissue | Disease Stage | Description | Gene Ratio | Bg Ratio | pvalue | p.adjust | Count |
| GO:003238615 | Oral cavity | OSCC | regulation of intracellular transport | 218/7305 | 337/18723 | 6.91e-22 | 1.41e-19 | 218 |
| GO:003297020 | Oral cavity | OSCC | regulation of actin filament-based process | 209/7305 | 397/18723 | 1.89e-08 | 3.72e-07 | 209 |
| GO:001003820 | Oral cavity | OSCC | response to metal ion | 188/7305 | 373/18723 | 4.34e-06 | 5.00e-05 | 188 |
| GO:00605378 | Oral cavity | OSCC | muscle tissue development | 185/7305 | 403/18723 | 2.60e-03 | 1.14e-02 | 185 |
| GO:00434626 | Oral cavity | OSCC | regulation of ATPase activity | 27/7305 | 46/18723 | 5.33e-03 | 2.07e-02 | 27 |
| GO:00147067 | Oral cavity | OSCC | striated muscle tissue development | 174/7305 | 384/18723 | 6.45e-03 | 2.40e-02 | 174 |
| Page: 1 |
| Pathway ID | Tissue | Disease Stage | Description | Gene Ratio | Bg Ratio | pvalue | p.adjust | qvalue | Count |
| Page: 1 |
Top |
Cell-cell communication analysis |
| Identification of potential cell-cell interactions between two cell types and their ligand-receptor pairs for different disease states |
| Ligand | Receptor | LRpair | Pathway | Tissue | Disease Stage |
| Page: 1 |
Top |
Single-cell gene regulatory network inference analysis |
| Find out the significant the regulons (TFs) and the target genes of each regulon across cell types for different disease states |
| TF | Cell Type | Tissue | Disease Stage | Target Gene | RSS | Regulon Activity |
| ∗The dot plots of a searched regulon are shown for all cell subpopulations in each disease state of each tissue based on the regulon specific score inferred using pySCENIC and by calculating the average expression. |
| Page: 1 |
Top |
Somatic mutation of malignant transformation related genes |
| Annotation of somatic variants for genes involved in malignant transformation |
| Hugo Symbol | Variant Class | Variant Classification | dbSNP RS | HGVSc | HGVSp | HGVSp Short | SWISSPROT | BIOTYPE | SIFT | PolyPhen | Tumor Sample Barcode | Tissue | Histology | Sex | Age | Stage | Therapy Types | Drugs | Outcome |
| TNNC1 | SNV | Missense_Mutation | novel | c.40N>A | p.Glu14Lys | p.E14K | P63316 | protein_coding | tolerated(0.1) | benign(0.013) | TCGA-DS-A1OC-01 | Cervix | cervical & endocervical cancer | Female | <65 | I/II | Chemotherapy | gemcitabine | SD |
| TNNC1 | SNV | Missense_Mutation | rs397516849 | c.445N>A | p.Asp149Asn | p.D149N | P63316 | protein_coding | tolerated(1) | probably_damaging(0.992) | TCGA-AZ-6598-01 | Colorectum | colon adenocarcinoma | Female | >=65 | I/II | Unknown | Unknown | SD |
| TNNC1 | SNV | Missense_Mutation | rs796243470 | c.439N>T | p.Arg147Cys | p.R147C | P63316 | protein_coding | deleterious(0) | benign(0.413) | TCGA-CM-4743-01 | Colorectum | colon adenocarcinoma | Male | >=65 | I/II | Chemotherapy | capecitabine | SD |
| TNNC1 | SNV | Missense_Mutation | novel | c.275N>C | p.Lys92Thr | p.K92T | P63316 | protein_coding | tolerated(0.09) | benign(0.086) | TCGA-AJ-A3EL-01 | Endometrium | uterine corpus endometrioid carcinoma | Female | <65 | I/II | Unknown | Unknown | SD |
| TNNC1 | SNV | Missense_Mutation | rs730881058 | c.262N>A | p.Asp88Asn | p.D88N | P63316 | protein_coding | tolerated(0.21) | benign(0.031) | TCGA-AP-A059-01 | Endometrium | uterine corpus endometrioid carcinoma | Female | >=65 | I/II | Unknown | Unknown | SD |
| TNNC1 | SNV | Missense_Mutation | rs397516849 | c.445N>A | p.Asp149Asn | p.D149N | P63316 | protein_coding | tolerated(1) | probably_damaging(0.992) | TCGA-AX-A1CE-01 | Endometrium | uterine corpus endometrioid carcinoma | Female | <65 | I/II | Unspecific | Paclitaxel | SD |
| TNNC1 | SNV | Missense_Mutation | c.271N>T | p.Gly91Trp | p.G91W | P63316 | protein_coding | deleterious(0) | possibly_damaging(0.752) | TCGA-BG-A0M0-01 | Endometrium | uterine corpus endometrioid carcinoma | Female | >=65 | I/II | Unknown | Unknown | SD | |
| TNNC1 | SNV | Missense_Mutation | rs730881064 | c.73G>A | p.Asp25Asn | p.D25N | P63316 | protein_coding | tolerated(0.06) | benign(0.058) | TCGA-E6-A1LX-01 | Endometrium | uterine corpus endometrioid carcinoma | Female | <65 | I/II | Unknown | Unknown | SD |
| TNNC1 | SNV | Missense_Mutation | c.110N>A | p.Ser37Asn | p.S37N | P63316 | protein_coding | deleterious(0) | possibly_damaging(0.795) | TCGA-EO-A3AU-01 | Endometrium | uterine corpus endometrioid carcinoma | Female | >=65 | I/II | Unknown | Unknown | PD | |
| TNNC1 | SNV | Missense_Mutation | rs796243470 | c.439N>T | p.Arg147Cys | p.R147C | P63316 | protein_coding | deleterious(0) | benign(0.413) | TCGA-33-4532-01 | Lung | lung squamous cell carcinoma | Male | >=65 | I/II | Unknown | Unknown | SD |
| Page: 1 2 |
Top |
Related drugs of malignant transformation related genes |
| Identification of chemicals and drugs interact with genes involved in malignant transfromation |
| (DGIdb 4.0) |
| Entrez ID | Symbol | Category | Interaction Types | Drug Claim Name | Drug Name | PMIDs |
| 7134 | TNNC1 | DRUGGABLE GENOME | TIRAMSETIV | |||
| 7134 | TNNC1 | DRUGGABLE GENOME | Levosimendan | LEVOSIMENDAN | ||
| 7134 | TNNC1 | DRUGGABLE GENOME | LEVOSIMENDAN | LEVOSIMENDAN | ||
| 7134 | TNNC1 | DRUGGABLE GENOME | LEVOSIMENDAN | LEVOSIMENDAN | ||
| 7134 | TNNC1 | DRUGGABLE GENOME | PURPUROGALLIN | PURPUROGALLIN | ||
| 7134 | TNNC1 | DRUGGABLE GENOME | Dihydroxyaluminium | |||
| 7134 | TNNC1 | DRUGGABLE GENOME | BEPRIDIL | BEPRIDIL | ||
| 7134 | TNNC1 | DRUGGABLE GENOME | PYROGALLOL RED | PYROGALLOL RED | ||
| 7134 | TNNC1 | DRUGGABLE GENOME | NSC-107022 | CHEMBL1601846 | ||
| 7134 | TNNC1 | DRUGGABLE GENOME | BEPRIDIL | BEPRIDIL |
| Page: 1 |

Copyright 2023-Present -The University of Texas Health Science Center at Houston |