
|
|||||
|
 | |
| |
| |
| |
| |
| |
|
Gene: TNKS2 |
Gene summary for TNKS2 |
| Gene information | Species | Human | Gene symbol | TNKS2 | Gene ID | 80351 |
| Gene name | tankyrase 2 | |
| Gene Alias | ARTD6 | |
| Cytomap | 10q23.32 | |
| Gene Type | protein-coding | GO ID | GO:0000209 | UniProtAcc | Q9H2K2 |
Top |
Malignant transformation analysis |
| Identification of the aberrant gene expression in precancerous and cancerous lesions by comparing the gene expression of stem-like cells in diseased tissues with normal stem cells |
| Entrez ID | Symbol | Replicates | Species | Organ | Tissue | Adj P-value | Log2FC | Malignancy |
| 80351 | TNKS2 | LZE4T | Human | Esophagus | ESCC | 7.79e-04 | 8.95e-02 | 0.0811 |
| 80351 | TNKS2 | LZE5T | Human | Esophagus | ESCC | 2.26e-02 | 3.90e-01 | 0.0514 |
| 80351 | TNKS2 | LZE8T | Human | Esophagus | ESCC | 3.71e-05 | 2.89e-02 | 0.067 |
| 80351 | TNKS2 | LZE20T | Human | Esophagus | ESCC | 6.19e-05 | 1.10e-01 | 0.0662 |
| 80351 | TNKS2 | LZE22D1 | Human | Esophagus | HGIN | 4.58e-03 | 2.90e-02 | 0.0595 |
| 80351 | TNKS2 | LZE22T | Human | Esophagus | ESCC | 1.05e-02 | 2.17e-01 | 0.068 |
| 80351 | TNKS2 | LZE24T | Human | Esophagus | ESCC | 3.18e-26 | 7.01e-01 | 0.0596 |
| 80351 | TNKS2 | LZE21T | Human | Esophagus | ESCC | 3.60e-04 | 2.78e-01 | 0.0655 |
| 80351 | TNKS2 | P1T-E | Human | Esophagus | ESCC | 1.52e-12 | 6.29e-01 | 0.0875 |
| 80351 | TNKS2 | P2T-E | Human | Esophagus | ESCC | 1.10e-23 | 5.34e-01 | 0.1177 |
| 80351 | TNKS2 | P4T-E | Human | Esophagus | ESCC | 7.35e-21 | 4.87e-01 | 0.1323 |
| 80351 | TNKS2 | P5T-E | Human | Esophagus | ESCC | 3.17e-17 | 1.85e-01 | 0.1327 |
| 80351 | TNKS2 | P8T-E | Human | Esophagus | ESCC | 1.29e-20 | 4.07e-01 | 0.0889 |
| 80351 | TNKS2 | P9T-E | Human | Esophagus | ESCC | 4.02e-08 | 9.39e-02 | 0.1131 |
| 80351 | TNKS2 | P10T-E | Human | Esophagus | ESCC | 4.92e-13 | 1.19e-01 | 0.116 |
| 80351 | TNKS2 | P11T-E | Human | Esophagus | ESCC | 3.87e-07 | 4.13e-01 | 0.1426 |
| 80351 | TNKS2 | P12T-E | Human | Esophagus | ESCC | 1.11e-21 | 4.59e-01 | 0.1122 |
| 80351 | TNKS2 | P15T-E | Human | Esophagus | ESCC | 3.55e-20 | 5.02e-01 | 0.1149 |
| 80351 | TNKS2 | P16T-E | Human | Esophagus | ESCC | 2.06e-21 | 3.75e-01 | 0.1153 |
| 80351 | TNKS2 | P17T-E | Human | Esophagus | ESCC | 4.07e-07 | 2.43e-01 | 0.1278 |
| Page: 1 2 3 4 5 6 7 |
| Tissue | Expression Dynamics | Abbreviation |
| Esophagus |  | ESCC: Esophageal squamous cell carcinoma |
| HGIN: High-grade intraepithelial neoplasias | ||
| LGIN: Low-grade intraepithelial neoplasias | ||
| Liver | 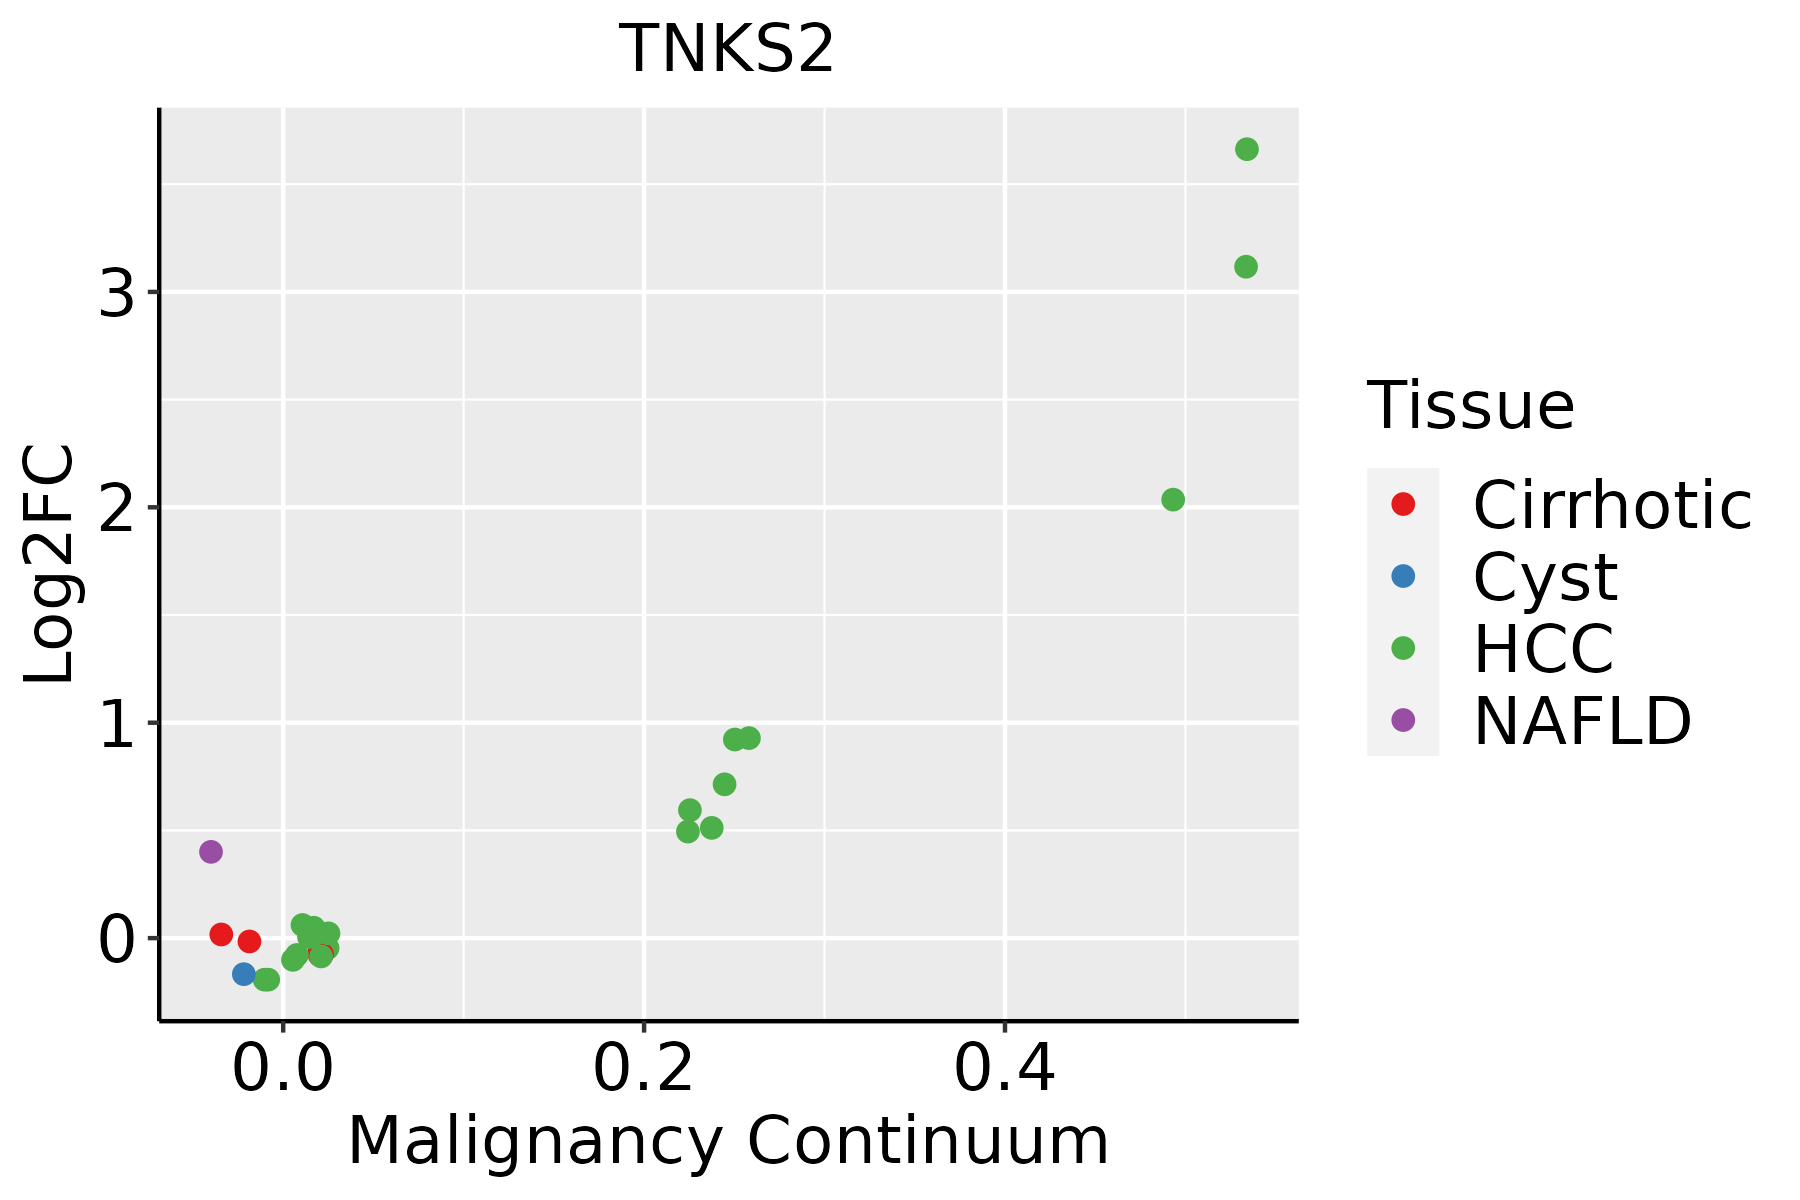 | HCC: Hepatocellular carcinoma |
| NAFLD: Non-alcoholic fatty liver disease | ||
| Lung | 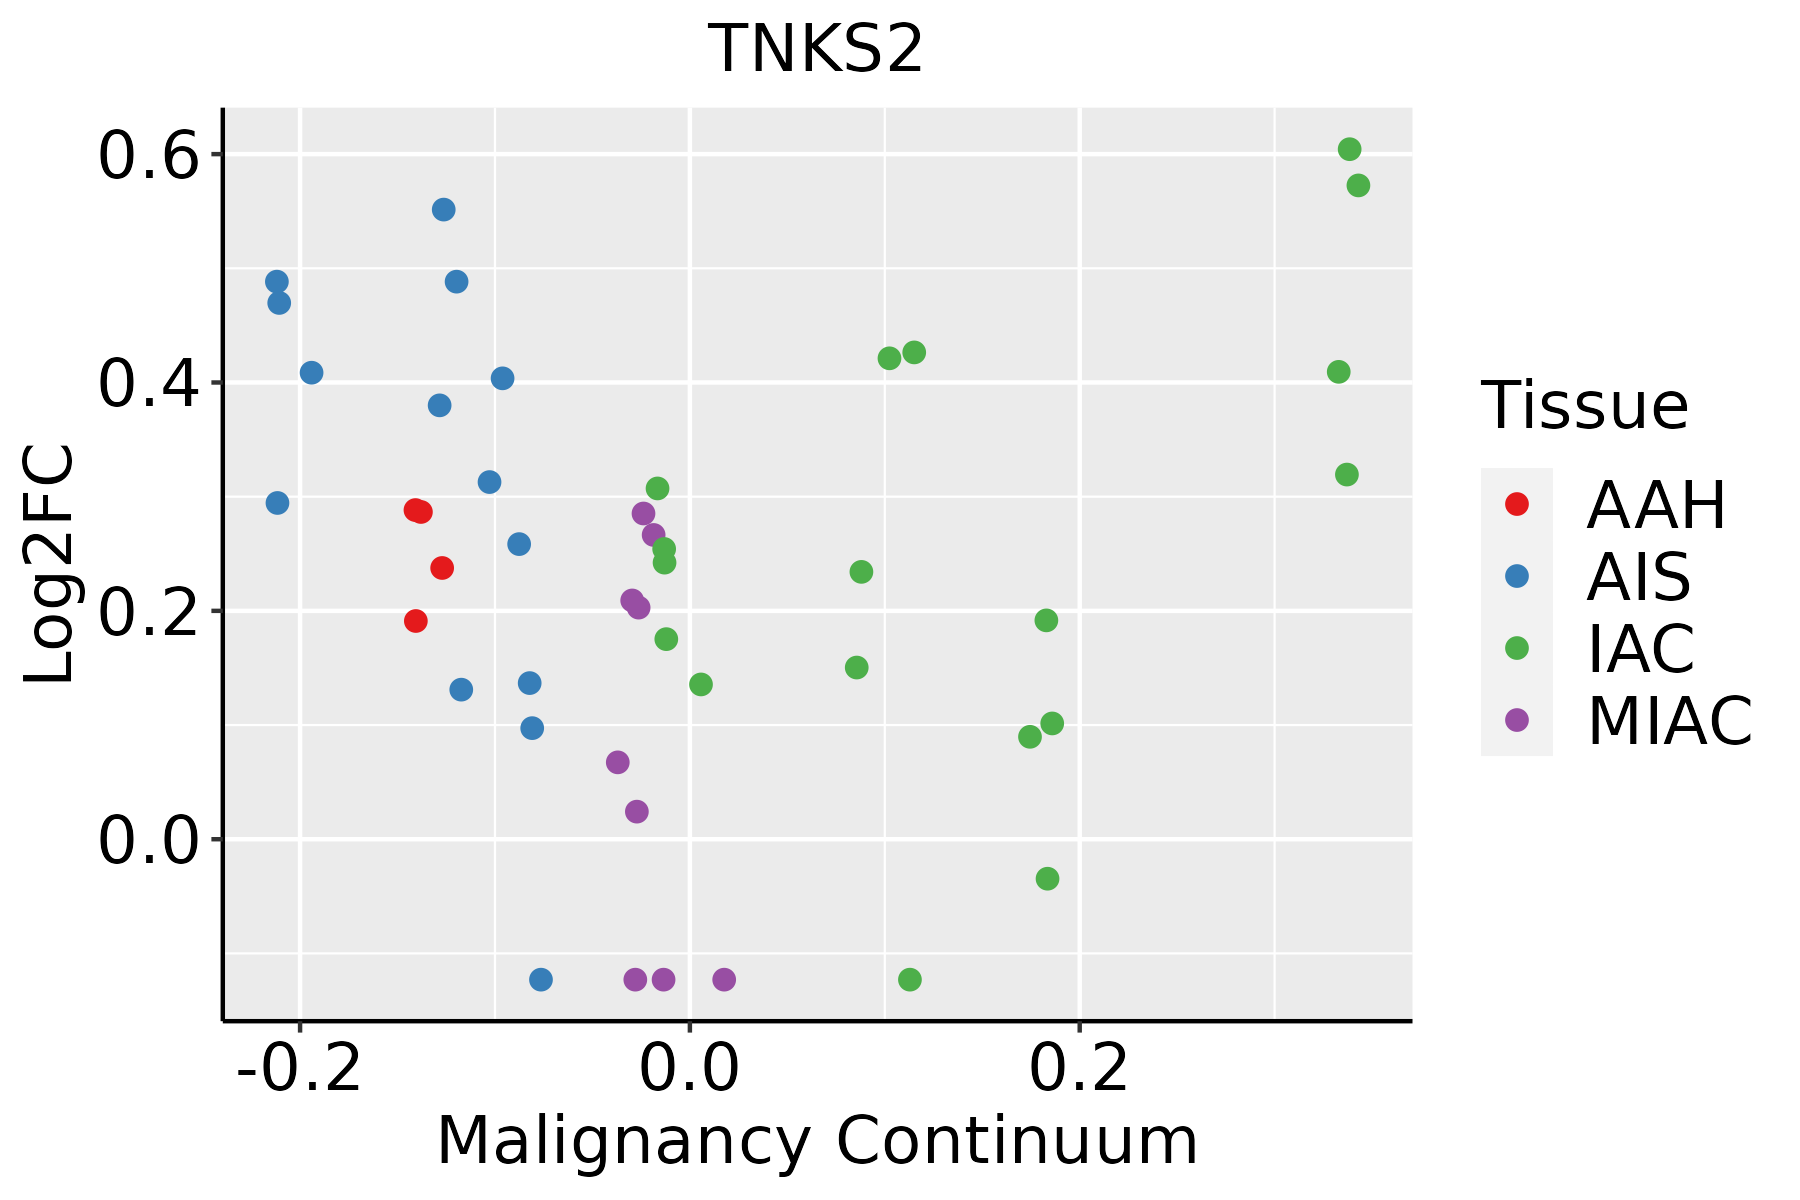 | AAH: Atypical adenomatous hyperplasia |
| AIS: Adenocarcinoma in situ | ||
| IAC: Invasive lung adenocarcinoma | ||
| MIA: Minimally invasive adenocarcinoma | ||
| Oral Cavity | 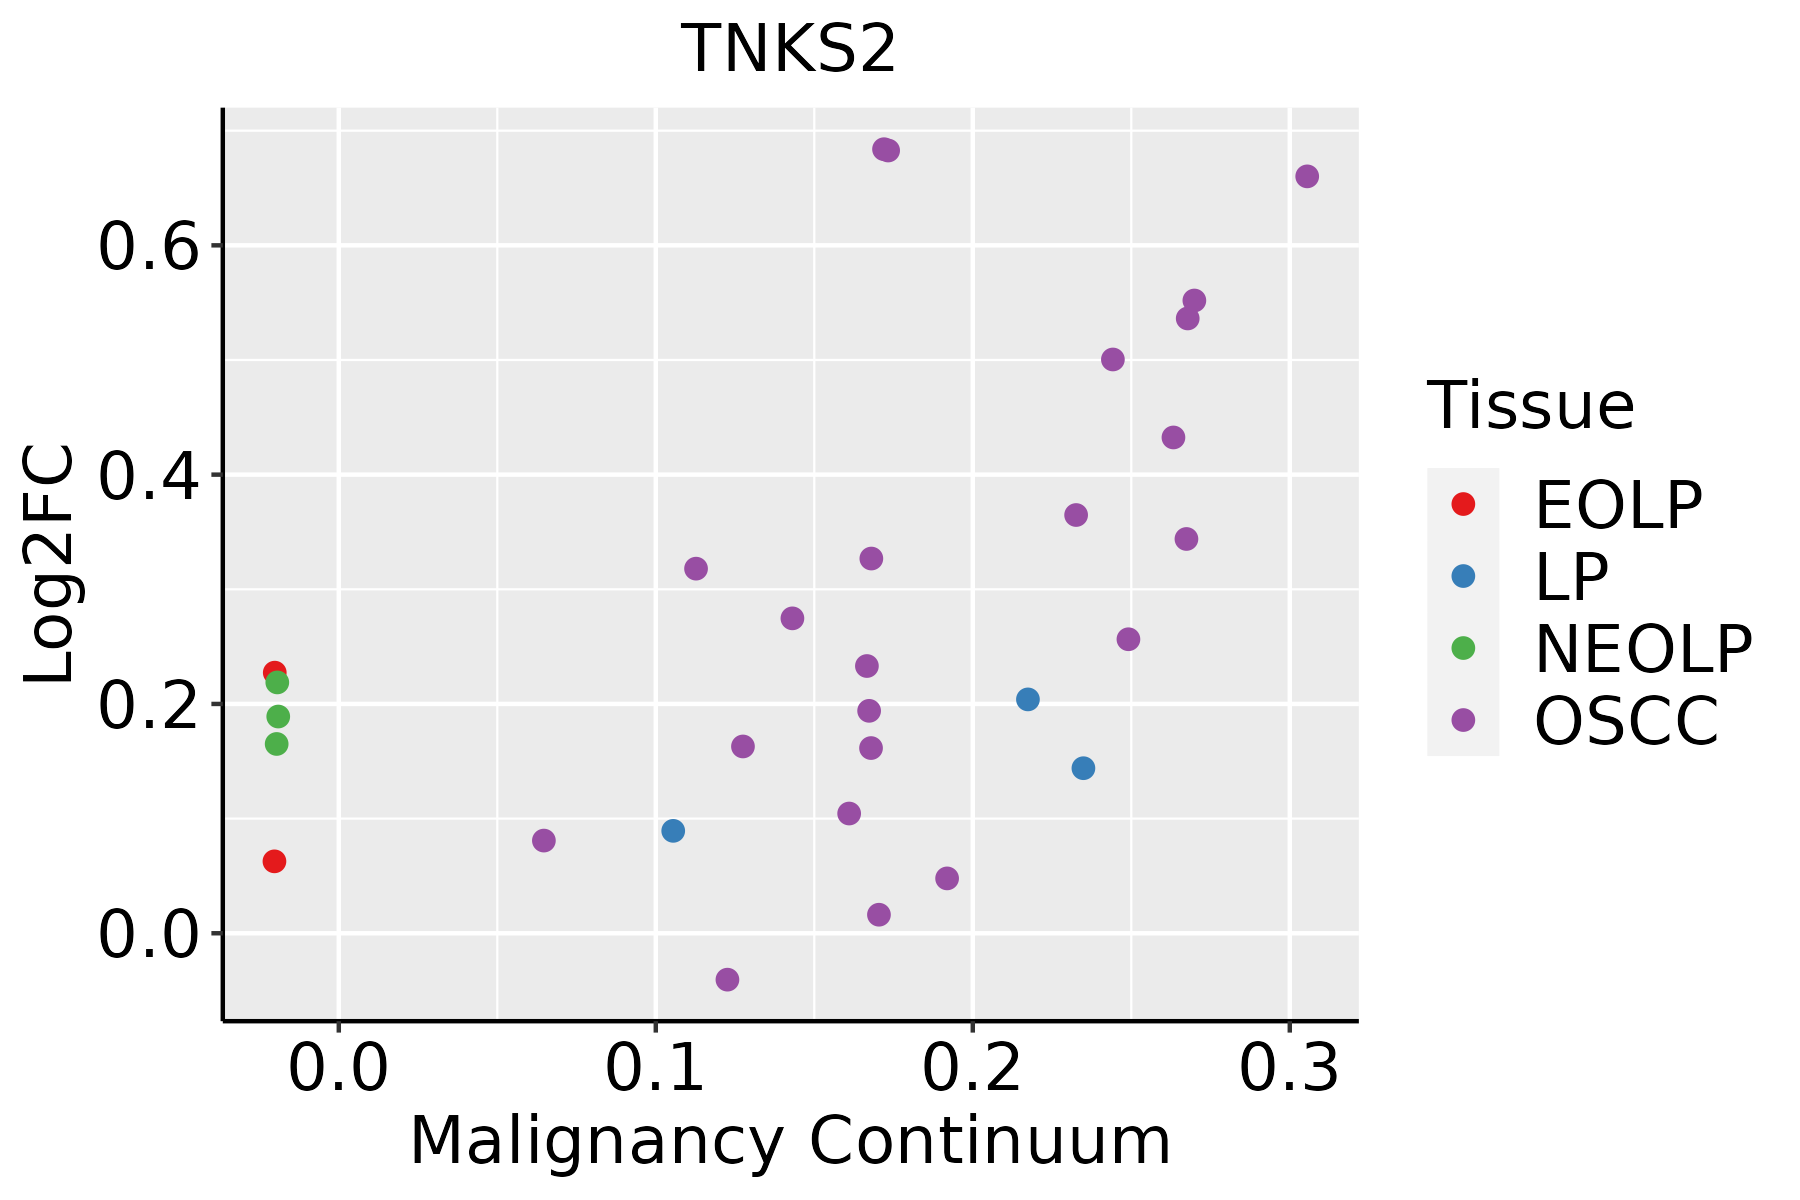 | EOLP: Erosive Oral lichen planus |
| LP: leukoplakia | ||
| NEOLP: Non-erosive oral lichen planus | ||
| OSCC: Oral squamous cell carcinoma | ||
| Prostate |  | BPH: Benign Prostatic Hyperplasia |
| Thyroid |  | ATC: Anaplastic thyroid cancer |
| HT: Hashimoto's thyroiditis | ||
| PTC: Papillary thyroid cancer |
| ∗log2FC in expression of this searched gene in stem-like cells from each diseased tissue sample relative to stem-like cells in normal samples in each tissue plotted against the malignancy continuum. Samples are colored based on if they are from different disease stage. |
Top |
Malignant transformation related pathway analysis |
| Find out the enriched GO biological processes and KEGG pathways involved in transition from healthy to precancer to cancer |
| Tissue | Disease Stage | Enriched GO biological Processes |
| Colorectum | AD |  |
| Colorectum | SER |  |
| Colorectum | MSS |  |
| Colorectum | MSI-H |  |
| Colorectum | FAP |  |
| ∗Top 15 enriched GO BP terms are showed in the bar plot of each disease state in each tissue. Each row represents a significant GO biological process which is colored according to the -log10(p.adjust). |
| Page: 1 2 3 4 5 6 7 8 9 |
| GO ID | Tissue | Disease Stage | Description | Gene Ratio | Bg Ratio | pvalue | p.adjust | Count |
| GO:200125218 | Esophagus | HGIN | positive regulation of chromosome organization | 30/2587 | 82/18723 | 2.00e-07 | 9.68e-06 | 30 |
| GO:00330449 | Esophagus | HGIN | regulation of chromosome organization | 51/2587 | 187/18723 | 8.91e-07 | 3.61e-05 | 51 |
| GO:001063920 | Esophagus | HGIN | negative regulation of organelle organization | 79/2587 | 348/18723 | 4.12e-06 | 1.37e-04 | 79 |
| GO:000072318 | Esophagus | HGIN | telomere maintenance | 38/2587 | 131/18723 | 4.38e-06 | 1.42e-04 | 38 |
| GO:003220416 | Esophagus | HGIN | regulation of telomere maintenance | 27/2587 | 80/18723 | 4.83e-06 | 1.56e-04 | 27 |
| GO:000020916 | Esophagus | HGIN | protein polyubiquitination | 58/2587 | 236/18723 | 6.29e-06 | 1.97e-04 | 58 |
| GO:003220617 | Esophagus | HGIN | positive regulation of telomere maintenance | 20/2587 | 52/18723 | 8.82e-06 | 2.64e-04 | 20 |
| GO:005105214 | Esophagus | HGIN | regulation of DNA metabolic process | 79/2587 | 359/18723 | 1.38e-05 | 3.85e-04 | 79 |
| GO:007189710 | Esophagus | HGIN | DNA biosynthetic process | 44/2587 | 180/18723 | 8.97e-05 | 1.96e-03 | 44 |
| GO:005105416 | Esophagus | HGIN | positive regulation of DNA metabolic process | 47/2587 | 201/18723 | 1.65e-04 | 3.21e-03 | 47 |
| GO:00701987 | Esophagus | HGIN | protein localization to chromosome, telomeric region | 12/2587 | 29/18723 | 2.48e-04 | 4.38e-03 | 12 |
| GO:000700417 | Esophagus | HGIN | telomere maintenance via telomerase | 21/2587 | 69/18723 | 2.80e-04 | 4.80e-03 | 21 |
| GO:00322007 | Esophagus | HGIN | telomere organization | 38/2587 | 159/18723 | 4.23e-04 | 6.39e-03 | 38 |
| GO:200027819 | Esophagus | HGIN | regulation of DNA biosynthetic process | 28/2587 | 106/18723 | 4.30e-04 | 6.47e-03 | 28 |
| GO:001083318 | Esophagus | HGIN | telomere maintenance via telomere lengthening | 23/2587 | 81/18723 | 4.52e-04 | 6.62e-03 | 23 |
| GO:000627810 | Esophagus | HGIN | RNA-dependent DNA biosynthetic process | 21/2587 | 75/18723 | 9.58e-04 | 1.21e-02 | 21 |
| GO:00345024 | Esophagus | HGIN | protein localization to chromosome | 24/2587 | 92/18723 | 1.29e-03 | 1.54e-02 | 24 |
| GO:003011116 | Esophagus | HGIN | regulation of Wnt signaling pathway | 65/2587 | 328/18723 | 1.53e-03 | 1.77e-02 | 65 |
| GO:009026310 | Esophagus | HGIN | positive regulation of canonical Wnt signaling pathway | 26/2587 | 106/18723 | 2.17e-03 | 2.25e-02 | 26 |
| GO:001605516 | Esophagus | HGIN | Wnt signaling pathway | 83/2587 | 444/18723 | 2.27e-03 | 2.33e-02 | 83 |
| Page: 1 2 3 4 5 6 7 8 9 10 11 12 13 14 15 16 |
| Pathway ID | Tissue | Disease Stage | Description | Gene Ratio | Bg Ratio | pvalue | p.adjust | qvalue | Count |
| Page: 1 |
Top |
Cell-cell communication analysis |
| Identification of potential cell-cell interactions between two cell types and their ligand-receptor pairs for different disease states |
| Ligand | Receptor | LRpair | Pathway | Tissue | Disease Stage |
| Page: 1 |
Top |
Single-cell gene regulatory network inference analysis |
| Find out the significant the regulons (TFs) and the target genes of each regulon across cell types for different disease states |
| TF | Cell Type | Tissue | Disease Stage | Target Gene | RSS | Regulon Activity |
| ∗The dot plots of a searched regulon are shown for all cell subpopulations in each disease state of each tissue based on the regulon specific score inferred using pySCENIC and by calculating the average expression. |
| Page: 1 |
Top |
Somatic mutation of malignant transformation related genes |
| Annotation of somatic variants for genes involved in malignant transformation |
| Hugo Symbol | Variant Class | Variant Classification | dbSNP RS | HGVSc | HGVSp | HGVSp Short | SWISSPROT | BIOTYPE | SIFT | PolyPhen | Tumor Sample Barcode | Tissue | Histology | Sex | Age | Stage | Therapy Types | Drugs | Outcome |
| TNKS2 | SNV | Missense_Mutation | novel | c.2611G>T | p.Val871Phe | p.V871F | Q9H2K2 | protein_coding | tolerated(0.44) | benign(0.003) | TCGA-A2-A04Y-01 | Breast | breast invasive carcinoma | Female | <65 | I/II | Chemotherapy | cytoxan | SD |
| TNKS2 | SNV | Missense_Mutation | novel | c.536N>T | p.Asp179Val | p.D179V | Q9H2K2 | protein_coding | deleterious(0) | probably_damaging(0.939) | TCGA-A8-A06X-01 | Breast | breast invasive carcinoma | Female | >=65 | I/II | Unknown | Unknown | SD |
| TNKS2 | SNV | Missense_Mutation | novel | c.1169N>A | p.Gly390Glu | p.G390E | Q9H2K2 | protein_coding | deleterious(0) | probably_damaging(0.997) | TCGA-A8-A08P-01 | Breast | breast invasive carcinoma | Female | >=65 | III/IV | Chemotherapy | 5-fluorouracil | CR |
| TNKS2 | SNV | Missense_Mutation | c.2342N>T | p.Pro781Leu | p.P781L | Q9H2K2 | protein_coding | deleterious(0) | possibly_damaging(0.687) | TCGA-A8-A09Z-01 | Breast | breast invasive carcinoma | Female | >=65 | I/II | Unknown | Unknown | SD | |
| TNKS2 | SNV | Missense_Mutation | novel | c.3187N>A | p.Glu1063Lys | p.E1063K | Q9H2K2 | protein_coding | deleterious(0) | probably_damaging(0.997) | TCGA-AO-A0JC-01 | Breast | breast invasive carcinoma | Female | <65 | I/II | Chemotherapy | fluorouracil | SD |
| TNKS2 | SNV | Missense_Mutation | novel | c.2855N>T | p.Gly952Val | p.G952V | Q9H2K2 | protein_coding | deleterious(0) | probably_damaging(0.984) | TCGA-BH-A0H5-01 | Breast | breast invasive carcinoma | Female | <65 | I/II | Chemotherapy | cytoxan | CR |
| TNKS2 | SNV | Missense_Mutation | rs758437700 | c.2251G>A | p.Glu751Lys | p.E751K | Q9H2K2 | protein_coding | tolerated(0.06) | probably_damaging(1) | TCGA-BH-A18G-01 | Breast | breast invasive carcinoma | Female | >=65 | I/II | Unknown | Unknown | SD |
| TNKS2 | SNV | Missense_Mutation | c.1225N>C | p.Glu409Gln | p.E409Q | Q9H2K2 | protein_coding | tolerated(0.11) | benign(0.038) | TCGA-D8-A1JA-01 | Breast | breast invasive carcinoma | Female | <65 | III/IV | Chemotherapy | adriamycin | PD | |
| TNKS2 | SNV | Missense_Mutation | c.265G>A | p.Asp89Asn | p.D89N | Q9H2K2 | protein_coding | tolerated(0.14) | probably_damaging(0.992) | TCGA-E2-A159-01 | Breast | breast invasive carcinoma | Female | <65 | I/II | Chemotherapy | cyclophosphamide | SD | |
| TNKS2 | insertion | Frame_Shift_Ins | novel | c.1377_1378insATGGAAGAATTGGGTTTCAGCTTATTAAGGATCTCAA | p.Asn460MetfsTer28 | p.N460Mfs*28 | Q9H2K2 | protein_coding | TCGA-AN-A04C-01 | Breast | breast invasive carcinoma | Female | <65 | I/II | Unknown | Unknown | SD |
| Page: 1 2 3 4 5 6 7 8 9 10 11 12 |
Top |
Related drugs of malignant transformation related genes |
| Identification of chemicals and drugs interact with genes involved in malignant transfromation |
| (DGIdb 4.0) |
| Entrez ID | Symbol | Category | Interaction Types | Drug Claim Name | Drug Name | PMIDs |
| 80351 | TNKS2 | DRUGGABLE GENOME, ENZYME | inhibitor | 404859121 | ||
| 80351 | TNKS2 | DRUGGABLE GENOME, ENZYME | inhibitor | 404859119 | ||
| 80351 | TNKS2 | DRUGGABLE GENOME, ENZYME | inhibitor | 404859123 | ||
| 80351 | TNKS2 | DRUGGABLE GENOME, ENZYME | PMID27841036-Compound-37 | |||
| 80351 | TNKS2 | DRUGGABLE GENOME, ENZYME | inhibitor | 404859118 | ||
| 80351 | TNKS2 | DRUGGABLE GENOME, ENZYME | inhibitor | 404859120 |
| Page: 1 |

Copyright 2023-Present -The University of Texas Health Science Center at Houston |