Schematic overview of the cellular and molecular mechanisms involved in the cancer progression, including the proposed cellular and molecular mechanisms in cancer cells trajectory. AT1: alveolar type 1 cells; AT2: alveolar type 2 cells; AAH: atypical adenomatous hyperplasia; AIS: adenocarcinoma in situ; MIA: minimally invasive adenocarcinoma; IA: invasive adenocarcinoma; EMT: epithelial-mesenchymal transition

Home

Download

Statistics

Help

Contact

Center for Computational Systems Medicine
leaf

Gene summary

leaf

Malignant transformation analysis

leaf

Malignant transformation related pathway analysis

leaf

Cell-cell communication analysis

leaf

Single-cell gene regulatory network inference analysis

leaf

Somatic mutation of malignant transformation related genes

leaf

Related drugs of malignant transformation related genes

Gene: TNKS1BP1

Gene summary for TNKS1BP1

check button Gene summary.

Gene informationSpeciesHuman
Gene symbol

TNKS1BP1

Gene ID

85456

Gene nametankyrase 1 binding protein 1
Gene AliasTAB182
Cytomap11q12.1
Gene Typeprotein-coding
GO ID

GO:0000723

UniProtAcc

A0A024R542


Top

Malignant transformation analysis

check button Identification of the aberrant gene expression in precancerous and cancerous lesions by comparing the gene expression of stem-like cells in diseased tissues with normal stem cells
check button Malignant transformation involving gene list.
Entrez IDSymbolReplicatesSpeciesOrganTissueAdj P-valueLog2FCMalignancy
85456TNKS1BP1LZE4THumanEsophagusESCC1.39e-072.66e-010.0811
85456TNKS1BP1LZE7THumanEsophagusESCC4.40e-038.63e-030.0667
85456TNKS1BP1LZE8THumanEsophagusESCC2.48e-062.75e-010.067
85456TNKS1BP1LZE20THumanEsophagusESCC1.81e-035.14e-020.0662
85456TNKS1BP1LZE24THumanEsophagusESCC2.51e-113.05e-010.0596
85456TNKS1BP1P1T-EHumanEsophagusESCC6.12e-103.30e-010.0875
85456TNKS1BP1P2T-EHumanEsophagusESCC1.14e-113.39e-010.1177
85456TNKS1BP1P4T-EHumanEsophagusESCC1.70e-185.23e-010.1323
85456TNKS1BP1P5T-EHumanEsophagusESCC1.57e-162.62e-010.1327
85456TNKS1BP1P8T-EHumanEsophagusESCC6.94e-245.99e-010.0889
85456TNKS1BP1P9T-EHumanEsophagusESCC5.33e-103.27e-010.1131
85456TNKS1BP1P10T-EHumanEsophagusESCC1.71e-051.95e-020.116
85456TNKS1BP1P11T-EHumanEsophagusESCC2.89e-036.15e-010.1426
85456TNKS1BP1P12T-EHumanEsophagusESCC1.38e-164.87e-010.1122
85456TNKS1BP1P15T-EHumanEsophagusESCC2.60e-082.54e-010.1149
85456TNKS1BP1P16T-EHumanEsophagusESCC3.04e-05-7.29e-020.1153
85456TNKS1BP1P17T-EHumanEsophagusESCC1.37e-103.93e-010.1278
85456TNKS1BP1P19T-EHumanEsophagusESCC1.11e-032.78e-010.1662
85456TNKS1BP1P20T-EHumanEsophagusESCC1.59e-101.17e-010.1124
85456TNKS1BP1P21T-EHumanEsophagusESCC7.78e-214.60e-010.1617
Page: 1 2 3 4 5 6 

check button Transcriptomic changes along malignancy continuum.
TissueExpression DynamicsAbbreviation
EsophagusThe image shows the transcriptomic changes along malignancy continuum.log2FC in expression of this searched gene in stem-like cells from each diseased tissue sample relative to stem-like cells in normal samples in each tissue plotted against the malignancy continuum. Samples are colored based on if they are from different disease stage.
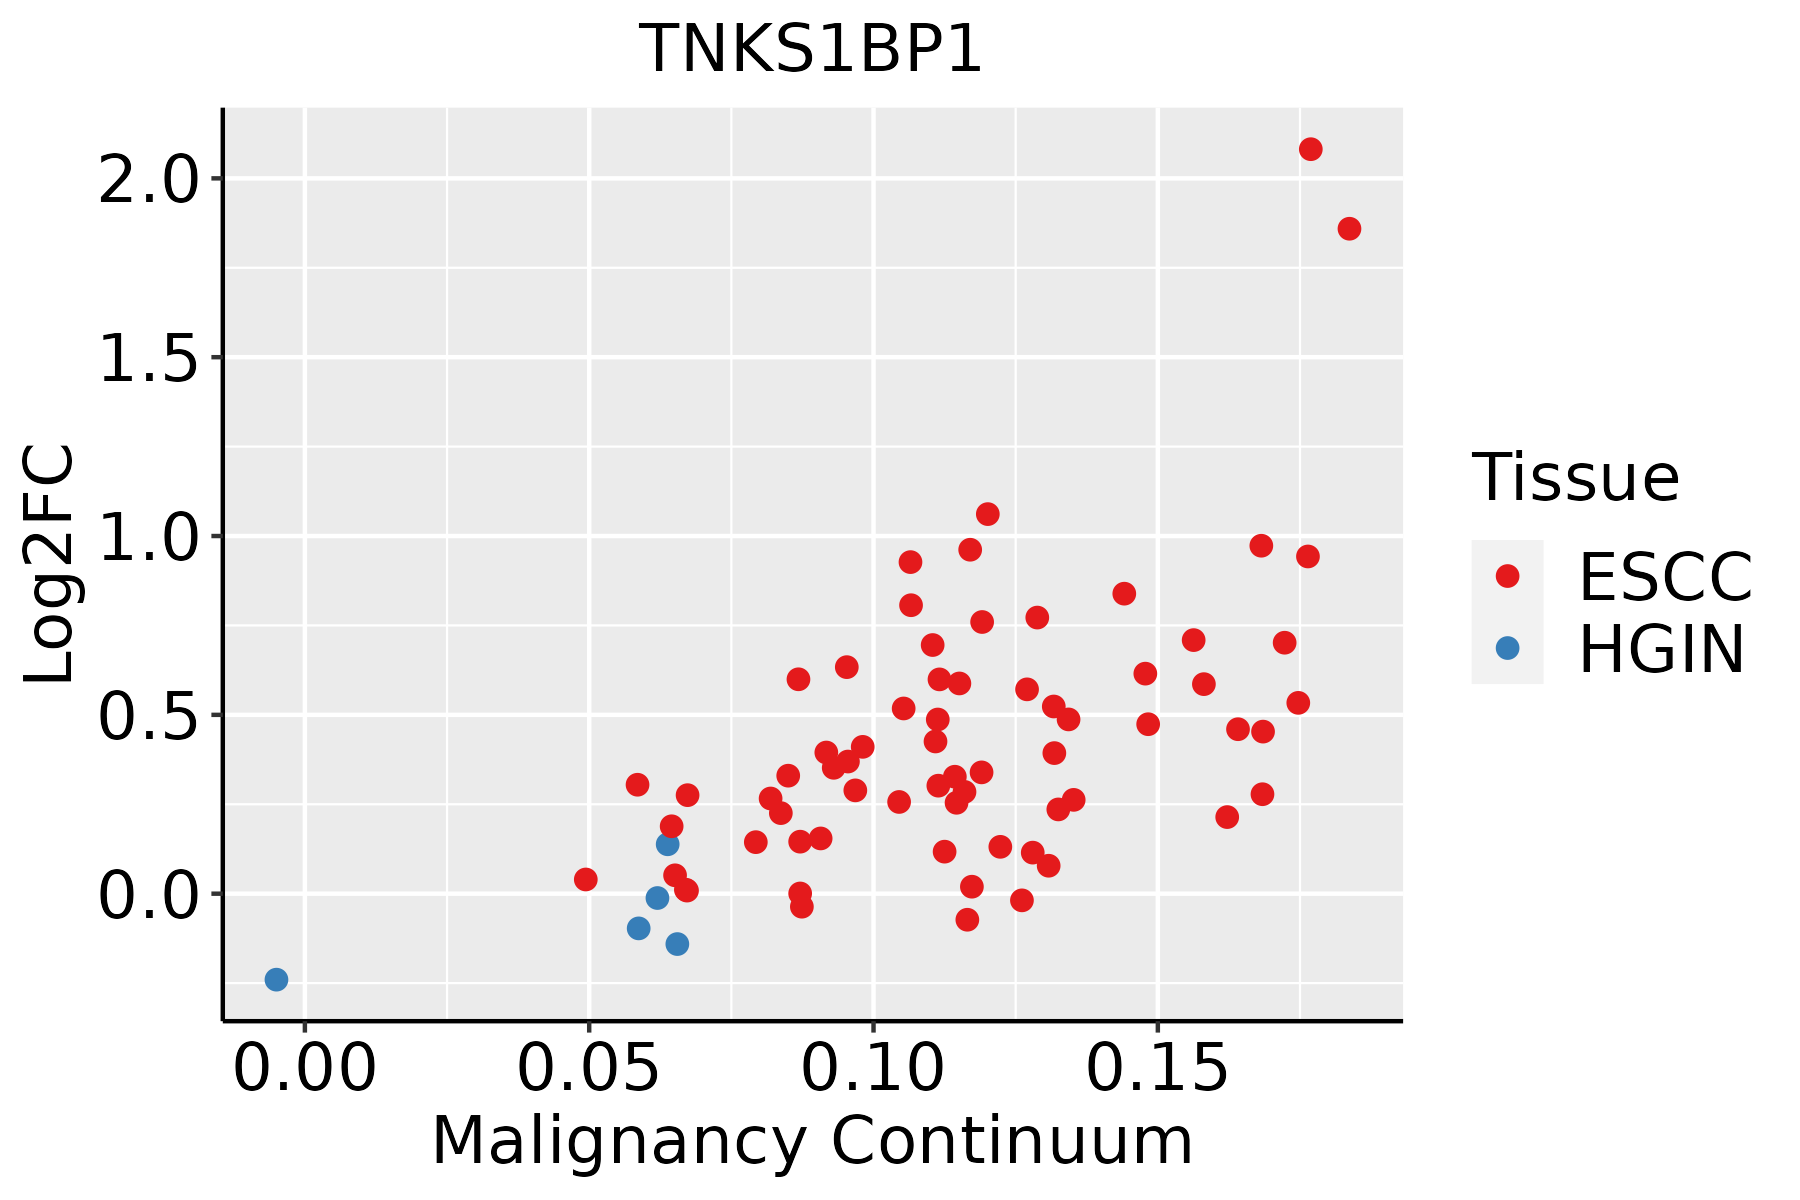
ESCC: Esophageal squamous cell carcinoma
HGIN: High-grade intraepithelial neoplasias
LGIN: Low-grade intraepithelial neoplasias
LiverThe image shows the transcriptomic changes along malignancy continuum.log2FC in expression of this searched gene in stem-like cells from each diseased tissue sample relative to stem-like cells in normal samples in each tissue plotted against the malignancy continuum. Samples are colored based on if they are from different disease stage.
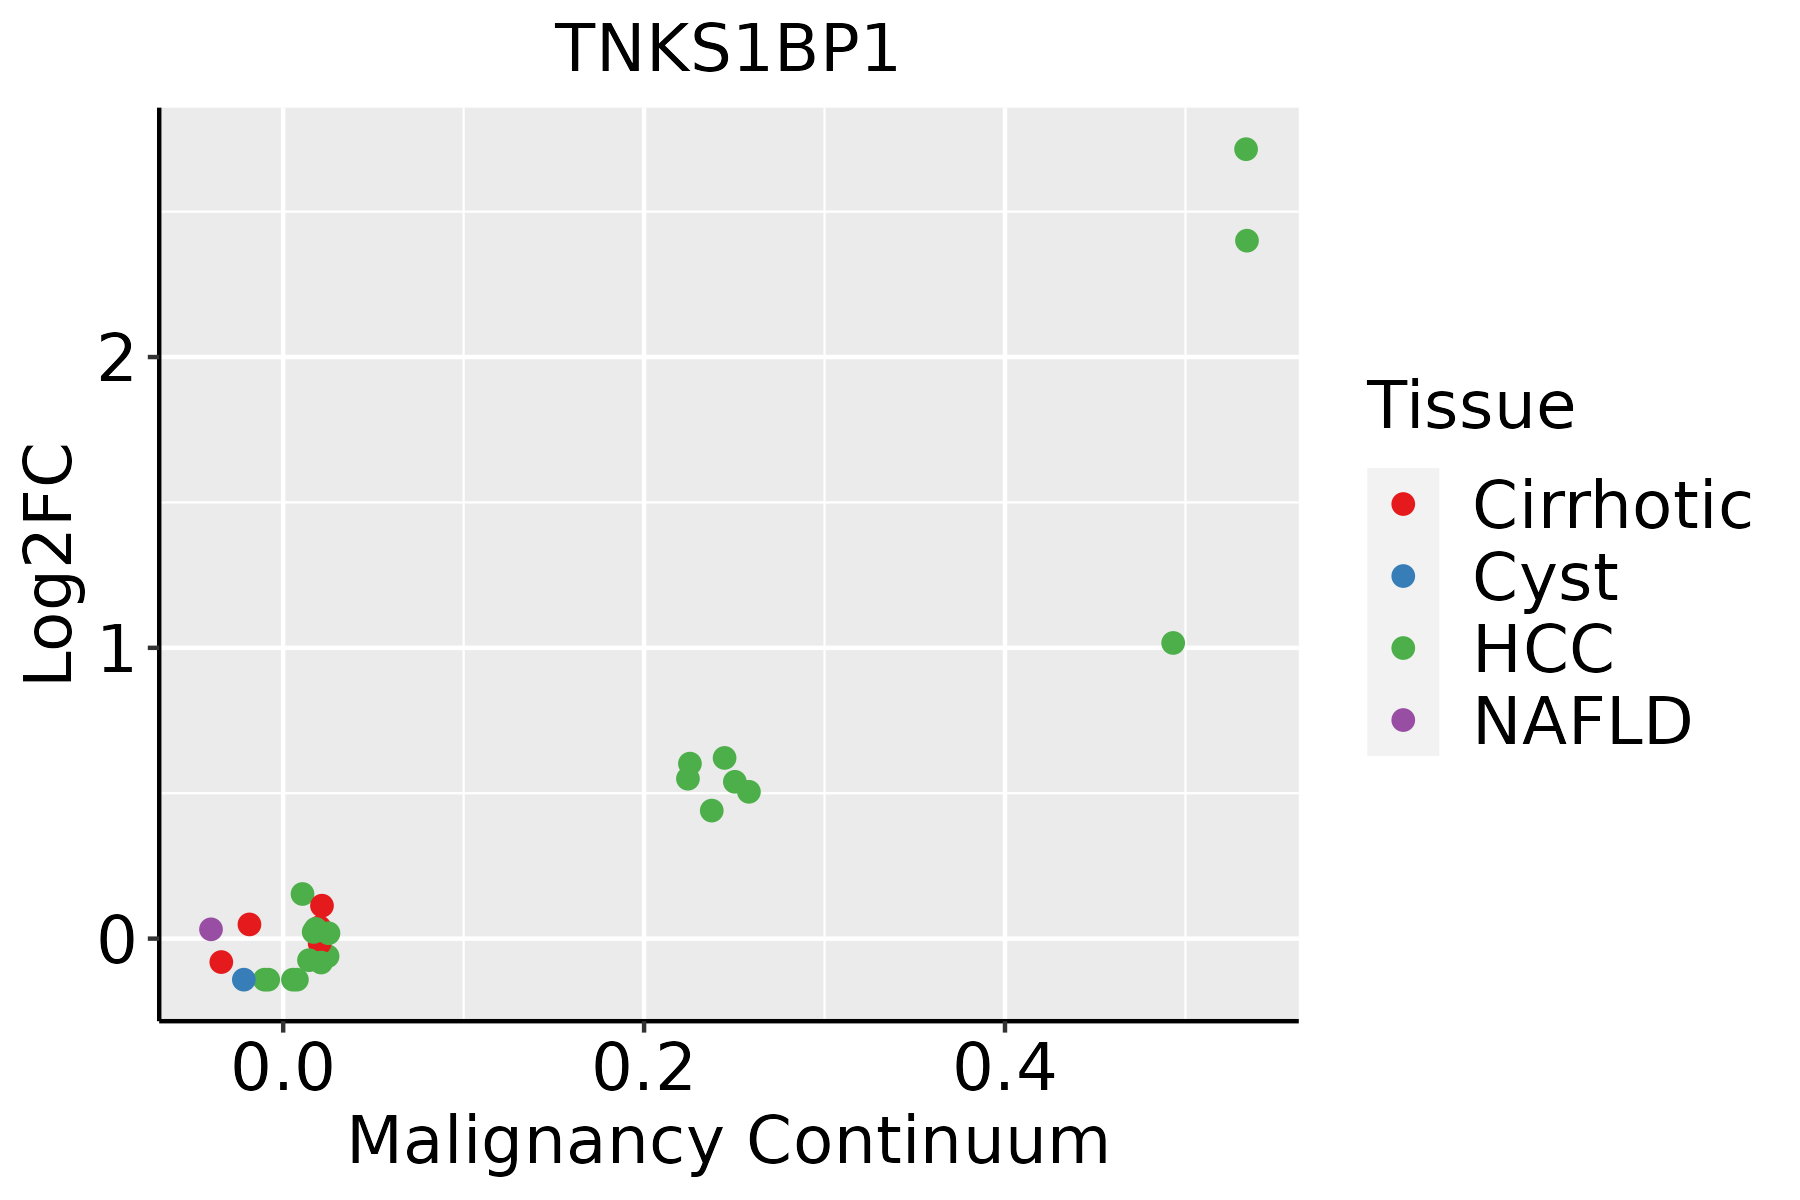
HCC: Hepatocellular carcinoma
NAFLD: Non-alcoholic fatty liver disease
Oral CavityThe image shows the transcriptomic changes along malignancy continuum.log2FC in expression of this searched gene in stem-like cells from each diseased tissue sample relative to stem-like cells in normal samples in each tissue plotted against the malignancy continuum. Samples are colored based on if they are from different disease stage.
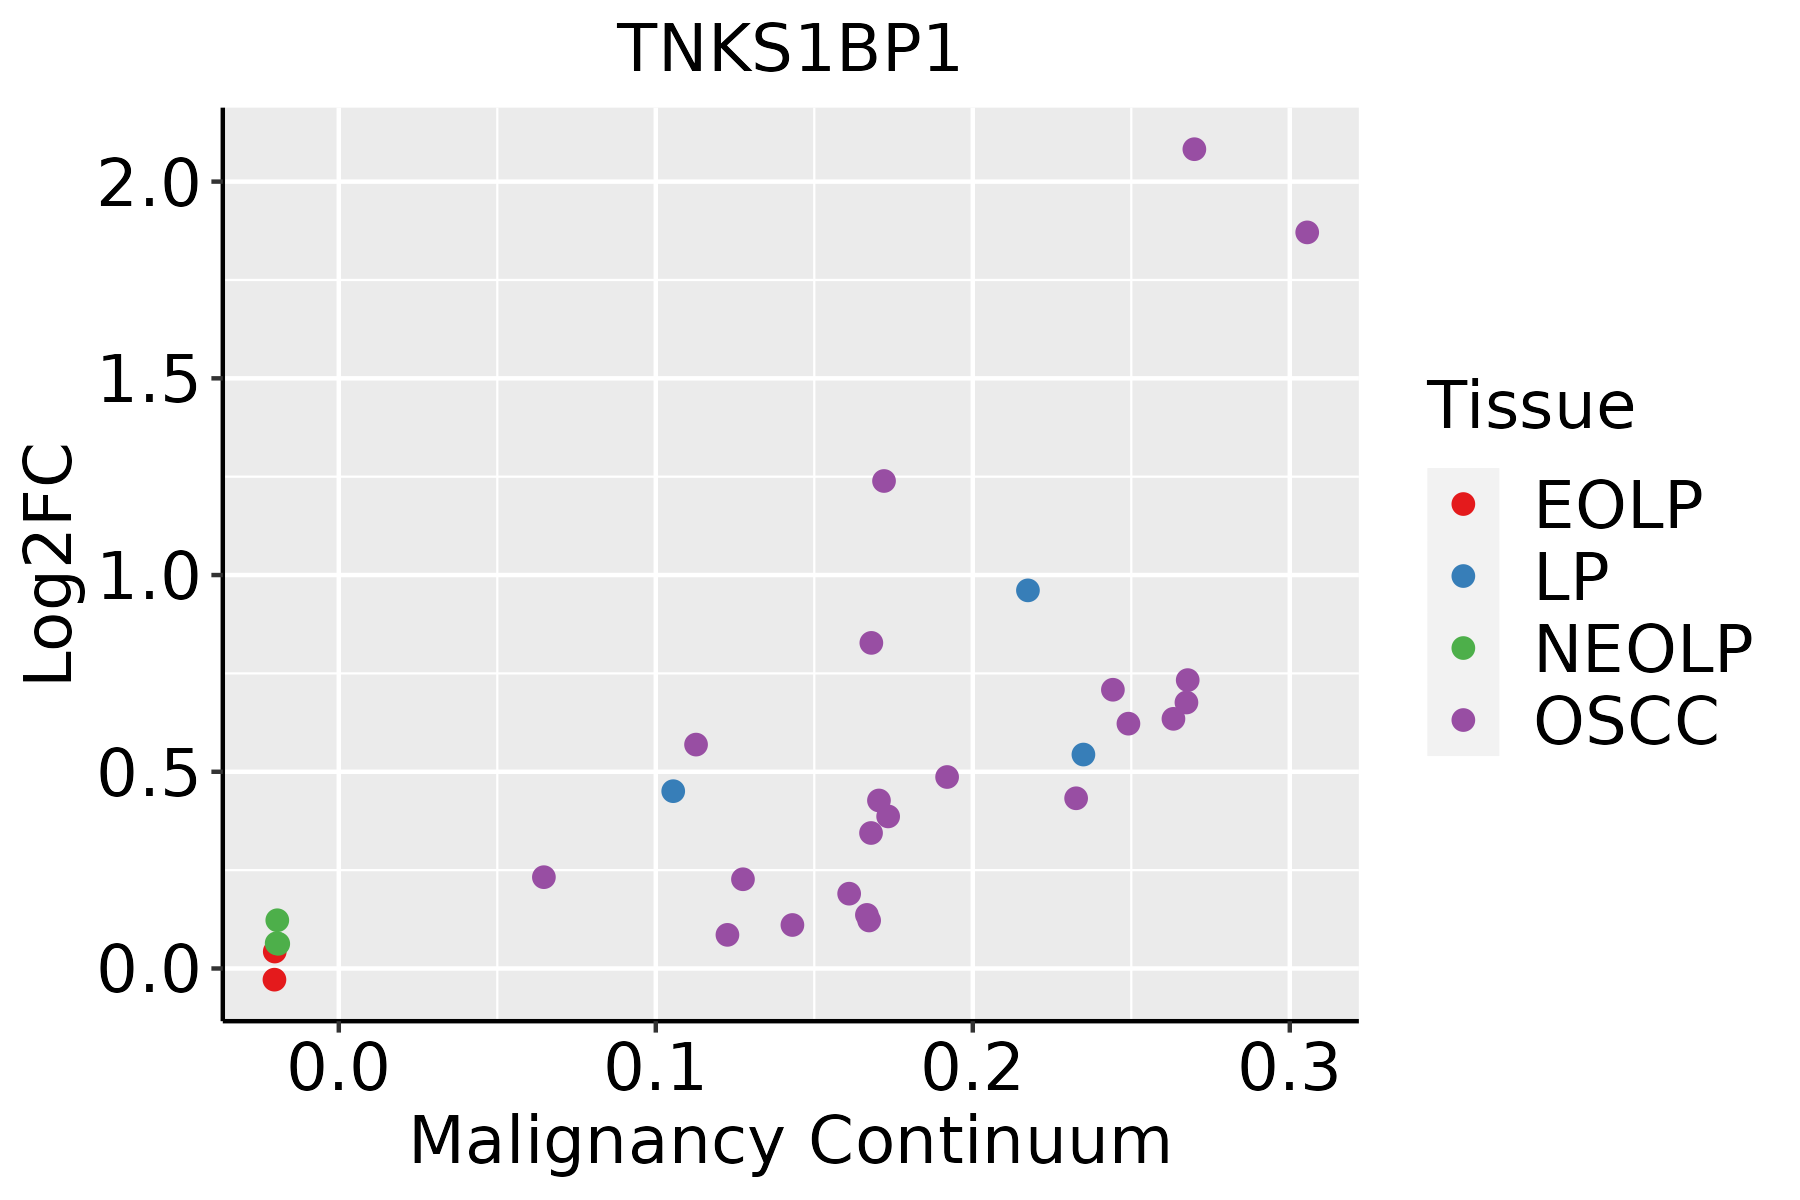
EOLP: Erosive Oral lichen planus
LP: leukoplakia
NEOLP: Non-erosive oral lichen planus
OSCC: Oral squamous cell carcinoma
ProstateThe image shows the transcriptomic changes along malignancy continuum.log2FC in expression of this searched gene in stem-like cells from each diseased tissue sample relative to stem-like cells in normal samples in each tissue plotted against the malignancy continuum. Samples are colored based on if they are from different disease stage.
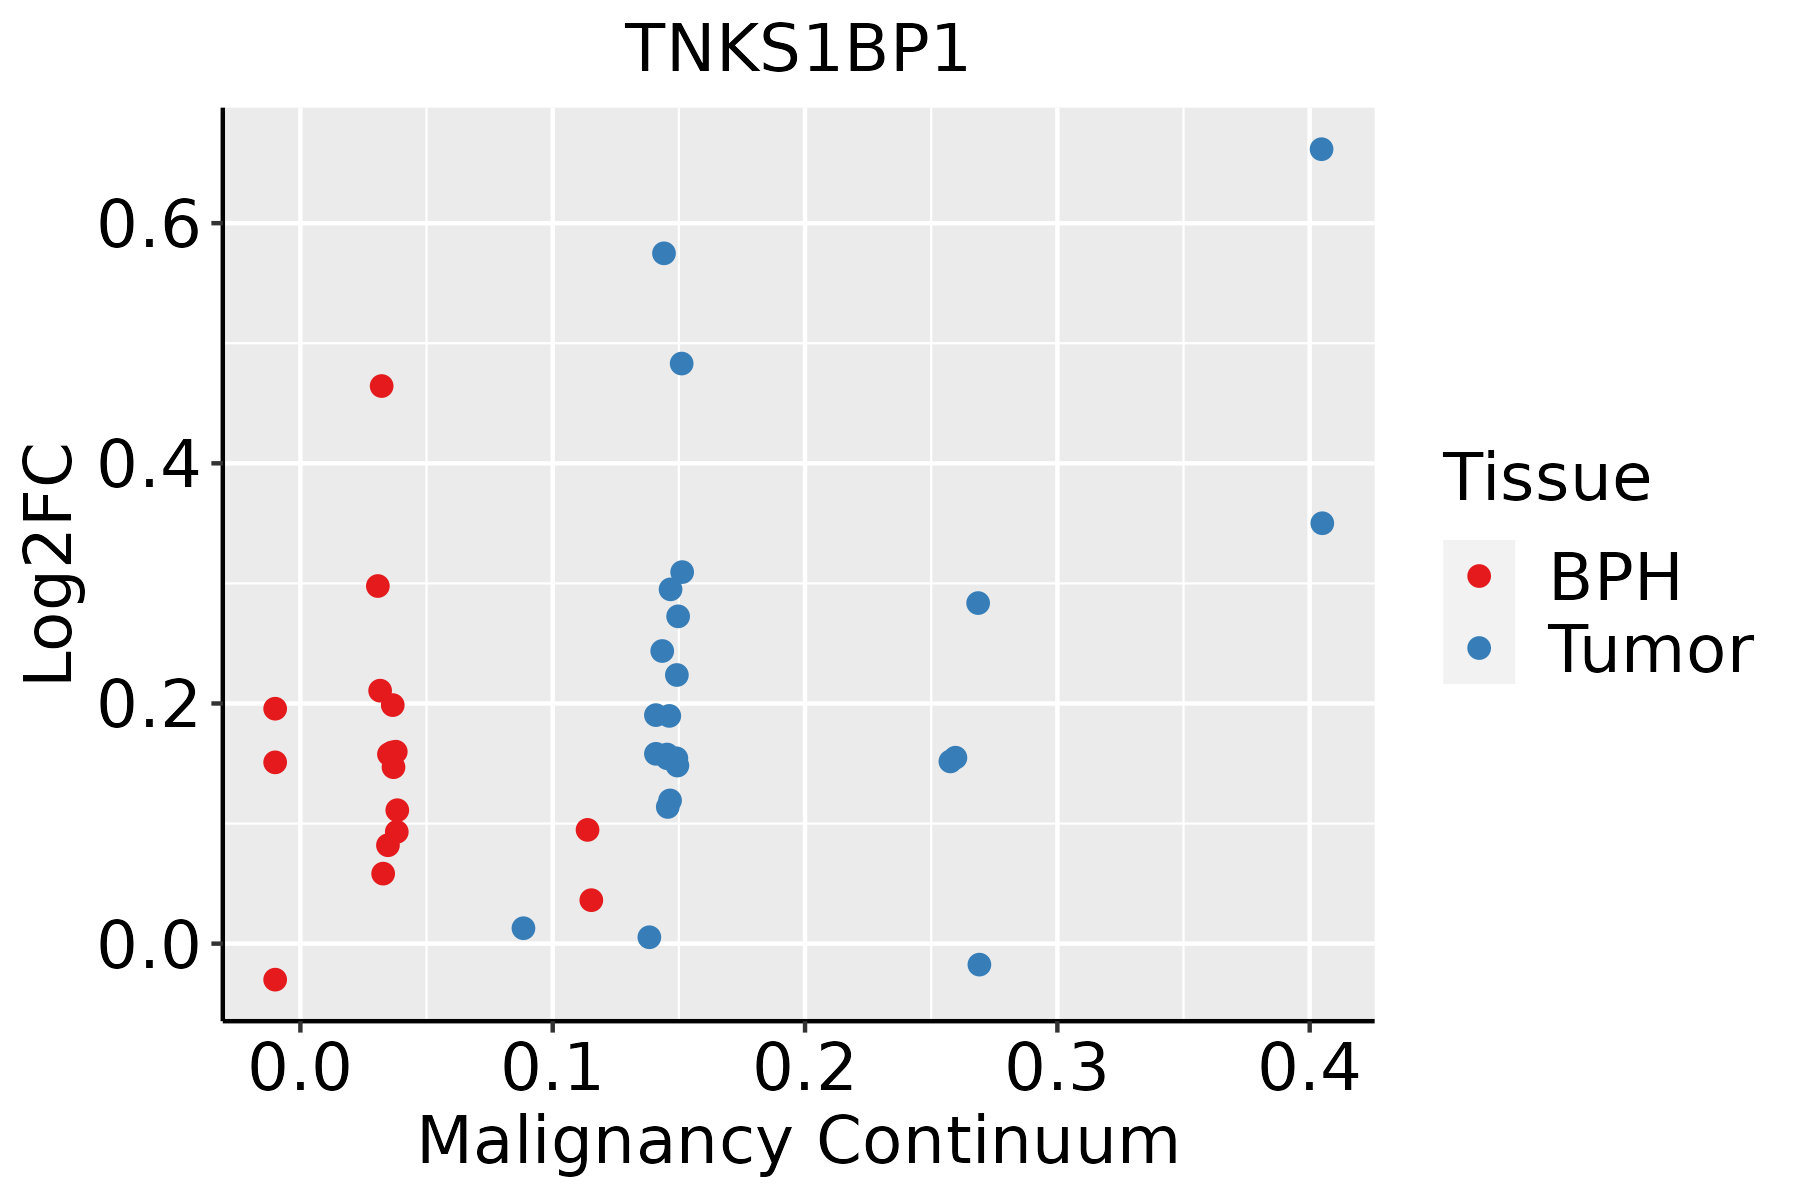
BPH: Benign Prostatic Hyperplasia
SkinThe image shows the transcriptomic changes along malignancy continuum.log2FC in expression of this searched gene in stem-like cells from each diseased tissue sample relative to stem-like cells in normal samples in each tissue plotted against the malignancy continuum. Samples are colored based on if they are from different disease stage.AK: Actinic keratosis
cSCC: Cutaneous squamous cell carcinoma
SCCIS:squamous cell carcinoma in situ
ThyroidThe image shows the transcriptomic changes along malignancy continuum.log2FC in expression of this searched gene in stem-like cells from each diseased tissue sample relative to stem-like cells in normal samples in each tissue plotted against the malignancy continuum. Samples are colored based on if they are from different disease stage.ATC: Anaplastic thyroid cancer
HT: Hashimoto's thyroiditis
PTC: Papillary thyroid cancer
∗log2FC in expression of this searched gene in stem-like cells from each diseased tissue sample relative to stem-like cells in normal samples in each tissue plotted against the malignancy continuum. Samples are colored based on if they are from different disease stage.

Top

Malignant transformation related pathway analysis

check buttonFind out the enriched GO biological processes and KEGG pathways involved in transition from healthy to precancer to cancer
check button Figure of enriched GO biological processes.
TissueDisease StageEnriched GO biological Processes
ColorectumADGO analysis - Figure of enriched GO biological processes: Top 15 enriched GO BP terms are showed in the bar plot of each disease state in each tissue. Each row represents a significant GO biological process which is colored according to the -log10(p.adjust).
ColorectumSERGO analysis - Figure of enriched GO biological processes: Top 15 enriched GO BP terms are showed in the bar plot of each disease state in each tissue. Each row represents a significant GO biological process which is colored according to the -log10(p.adjust).
ColorectumMSSGO analysis - Figure of enriched GO biological processes: Top 15 enriched GO BP terms are showed in the bar plot of each disease state in each tissue. Each row represents a significant GO biological process which is colored according to the -log10(p.adjust).
ColorectumMSI-HGO analysis - Figure of enriched GO biological processes: Top 15 enriched GO BP terms are showed in the bar plot of each disease state in each tissue. Each row represents a significant GO biological process which is colored according to the -log10(p.adjust).
ColorectumFAPGO analysis - Figure of enriched GO biological processes: Top 15 enriched GO BP terms are showed in the bar plot of each disease state in each tissue. Each row represents a significant GO biological process which is colored according to the -log10(p.adjust).
∗Top 15 enriched GO BP terms are showed in the bar plot of each disease state in each tissue. Each row represents a significant GO biological process which is colored according to the -log10(p.adjust).
Page: 1 2 3 4 5 6 7 8 9 

check button Enriched GO biological processes.
GO IDTissueDisease StageDescriptionGene RatioBg Ratiopvaluep.adjustCount
GO:001021217EsophagusESCCresponse to ionizing radiation110/8552148/187231.11e-124.78e-11110
GO:000072319EsophagusESCCtelomere maintenance99/8552131/187232.68e-121.08e-1099
GO:007189716EsophagusESCCDNA biosynthetic process127/8552180/187231.04e-113.85e-10127
GO:000931419EsophagusESCCresponse to radiation277/8552456/187234.42e-111.43e-09277
GO:007121419EsophagusESCCcellular response to abiotic stimulus206/8552331/187237.52e-101.88e-08206
GO:010400419EsophagusESCCcellular response to environmental stimulus206/8552331/187237.52e-101.88e-08206
GO:000700418EsophagusESCCtelomere maintenance via telomerase56/855269/187231.40e-093.30e-0856
GO:007147816EsophagusESCCcellular response to radiation122/8552186/187233.07e-085.73e-07122
GO:001083319EsophagusESCCtelomere maintenance via telomere lengthening61/855281/187235.24e-089.37e-0761
GO:000627816EsophagusESCCRNA-dependent DNA biosynthetic process56/855275/187233.03e-074.30e-0656
GO:0071479110EsophagusESCCcellular response to ionizing radiation54/855272/187233.85e-075.32e-0654
GO:00063024EsophagusESCCdouble-strand break repair152/8552251/187231.33e-061.62e-05152
GO:004677710EsophagusESCCprotein autophosphorylation138/8552227/187232.98e-063.38e-05138
GO:00182099EsophagusESCCpeptidyl-serine modification196/8552338/187233.07e-063.47e-05196
GO:001810515EsophagusESCCpeptidyl-serine phosphorylation184/8552315/187233.22e-063.61e-05184
GO:003220014EsophagusESCCtelomere organization99/8552159/187231.77e-051.57e-0499
GO:00319521EsophagusESCCregulation of protein autophosphorylation29/855243/187233.25e-031.35e-0229
GO:00331355EsophagusESCCregulation of peptidyl-serine phosphorylation81/8552144/187236.79e-032.48e-0281
GO:00319541EsophagusESCCpositive regulation of protein autophosphorylation19/855227/187238.35e-032.95e-0219
GO:001810710EsophagusESCCpeptidyl-threonine phosphorylation66/8552116/187239.76e-033.37e-0266
Page: 1 2 3 4 5 6 7 8 9 

check button Enriched KEGG pathways.
Pathway IDTissueDisease StageDescriptionGene RatioBg Ratiopvaluep.adjustqvalueCount
Page: 1 

Top

Cell-cell communication analysis

check buttonIdentification of potential cell-cell interactions between two cell types and their ligand-receptor pairs for different disease states
LigandReceptorLRpairPathwayTissueDisease Stage
Page: 1 

Top

Single-cell gene regulatory network inference analysis

check buttonFind out the significant the regulons (TFs) and the target genes of each regulon across cell types for different disease states
TFCell TypeTissueDisease StageTarget GeneRSSRegulon Activity
∗The dot plots of a searched regulon are shown for all cell subpopulations in each disease state of each tissue based on the regulon specific score inferred using pySCENIC and by calculating the average expression.
Page: 1 

Top

Somatic mutation of malignant transformation related genes

check buttonAnnotation of somatic variants for genes involved in malignant transformation
Hugo SymbolVariant ClassVariant ClassificationdbSNP RSHGVScHGVSpHGVSp ShortSWISSPROTBIOTYPESIFTPolyPhenTumor Sample BarcodeTissueHistologySexAgeStageTherapy TypesDrugsOutcome
TNKS1BP1SNVMissense_Mutationc.1729N>Tp.Gly577Cysp.G577CQ9C0C2protein_codingdeleterious(0.04)benign(0.035)TCGA-A1-A0SO-01Breastbreast invasive carcinomaFemale>=65I/IIChemotherapySD
TNKS1BP1SNVMissense_Mutationc.1642C>Gp.Pro548Alap.P548AQ9C0C2protein_codingtolerated(0.1)benign(0.04)TCGA-A2-A1FW-01Breastbreast invasive carcinomaFemale<65III/IVChemotherapycytoxanSD
TNKS1BP1SNVMissense_Mutationnovelc.2095N>Cp.Ala699Prop.A699PQ9C0C2protein_codingdeleterious(0.03)possibly_damaging(0.469)TCGA-A2-A3Y0-01Breastbreast invasive carcinomaFemale<65I/IIChemotherapyadriamycinCR
TNKS1BP1SNVMissense_Mutationrs763983688c.196N>Tp.Arg66Trpp.R66WQ9C0C2protein_codingdeleterious(0)probably_damaging(0.997)TCGA-A8-A095-01Breastbreast invasive carcinomaFemale<65I/IIChemotherapy5-fluorouracilCR
TNKS1BP1SNVMissense_Mutationc.88G>Ap.Glu30Lysp.E30KQ9C0C2protein_codingdeleterious(0)probably_damaging(0.994)TCGA-AC-A23H-01Breastbreast invasive carcinomaFemale>=65I/IIUnknownUnknownPD
TNKS1BP1SNVMissense_Mutationnovelc.540N>Ap.Asp180Glup.D180EQ9C0C2protein_codingdeleterious(0.04)benign(0.323)TCGA-AR-A0TX-01Breastbreast invasive carcinomaFemale<65I/IIUnknownUnknownSD
TNKS1BP1SNVMissense_Mutationnovelc.41C>Tp.Ser14Phep.S14FQ9C0C2protein_codingdeleterious(0)probably_damaging(0.973)TCGA-BH-A1EO-01Breastbreast invasive carcinomaFemale>=65I/IIUnknownUnknownSD
TNKS1BP1SNVMissense_Mutationrs774760397c.4129N>Ap.Gly1377Serp.G1377SQ9C0C2protein_codingtolerated(0.1)benign(0.338)TCGA-E9-A249-01Breastbreast invasive carcinomaFemale<65I/IIChemotherapycyclophosphamideSD
TNKS1BP1insertionFrame_Shift_Insnovelc.5034_5035insAAAGTTTGCATTCTGGACCTTTGCCGTCTGCCTCCTAGGTp.Gln1679LysfsTer69p.Q1679Kfs*69Q9C0C2protein_codingTCGA-A7-A0D9-01Breastbreast invasive carcinomaFemale<65I/IIChemotherapytaxotereSD
TNKS1BP1insertionFrame_Shift_Insnovelc.5149_5150insGGCACTCACCACCACACCTGGCTAATTTTTGTATTTTTAATp.Asn1717ArgfsTer20p.N1717Rfs*20Q9C0C2protein_codingTCGA-A8-A07G-01Breastbreast invasive carcinomaFemale>=65I/IIChemotherapy5-fluorouracilCR
Page: 1 2 3 4 5 6 7 8 9 10 11 12 13 14 15 16 

Top

Related drugs of malignant transformation related genes

check buttonIdentification of chemicals and drugs interact with genes involved in malignant transfromation
(DGIdb 4.0)
Entrez IDSymbolCategoryInteraction TypesDrug Claim NameDrug NamePMIDs
Page: 1