
|
|||||
|
 | |
| |
| |
| |
| |
| |
|
Gene: TNKS |
Gene summary for TNKS |
| Gene information | Species | Human | Gene symbol | TNKS | Gene ID | 8658 |
| Gene name | tankyrase | |
| Gene Alias | ARTD5 | |
| Cytomap | 8p23.1 | |
| Gene Type | protein-coding | GO ID | GO:0000070 | UniProtAcc | O95271 |
Top |
Malignant transformation analysis |
| Identification of the aberrant gene expression in precancerous and cancerous lesions by comparing the gene expression of stem-like cells in diseased tissues with normal stem cells |
| Entrez ID | Symbol | Replicates | Species | Organ | Tissue | Adj P-value | Log2FC | Malignancy |
| 8658 | TNKS | CCI_1 | Human | Cervix | CC | 5.95e-03 | 5.62e-01 | 0.528 |
| 8658 | TNKS | CCI_2 | Human | Cervix | CC | 4.10e-05 | 7.83e-01 | 0.5249 |
| 8658 | TNKS | CCI_3 | Human | Cervix | CC | 1.02e-04 | 6.39e-01 | 0.516 |
| 8658 | TNKS | HTA11_3410_2000001011 | Human | Colorectum | AD | 2.16e-16 | -5.20e-01 | 0.0155 |
| 8658 | TNKS | HTA11_2487_2000001011 | Human | Colorectum | SER | 4.94e-02 | -3.20e-01 | -0.1808 |
| 8658 | TNKS | HTA11_3361_2000001011 | Human | Colorectum | AD | 1.67e-04 | -4.90e-01 | -0.1207 |
| 8658 | TNKS | HTA11_83_2000001011 | Human | Colorectum | SER | 3.17e-02 | -3.41e-01 | -0.1526 |
| 8658 | TNKS | HTA11_696_2000001011 | Human | Colorectum | AD | 8.30e-15 | -3.86e-01 | -0.1464 |
| 8658 | TNKS | HTA11_866_2000001011 | Human | Colorectum | AD | 1.00e-06 | -3.35e-01 | -0.1001 |
| 8658 | TNKS | HTA11_5212_2000001011 | Human | Colorectum | AD | 1.85e-04 | -6.03e-01 | -0.2061 |
| 8658 | TNKS | HTA11_866_3004761011 | Human | Colorectum | AD | 1.65e-05 | -4.15e-01 | 0.096 |
| 8658 | TNKS | HTA11_8622_2000001021 | Human | Colorectum | SER | 1.21e-02 | -5.33e-01 | 0.0528 |
| 8658 | TNKS | HTA11_10711_2000001011 | Human | Colorectum | AD | 6.31e-03 | -3.25e-01 | 0.0338 |
| 8658 | TNKS | HTA11_7696_3000711011 | Human | Colorectum | AD | 1.20e-09 | -3.93e-01 | 0.0674 |
| 8658 | TNKS | HTA11_99999965104_69814 | Human | Colorectum | MSS | 2.16e-08 | -5.10e-01 | 0.281 |
| 8658 | TNKS | HTA11_99999971662_82457 | Human | Colorectum | MSS | 3.75e-12 | -4.38e-01 | 0.3859 |
| 8658 | TNKS | HTA11_99999974143_84620 | Human | Colorectum | MSS | 5.19e-06 | -3.35e-01 | 0.3005 |
| 8658 | TNKS | A001-C-207 | Human | Colorectum | FAP | 3.88e-02 | -1.47e-01 | 0.1278 |
| 8658 | TNKS | A015-C-203 | Human | Colorectum | FAP | 2.42e-29 | -2.36e-01 | -0.1294 |
| 8658 | TNKS | A015-C-204 | Human | Colorectum | FAP | 5.36e-05 | -2.31e-01 | -0.0228 |
| Page: 1 2 3 4 5 6 7 8 9 |
| Tissue | Expression Dynamics | Abbreviation |
| Cervix | 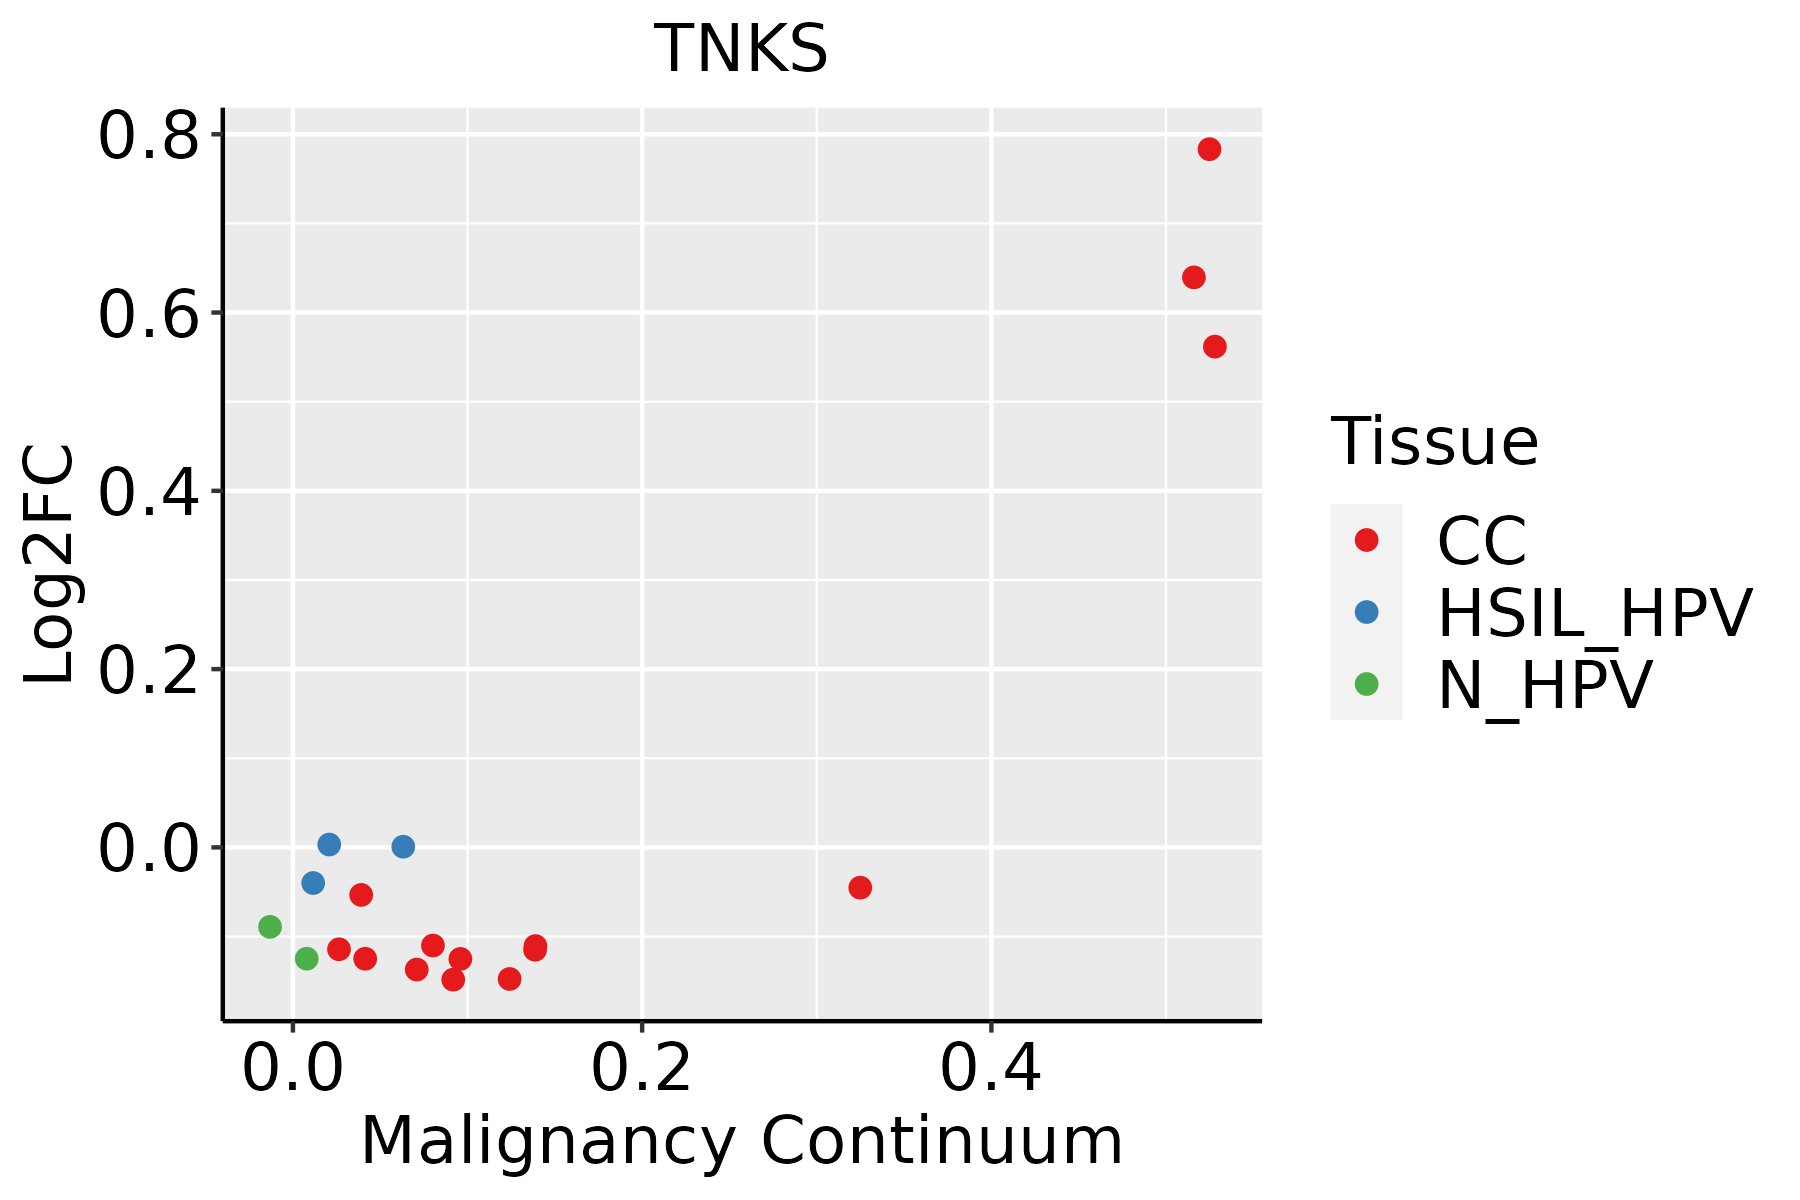 | CC: Cervix cancer |
| HSIL_HPV: HPV-infected high-grade squamous intraepithelial lesions | ||
| N_HPV: HPV-infected normal cervix | ||
| Colorectum (GSE201348) |  | FAP: Familial adenomatous polyposis |
| CRC: Colorectal cancer | ||
| Colorectum (HTA11) |  | AD: Adenomas |
| SER: Sessile serrated lesions | ||
| MSI-H: Microsatellite-high colorectal cancer | ||
| MSS: Microsatellite stable colorectal cancer | ||
| Endometrium | 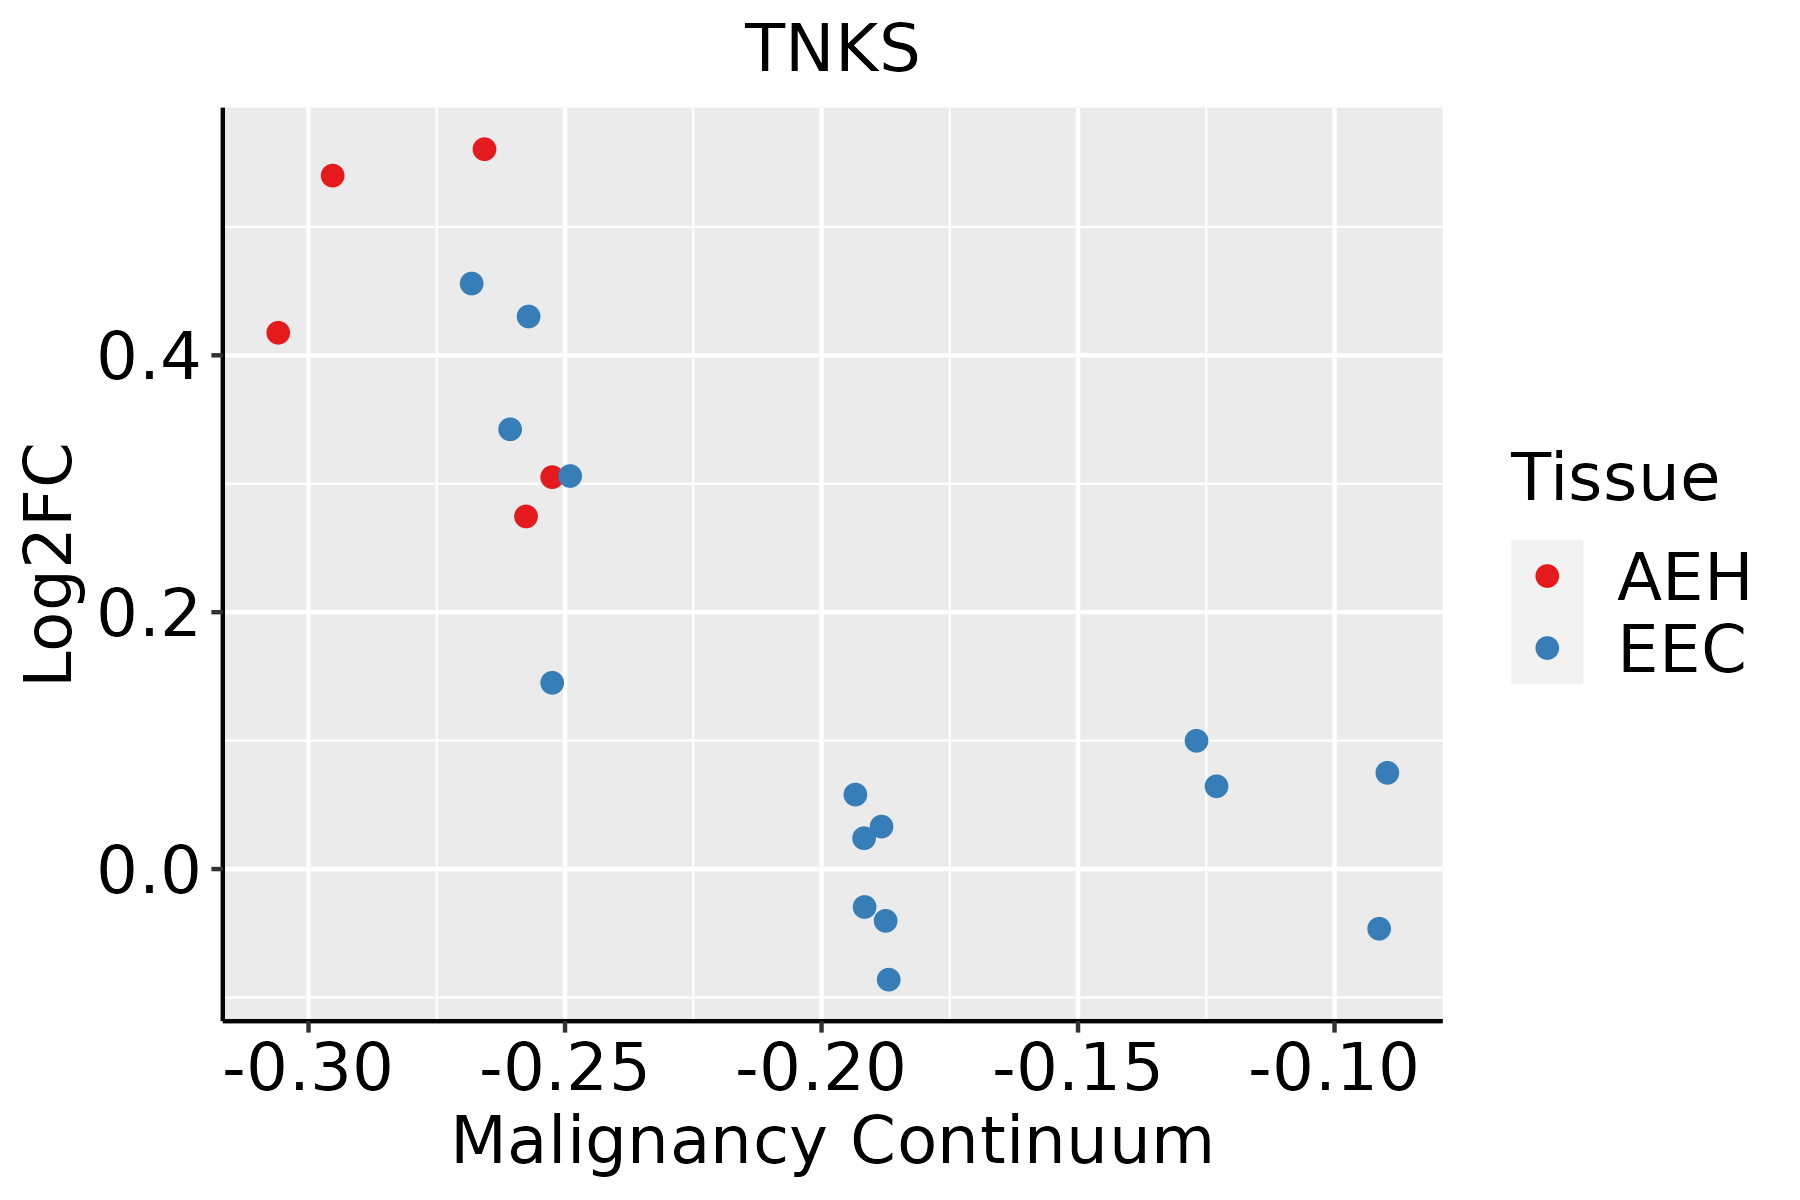 | AEH: Atypical endometrial hyperplasia |
| EEC: Endometrioid Cancer | ||
| Esophagus | 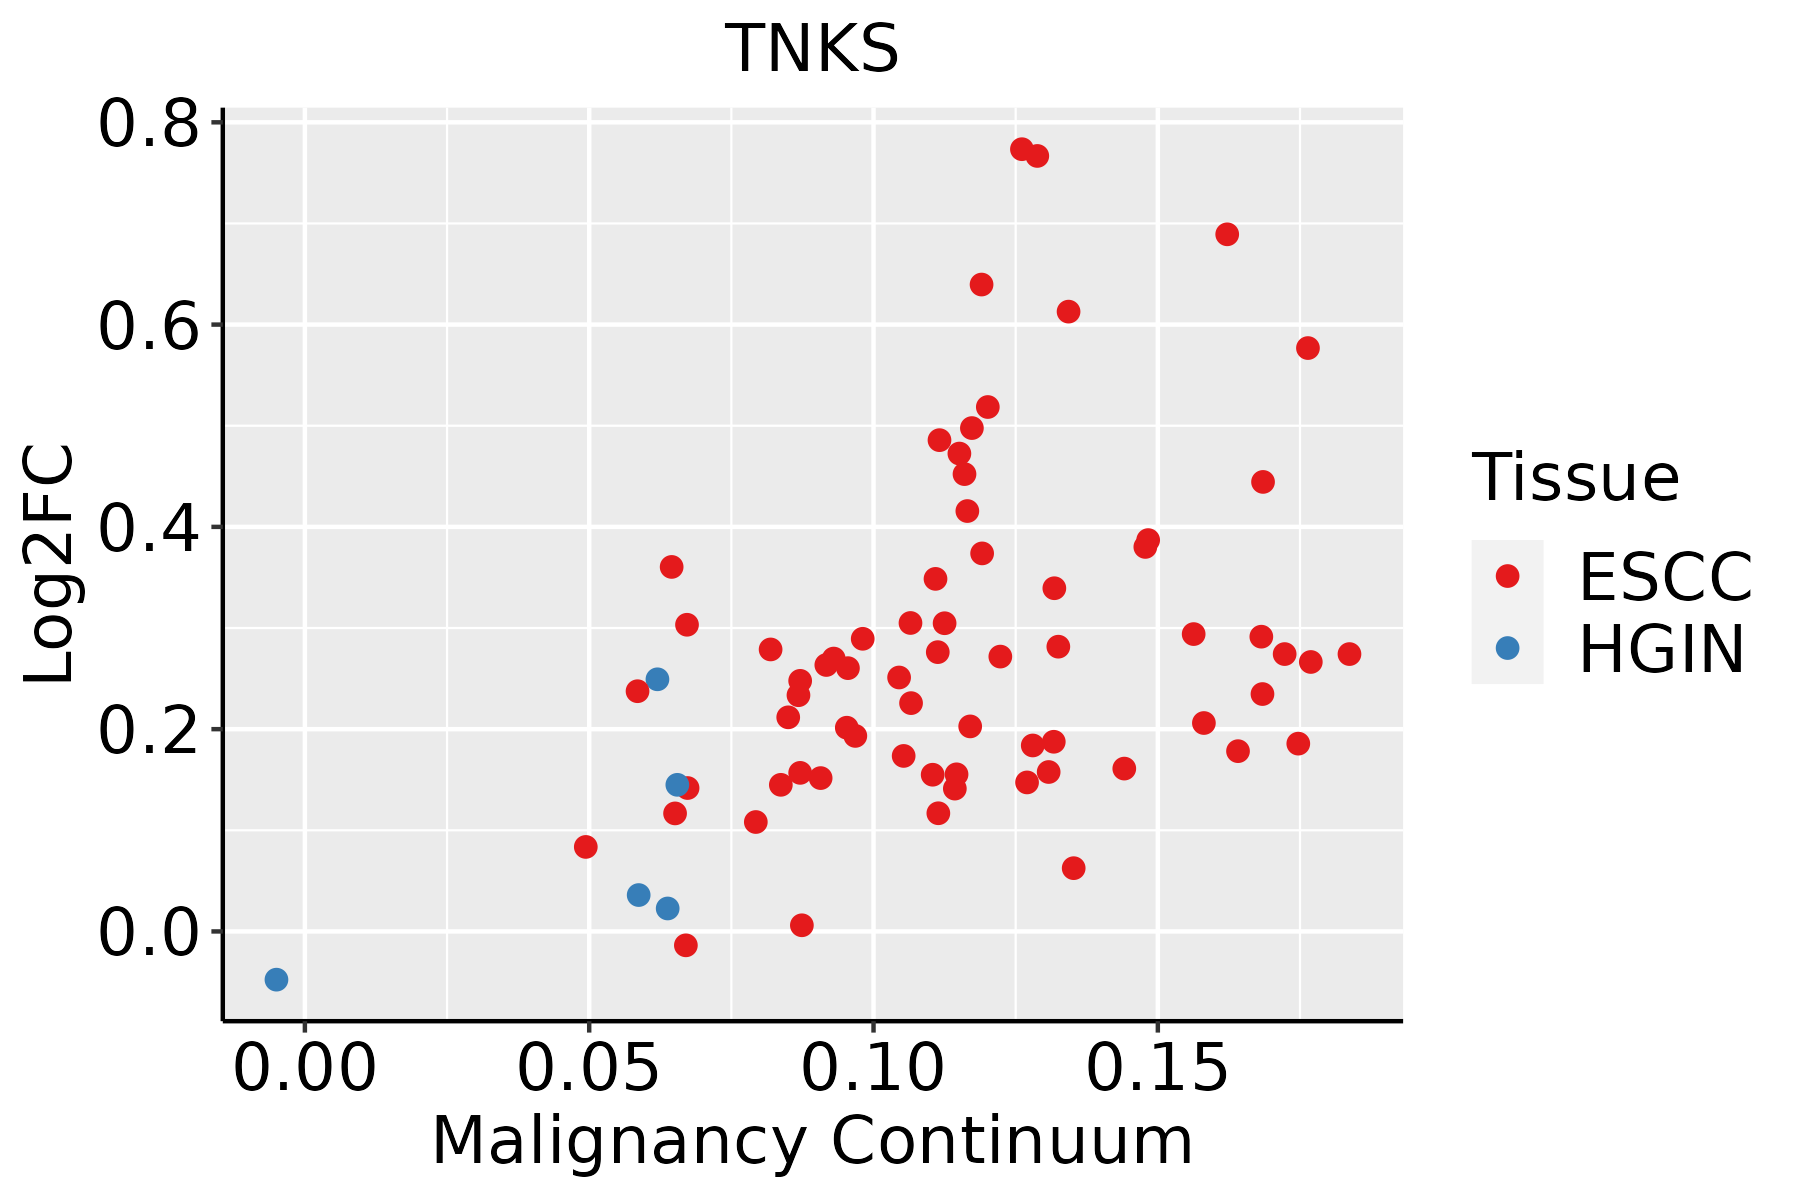 | ESCC: Esophageal squamous cell carcinoma |
| HGIN: High-grade intraepithelial neoplasias | ||
| LGIN: Low-grade intraepithelial neoplasias | ||
| Liver | 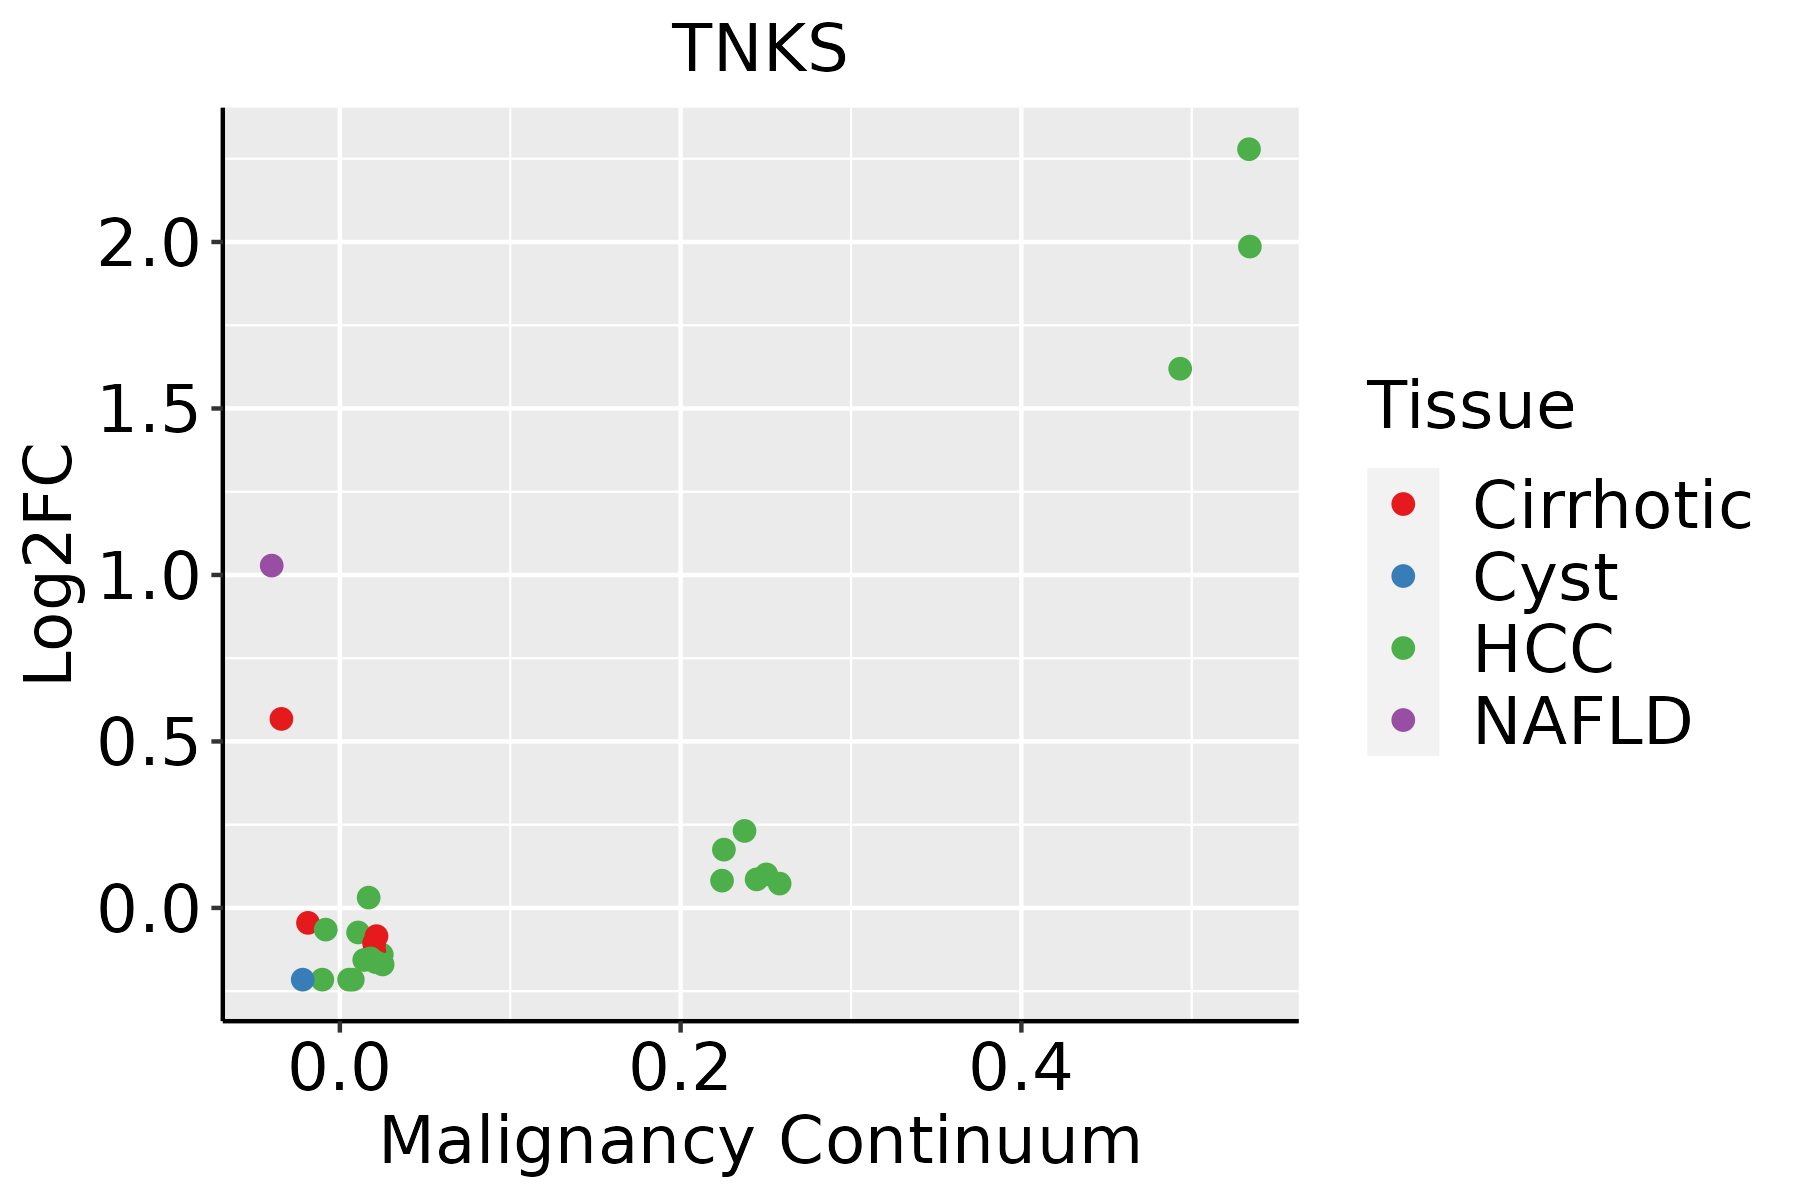 | HCC: Hepatocellular carcinoma |
| NAFLD: Non-alcoholic fatty liver disease | ||
| Lung | 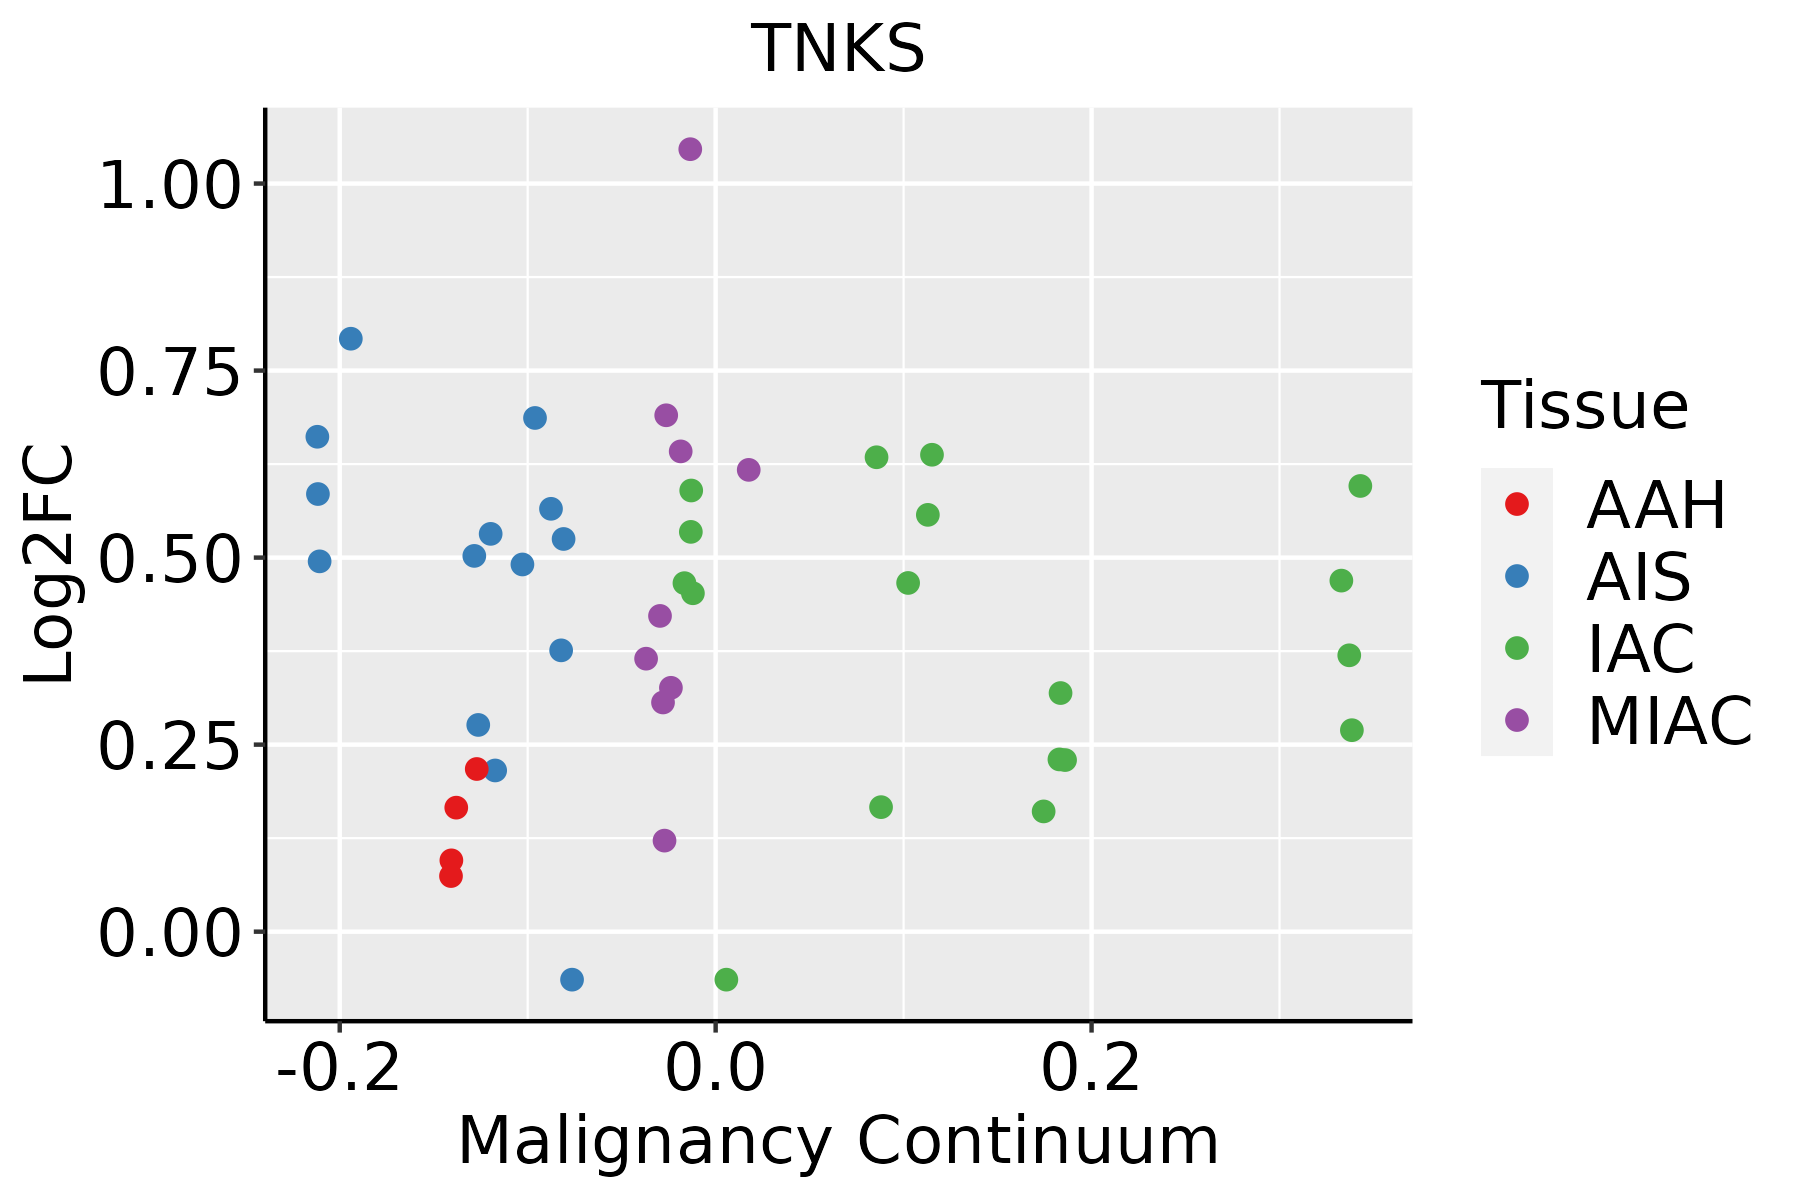 | AAH: Atypical adenomatous hyperplasia |
| AIS: Adenocarcinoma in situ | ||
| IAC: Invasive lung adenocarcinoma | ||
| MIA: Minimally invasive adenocarcinoma | ||
| Prostate | 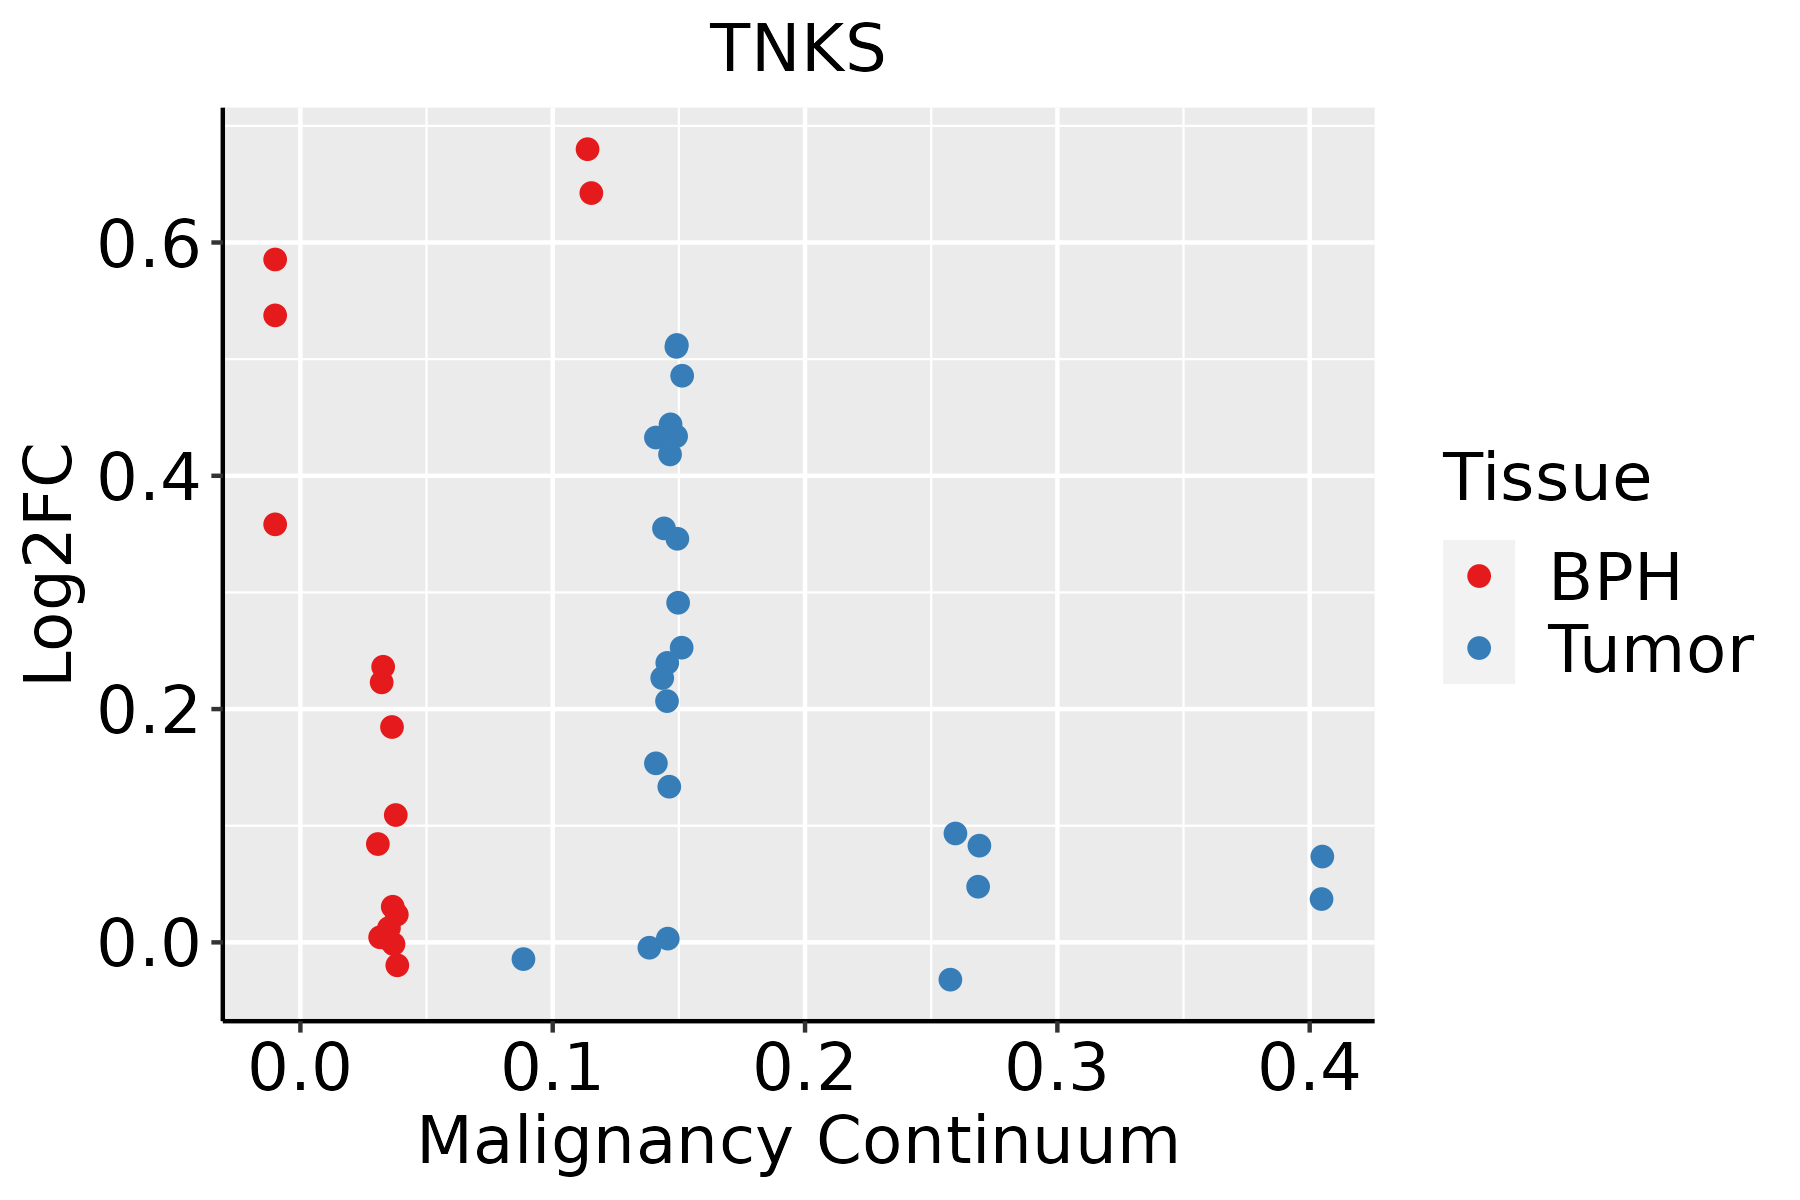 | BPH: Benign Prostatic Hyperplasia |
| Thyroid | 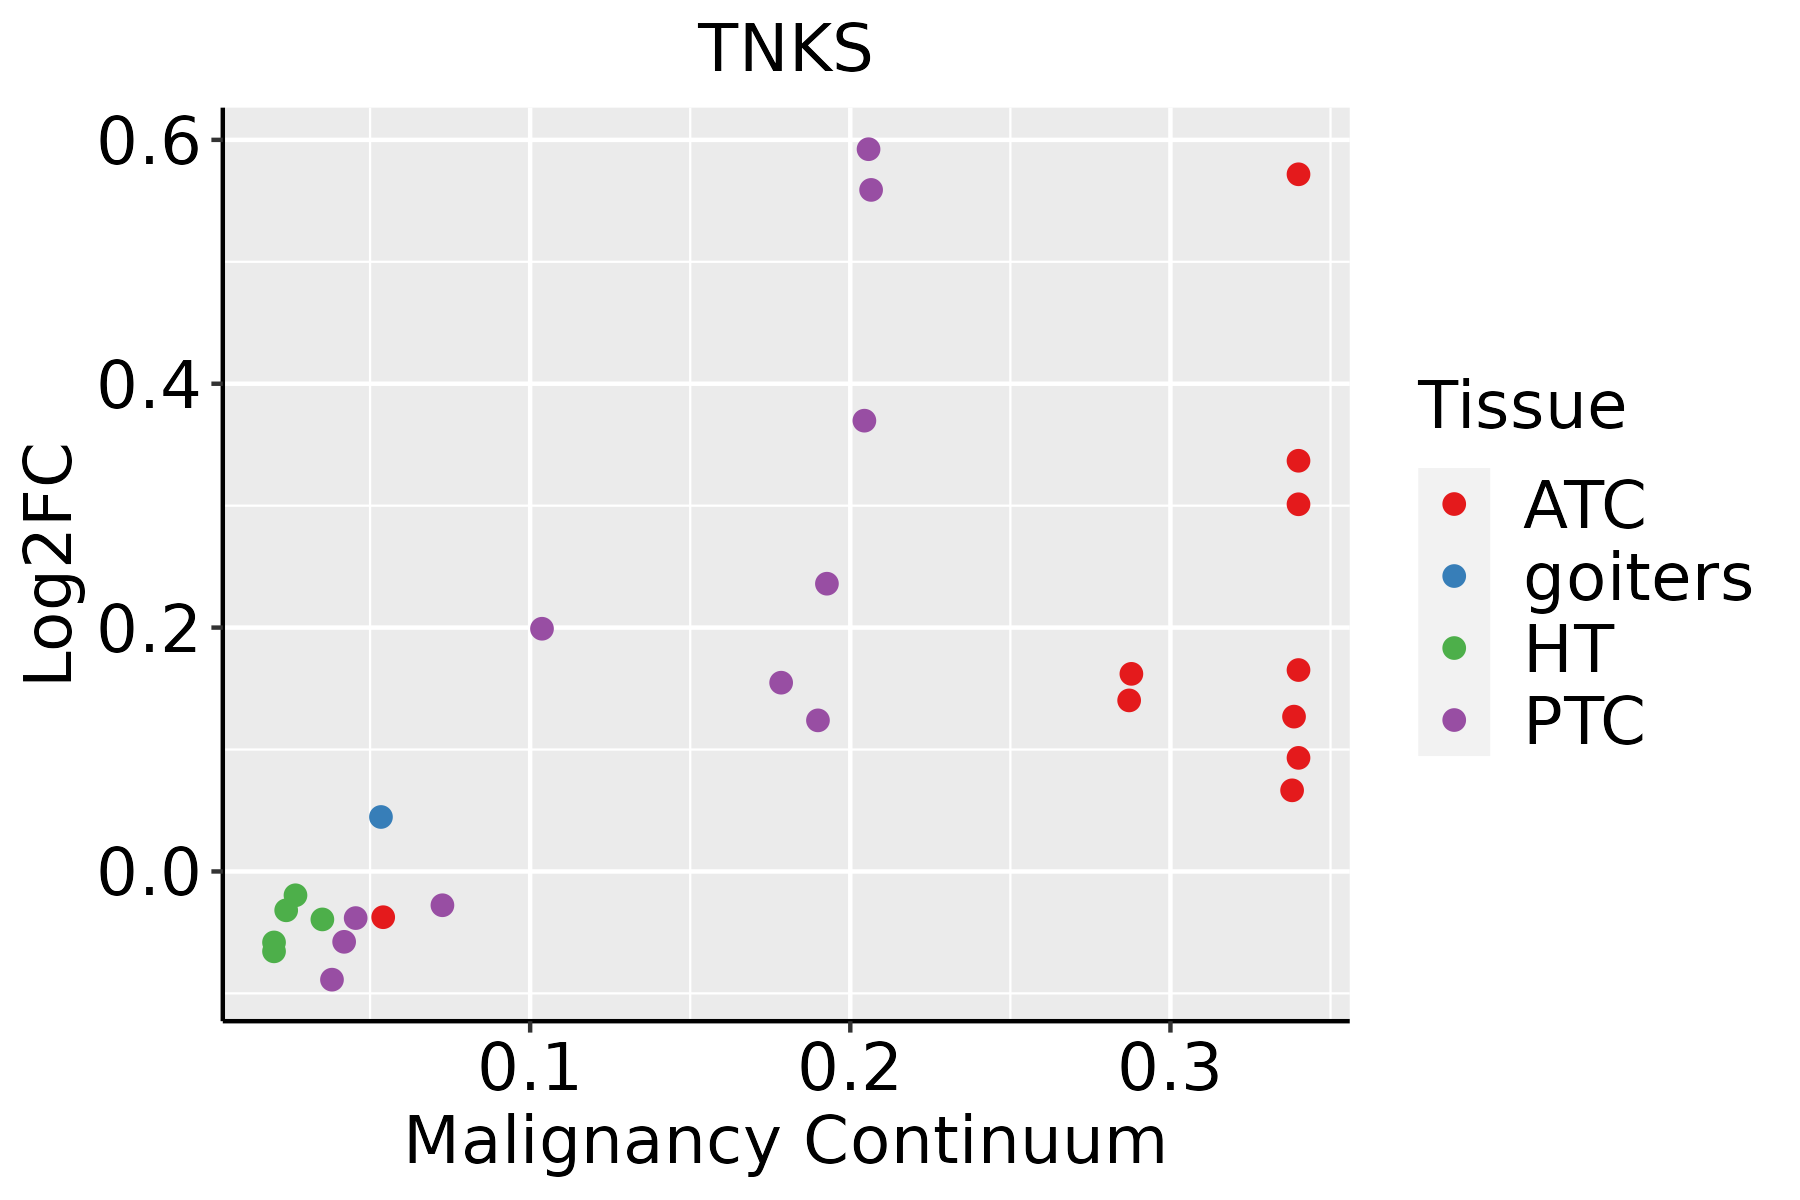 | ATC: Anaplastic thyroid cancer |
| HT: Hashimoto's thyroiditis | ||
| PTC: Papillary thyroid cancer |
| ∗log2FC in expression of this searched gene in stem-like cells from each diseased tissue sample relative to stem-like cells in normal samples in each tissue plotted against the malignancy continuum. Samples are colored based on if they are from different disease stage. |
Top |
Malignant transformation related pathway analysis |
| Find out the enriched GO biological processes and KEGG pathways involved in transition from healthy to precancer to cancer |
| Tissue | Disease Stage | Enriched GO biological Processes |
| Colorectum | AD |  |
| Colorectum | SER |  |
| Colorectum | MSS |  |
| Colorectum | MSI-H |  |
| Colorectum | FAP |  |
| ∗Top 15 enriched GO BP terms are showed in the bar plot of each disease state in each tissue. Each row represents a significant GO biological process which is colored according to the -log10(p.adjust). |
| Page: 1 2 3 4 5 6 7 8 9 |
| GO ID | Tissue | Disease Stage | Description | Gene Ratio | Bg Ratio | pvalue | p.adjust | Count |
| GO:007149610 | Cervix | CC | cellular response to external stimulus | 78/2311 | 320/18723 | 1.82e-09 | 1.98e-07 | 78 |
| GO:00160557 | Cervix | CC | Wnt signaling pathway | 98/2311 | 444/18723 | 4.82e-09 | 4.65e-07 | 98 |
| GO:01987387 | Cervix | CC | cell-cell signaling by wnt | 98/2311 | 446/18723 | 6.16e-09 | 5.58e-07 | 98 |
| GO:00301117 | Cervix | CC | regulation of Wnt signaling pathway | 76/2311 | 328/18723 | 3.05e-08 | 2.08e-06 | 76 |
| GO:005109810 | Cervix | CC | regulation of binding | 80/2311 | 363/18723 | 1.32e-07 | 6.42e-06 | 80 |
| GO:00002097 | Cervix | CC | protein polyubiquitination | 58/2311 | 236/18723 | 1.57e-07 | 7.41e-06 | 58 |
| GO:00316689 | Cervix | CC | cellular response to extracellular stimulus | 59/2311 | 246/18723 | 3.03e-07 | 1.24e-05 | 59 |
| GO:00608287 | Cervix | CC | regulation of canonical Wnt signaling pathway | 58/2311 | 253/18723 | 1.83e-06 | 5.89e-05 | 58 |
| GO:00600707 | Cervix | CC | canonical Wnt signaling pathway | 66/2311 | 303/18723 | 2.47e-06 | 7.35e-05 | 66 |
| GO:003166710 | Cervix | CC | response to nutrient levels | 92/2311 | 474/18723 | 5.80e-06 | 1.42e-04 | 92 |
| GO:00316698 | Cervix | CC | cellular response to nutrient levels | 49/2311 | 215/18723 | 1.32e-05 | 2.68e-04 | 49 |
| GO:005110110 | Cervix | CC | regulation of DNA binding | 31/2311 | 118/18723 | 2.91e-05 | 4.81e-04 | 31 |
| GO:00512368 | Cervix | CC | establishment of RNA localization | 39/2311 | 166/18723 | 4.76e-05 | 7.25e-04 | 39 |
| GO:00070646 | Cervix | CC | mitotic sister chromatid cohesion | 12/2311 | 28/18723 | 5.47e-05 | 8.06e-04 | 12 |
| GO:00181057 | Cervix | CC | peptidyl-serine phosphorylation | 63/2311 | 315/18723 | 6.65e-05 | 9.47e-04 | 63 |
| GO:00506578 | Cervix | CC | nucleic acid transport | 38/2311 | 163/18723 | 7.06e-05 | 9.85e-04 | 38 |
| GO:00506588 | Cervix | CC | RNA transport | 38/2311 | 163/18723 | 7.06e-05 | 9.85e-04 | 38 |
| GO:00106399 | Cervix | CC | negative regulation of organelle organization | 68/2311 | 348/18723 | 7.40e-05 | 1.03e-03 | 68 |
| GO:00182096 | Cervix | CC | peptidyl-serine modification | 66/2311 | 338/18723 | 9.58e-05 | 1.25e-03 | 66 |
| GO:00340864 | Cervix | CC | maintenance of sister chromatid cohesion | 7/2311 | 12/18723 | 1.94e-04 | 2.24e-03 | 7 |
| Page: 1 2 3 4 5 6 7 8 9 10 11 12 13 14 15 16 17 18 19 20 21 22 23 24 25 26 27 28 29 30 31 32 33 34 35 36 37 38 39 40 41 42 43 44 45 46 47 48 49 50 51 52 53 54 55 56 |
| Pathway ID | Tissue | Disease Stage | Description | Gene Ratio | Bg Ratio | pvalue | p.adjust | qvalue | Count |
| Page: 1 |
Top |
Cell-cell communication analysis |
| Identification of potential cell-cell interactions between two cell types and their ligand-receptor pairs for different disease states |
| Ligand | Receptor | LRpair | Pathway | Tissue | Disease Stage |
| Page: 1 |
Top |
Single-cell gene regulatory network inference analysis |
| Find out the significant the regulons (TFs) and the target genes of each regulon across cell types for different disease states |
| TF | Cell Type | Tissue | Disease Stage | Target Gene | RSS | Regulon Activity |
| ∗The dot plots of a searched regulon are shown for all cell subpopulations in each disease state of each tissue based on the regulon specific score inferred using pySCENIC and by calculating the average expression. |
| Page: 1 |
Top |
Somatic mutation of malignant transformation related genes |
| Annotation of somatic variants for genes involved in malignant transformation |
| Hugo Symbol | Variant Class | Variant Classification | dbSNP RS | HGVSc | HGVSp | HGVSp Short | SWISSPROT | BIOTYPE | SIFT | PolyPhen | Tumor Sample Barcode | Tissue | Histology | Sex | Age | Stage | Therapy Types | Drugs | Outcome |
| TNKS | SNV | Missense_Mutation | novel | c.401C>T | p.Ser134Phe | p.S134F | O95271 | protein_coding | deleterious_low_confidence(0.01) | benign(0.248) | TCGA-A2-A0CR-01 | Breast | breast invasive carcinoma | Female | <65 | I/II | Chemotherapy | adriamycin | CR |
| TNKS | SNV | Missense_Mutation | rs767692118 | c.3854N>G | p.Asn1285Ser | p.N1285S | O95271 | protein_coding | deleterious(0.02) | benign(0.198) | TCGA-A2-A4S2-01 | Breast | breast invasive carcinoma | Female | <65 | III/IV | Chemotherapy | adriamycin | CR |
| TNKS | SNV | Missense_Mutation | rs762904486 | c.286N>G | p.Ile96Val | p.I96V | O95271 | protein_coding | deleterious_low_confidence(0.04) | benign(0) | TCGA-D8-A145-01 | Breast | breast invasive carcinoma | Female | >=65 | I/II | Hormone Therapy | tamoxiphen | SD |
| TNKS | insertion | Frame_Shift_Ins | novel | c.560_561insTTGTTGTTTTTGTGACAGGGTCTCC | p.Glu188CysfsTer62 | p.E188Cfs*62 | O95271 | protein_coding | TCGA-AN-A0FN-01 | Breast | breast invasive carcinoma | Female | <65 | I/II | Unknown | Unknown | SD | ||
| TNKS | deletion | Frame_Shift_Del | novel | c.3731delT | p.Ile1244AsnfsTer11 | p.I1244Nfs*11 | O95271 | protein_coding | TCGA-EW-A2FV-01 | Breast | breast invasive carcinoma | Female | <65 | III/IV | Chemotherapy | docetaxel | SD | ||
| TNKS | SNV | Missense_Mutation | rs753349258 | c.932N>A | p.Arg311Gln | p.R311Q | O95271 | protein_coding | tolerated(0.08) | benign(0.036) | TCGA-2W-A8YY-01 | Cervix | cervical & endocervical cancer | Female | <65 | I/II | Chemotherapy | cisplatin | CR |
| TNKS | SNV | Missense_Mutation | novel | c.2087N>A | p.Arg696His | p.R696H | O95271 | protein_coding | tolerated(0.27) | probably_damaging(0.985) | TCGA-2W-A8YY-01 | Cervix | cervical & endocervical cancer | Female | <65 | I/II | Chemotherapy | cisplatin | CR |
| TNKS | SNV | Missense_Mutation | novel | c.3482N>A | p.Arg1161Gln | p.R1161Q | O95271 | protein_coding | deleterious(0) | probably_damaging(0.976) | TCGA-2W-A8YY-01 | Cervix | cervical & endocervical cancer | Female | <65 | I/II | Chemotherapy | cisplatin | CR |
| TNKS | SNV | Missense_Mutation | c.1240N>T | p.His414Tyr | p.H414Y | O95271 | protein_coding | deleterious(0.01) | probably_damaging(0.997) | TCGA-C5-A1BF-01 | Cervix | cervical & endocervical cancer | Female | <65 | I/II | Chemotherapy | cisplatin | PD | |
| TNKS | SNV | Missense_Mutation | rs372614885 | c.3978N>C | p.Lys1326Asn | p.K1326N | O95271 | protein_coding | deleterious_low_confidence(0) | probably_damaging(0.966) | TCGA-C5-A7UI-01 | Cervix | cervical & endocervical cancer | Female | <65 | I/II | Unknown | Unknown | SD |
| Page: 1 2 3 4 5 6 7 8 9 10 11 12 13 |
Top |
Related drugs of malignant transformation related genes |
| Identification of chemicals and drugs interact with genes involved in malignant transfromation |
| (DGIdb 4.0) |
| Entrez ID | Symbol | Category | Interaction Types | Drug Claim Name | Drug Name | PMIDs |
| 8658 | TNKS | DRUGGABLE GENOME, ENZYME | PMID27841036-Compound-37 | |||
| 8658 | TNKS | DRUGGABLE GENOME, ENZYME | 2X-121 | 2X-121 | ||
| 8658 | TNKS | DRUGGABLE GENOME, ENZYME | inhibitor | 404859121 | ||
| 8658 | TNKS | DRUGGABLE GENOME, ENZYME | inhibitor | 404859123 | ||
| 8658 | TNKS | DRUGGABLE GENOME, ENZYME | inhibitor | 404859120 | ||
| 8658 | TNKS | DRUGGABLE GENOME, ENZYME | inhibitor | 404859118 | ||
| 8658 | TNKS | DRUGGABLE GENOME, ENZYME | inhibitor | 404859119 | ||
| 8658 | TNKS | DRUGGABLE GENOME, ENZYME | BGB-290 | PAMIPARIB |
| Page: 1 |

Copyright 2023-Present -The University of Texas Health Science Center at Houston |