
|
|||||
|
 | |
| |
| |
| |
| |
| |
|
Gene: TNK1 |
Gene summary for TNK1 |
| Gene information | Species | Human | Gene symbol | TNK1 | Gene ID | 8711 |
| Gene name | tyrosine kinase non receptor 1 | |
| Gene Alias | KOS1 | |
| Cytomap | 17p13.1 | |
| Gene Type | protein-coding | GO ID | GO:0002376 | UniProtAcc | Q13470 |
Top |
Malignant transformation analysis |
| Identification of the aberrant gene expression in precancerous and cancerous lesions by comparing the gene expression of stem-like cells in diseased tissues with normal stem cells |
| Entrez ID | Symbol | Replicates | Species | Organ | Tissue | Adj P-value | Log2FC | Malignancy |
| 8711 | TNK1 | LZE4T | Human | Esophagus | ESCC | 4.10e-09 | 2.75e-01 | 0.0811 |
| 8711 | TNK1 | LZE8T | Human | Esophagus | ESCC | 1.02e-03 | 1.66e-01 | 0.067 |
| 8711 | TNK1 | LZE20T | Human | Esophagus | ESCC | 8.23e-05 | 1.41e-01 | 0.0662 |
| 8711 | TNK1 | LZE24T | Human | Esophagus | ESCC | 5.08e-25 | 5.80e-01 | 0.0596 |
| 8711 | TNK1 | LZE21T | Human | Esophagus | ESCC | 1.89e-04 | 2.98e-01 | 0.0655 |
| 8711 | TNK1 | P1T-E | Human | Esophagus | ESCC | 4.25e-11 | 4.71e-01 | 0.0875 |
| 8711 | TNK1 | P2T-E | Human | Esophagus | ESCC | 3.51e-12 | 2.20e-01 | 0.1177 |
| 8711 | TNK1 | P4T-E | Human | Esophagus | ESCC | 1.41e-10 | 2.49e-01 | 0.1323 |
| 8711 | TNK1 | P5T-E | Human | Esophagus | ESCC | 4.48e-02 | 1.29e-01 | 0.1327 |
| 8711 | TNK1 | P8T-E | Human | Esophagus | ESCC | 1.08e-11 | 2.09e-01 | 0.0889 |
| 8711 | TNK1 | P9T-E | Human | Esophagus | ESCC | 3.19e-09 | 2.10e-01 | 0.1131 |
| 8711 | TNK1 | P10T-E | Human | Esophagus | ESCC | 1.13e-09 | 1.45e-01 | 0.116 |
| 8711 | TNK1 | P11T-E | Human | Esophagus | ESCC | 6.63e-11 | 6.17e-01 | 0.1426 |
| 8711 | TNK1 | P12T-E | Human | Esophagus | ESCC | 9.50e-19 | 3.62e-01 | 0.1122 |
| 8711 | TNK1 | P15T-E | Human | Esophagus | ESCC | 1.10e-16 | 2.55e-01 | 0.1149 |
| 8711 | TNK1 | P16T-E | Human | Esophagus | ESCC | 4.99e-13 | 1.88e-01 | 0.1153 |
| 8711 | TNK1 | P17T-E | Human | Esophagus | ESCC | 8.25e-06 | 1.99e-01 | 0.1278 |
| 8711 | TNK1 | P20T-E | Human | Esophagus | ESCC | 9.74e-23 | 5.19e-01 | 0.1124 |
| 8711 | TNK1 | P21T-E | Human | Esophagus | ESCC | 8.61e-34 | 6.70e-01 | 0.1617 |
| 8711 | TNK1 | P22T-E | Human | Esophagus | ESCC | 1.16e-14 | 2.33e-01 | 0.1236 |
| Page: 1 2 3 |
| Tissue | Expression Dynamics | Abbreviation |
| Esophagus | 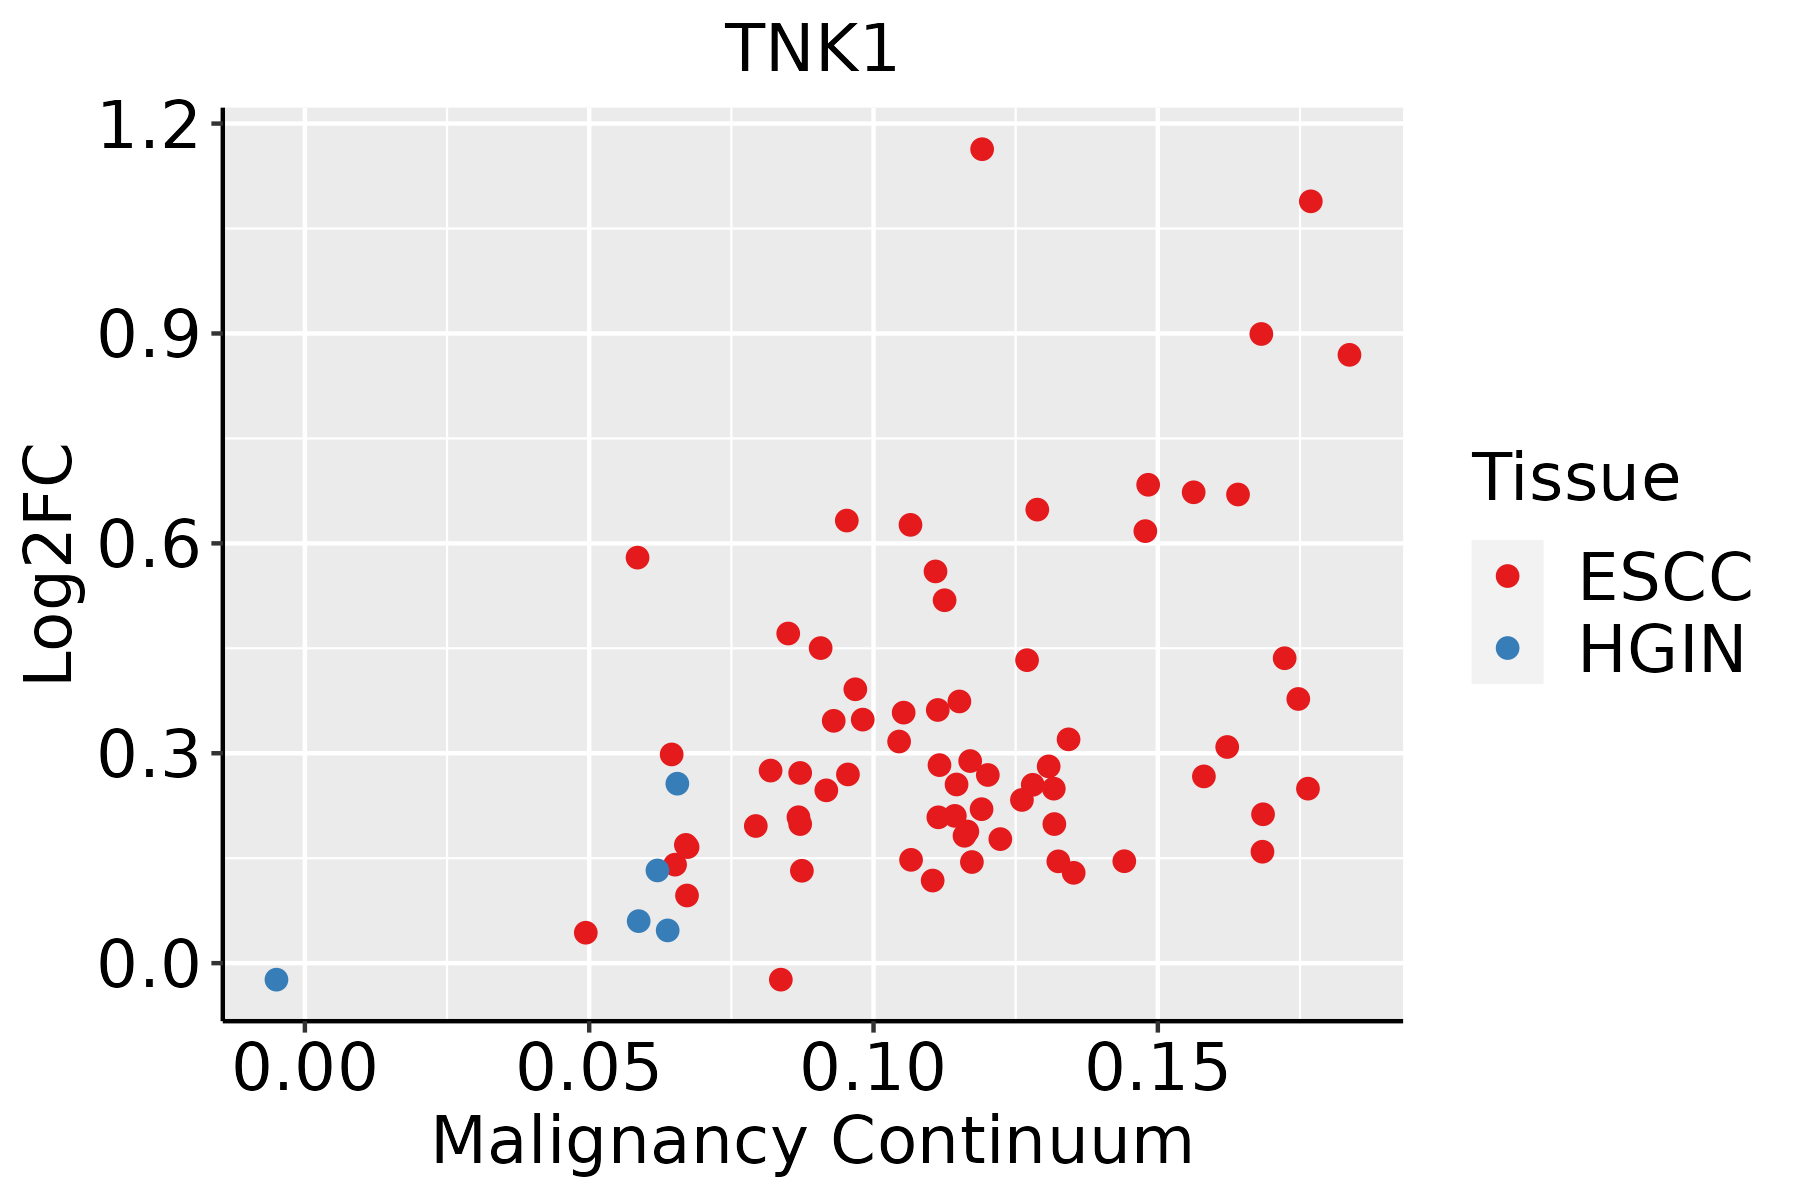 | ESCC: Esophageal squamous cell carcinoma |
| HGIN: High-grade intraepithelial neoplasias | ||
| LGIN: Low-grade intraepithelial neoplasias |
| ∗log2FC in expression of this searched gene in stem-like cells from each diseased tissue sample relative to stem-like cells in normal samples in each tissue plotted against the malignancy continuum. Samples are colored based on if they are from different disease stage. |
Top |
Malignant transformation related pathway analysis |
| Find out the enriched GO biological processes and KEGG pathways involved in transition from healthy to precancer to cancer |
| Tissue | Disease Stage | Enriched GO biological Processes |
| Colorectum | AD |  |
| Colorectum | SER |  |
| Colorectum | MSS |  |
| Colorectum | MSI-H |  |
| Colorectum | FAP |  |
| ∗Top 15 enriched GO BP terms are showed in the bar plot of each disease state in each tissue. Each row represents a significant GO biological process which is colored according to the -log10(p.adjust). |
| Page: 1 2 3 4 5 6 7 8 9 |
| GO ID | Tissue | Disease Stage | Description | Gene Ratio | Bg Ratio | pvalue | p.adjust | Count |
| GO:0006650 | Colorectum | AD | glycerophospholipid metabolic process | 83/3918 | 306/18723 | 5.40e-03 | 3.55e-02 | 83 |
| GO:0006644 | Colorectum | AD | phospholipid metabolic process | 101/3918 | 383/18723 | 5.80e-03 | 3.67e-02 | 101 |
| GO:0045017 | Colorectum | AD | glycerolipid biosynthetic process | 69/3918 | 252/18723 | 8.33e-03 | 4.88e-02 | 69 |
| GO:0046486 | Colorectum | SER | glycerolipid metabolic process | 82/2897 | 392/18723 | 2.26e-03 | 2.17e-02 | 82 |
| GO:00066441 | Colorectum | SER | phospholipid metabolic process | 79/2897 | 383/18723 | 3.94e-03 | 3.24e-02 | 79 |
| GO:00450171 | Colorectum | SER | glycerolipid biosynthetic process | 55/2897 | 252/18723 | 4.47e-03 | 3.56e-02 | 55 |
| GO:00066501 | Colorectum | SER | glycerophospholipid metabolic process | 64/2897 | 306/18723 | 6.41e-03 | 4.60e-02 | 64 |
| GO:0008654 | Colorectum | FAP | phospholipid biosynthetic process | 54/2622 | 253/18723 | 8.88e-04 | 9.08e-03 | 54 |
| GO:00066502 | Colorectum | FAP | glycerophospholipid metabolic process | 62/2622 | 306/18723 | 1.54e-03 | 1.38e-02 | 62 |
| GO:00066442 | Colorectum | FAP | phospholipid metabolic process | 74/2622 | 383/18723 | 2.24e-03 | 1.83e-02 | 74 |
| GO:0046474 | Colorectum | FAP | glycerophospholipid biosynthetic process | 44/2622 | 211/18723 | 3.98e-03 | 2.76e-02 | 44 |
| GO:00450172 | Colorectum | FAP | glycerolipid biosynthetic process | 50/2622 | 252/18723 | 6.32e-03 | 3.95e-02 | 50 |
| GO:00086541 | Colorectum | CRC | phospholipid biosynthetic process | 49/2078 | 253/18723 | 7.07e-05 | 1.51e-03 | 49 |
| GO:00066503 | Colorectum | CRC | glycerophospholipid metabolic process | 55/2078 | 306/18723 | 2.10e-04 | 3.55e-03 | 55 |
| GO:00450173 | Colorectum | CRC | glycerolipid biosynthetic process | 47/2078 | 252/18723 | 2.47e-04 | 4.06e-03 | 47 |
| GO:00066443 | Colorectum | CRC | phospholipid metabolic process | 65/2078 | 383/18723 | 3.21e-04 | 4.95e-03 | 65 |
| GO:00464741 | Colorectum | CRC | glycerophospholipid biosynthetic process | 40/2078 | 211/18723 | 4.91e-04 | 7.02e-03 | 40 |
| GO:00464861 | Colorectum | CRC | glycerolipid metabolic process | 64/2078 | 392/18723 | 1.01e-03 | 1.19e-02 | 64 |
| GO:00086544 | Esophagus | ESCC | phospholipid biosynthetic process | 162/8552 | 253/18723 | 2.59e-09 | 5.73e-08 | 162 |
| GO:00464744 | Esophagus | ESCC | glycerophospholipid biosynthetic process | 135/8552 | 211/18723 | 5.75e-08 | 1.02e-06 | 135 |
| Page: 1 2 |
| Pathway ID | Tissue | Disease Stage | Description | Gene Ratio | Bg Ratio | pvalue | p.adjust | qvalue | Count |
| Page: 1 |
Top |
Cell-cell communication analysis |
| Identification of potential cell-cell interactions between two cell types and their ligand-receptor pairs for different disease states |
| Ligand | Receptor | LRpair | Pathway | Tissue | Disease Stage |
| Page: 1 |
Top |
Single-cell gene regulatory network inference analysis |
| Find out the significant the regulons (TFs) and the target genes of each regulon across cell types for different disease states |
| TF | Cell Type | Tissue | Disease Stage | Target Gene | RSS | Regulon Activity |
| ∗The dot plots of a searched regulon are shown for all cell subpopulations in each disease state of each tissue based on the regulon specific score inferred using pySCENIC and by calculating the average expression. |
| Page: 1 |
Top |
Somatic mutation of malignant transformation related genes |
| Annotation of somatic variants for genes involved in malignant transformation |
| Hugo Symbol | Variant Class | Variant Classification | dbSNP RS | HGVSc | HGVSp | HGVSp Short | SWISSPROT | BIOTYPE | SIFT | PolyPhen | Tumor Sample Barcode | Tissue | Histology | Sex | Age | Stage | Therapy Types | Drugs | Outcome |
| TNK1 | SNV | Missense_Mutation | novel | c.1979G>T | p.Arg660Leu | p.R660L | Q13470 | protein_coding | deleterious(0.03) | possibly_damaging(0.814) | TCGA-AC-A3EH-01 | Breast | breast invasive carcinoma | Female | >=65 | III/IV | Unknown | Unknown | SD |
| TNK1 | insertion | Frame_Shift_Ins | novel | c.1334_1335insG | p.Pro449AlafsTer74 | p.P449Afs*74 | Q13470 | protein_coding | TCGA-BH-A18G-01 | Breast | breast invasive carcinoma | Female | >=65 | I/II | Unknown | Unknown | SD | ||
| TNK1 | deletion | Frame_Shift_Del | novel | c.1277delA | p.Asn426MetfsTer15 | p.N426Mfs*15 | Q13470 | protein_coding | TCGA-EW-A2FV-01 | Breast | breast invasive carcinoma | Female | <65 | III/IV | Chemotherapy | docetaxel | SD | ||
| TNK1 | SNV | Missense_Mutation | novel | c.287N>T | p.Ser96Ile | p.S96I | Q13470 | protein_coding | deleterious(0.02) | benign(0.085) | TCGA-2W-A8YY-01 | Cervix | cervical & endocervical cancer | Female | <65 | I/II | Chemotherapy | cisplatin | CR |
| TNK1 | SNV | Missense_Mutation | novel | c.940N>C | p.Trp314Arg | p.W314R | Q13470 | protein_coding | deleterious(0) | probably_damaging(1) | TCGA-2W-A8YY-01 | Cervix | cervical & endocervical cancer | Female | <65 | I/II | Chemotherapy | cisplatin | CR |
| TNK1 | SNV | Missense_Mutation | novel | c.1583N>A | p.Ala528Asp | p.A528D | Q13470 | protein_coding | tolerated(0.43) | benign(0.003) | TCGA-2W-A8YY-01 | Cervix | cervical & endocervical cancer | Female | <65 | I/II | Chemotherapy | cisplatin | CR |
| TNK1 | SNV | Missense_Mutation | rs369367062 | c.1535N>A | p.Arg512His | p.R512H | Q13470 | protein_coding | tolerated(0.12) | benign(0) | TCGA-AA-3812-01 | Colorectum | colon adenocarcinoma | Female | >=65 | I/II | Unknown | Unknown | PD |
| TNK1 | SNV | Missense_Mutation | novel | c.1650N>A | p.Ser550Arg | p.S550R | Q13470 | protein_coding | tolerated(0.42) | benign(0.027) | TCGA-AA-3845-01 | Colorectum | colon adenocarcinoma | Female | >=65 | I/II | Unknown | Unknown | PD |
| TNK1 | SNV | Missense_Mutation | rs752097496 | c.170N>A | p.Arg57His | p.R57H | Q13470 | protein_coding | deleterious(0) | benign(0.196) | TCGA-AA-A00N-01 | Colorectum | colon adenocarcinoma | Male | >=65 | I/II | Unknown | Unknown | PD |
| TNK1 | SNV | Missense_Mutation | novel | c.1066G>A | p.Ala356Thr | p.A356T | Q13470 | protein_coding | deleterious(0.02) | possibly_damaging(0.491) | TCGA-AA-A010-01 | Colorectum | colon adenocarcinoma | Female | <65 | I/II | Chemotherapy | folinic | CR |
| Page: 1 2 3 4 5 6 |
Top |
Related drugs of malignant transformation related genes |
| Identification of chemicals and drugs interact with genes involved in malignant transfromation |
| (DGIdb 4.0) |
| Entrez ID | Symbol | Category | Interaction Types | Drug Claim Name | Drug Name | PMIDs |
| 8711 | TNK1 | KINASE, DRUGGABLE GENOME, TYROSINE KINASE, ENZYME | inhibitor | TOZASERTIB | TOZASERTIB | 19035792 |
| 8711 | TNK1 | KINASE, DRUGGABLE GENOME, TYROSINE KINASE, ENZYME | inhibitor | 249565737 | ||
| 8711 | TNK1 | KINASE, DRUGGABLE GENOME, TYROSINE KINASE, ENZYME | inhibitor | 363894223 |
| Page: 1 |

Copyright 2023-Present -The University of Texas Health Science Center at Houston |