
|
|||||
|
 | |
| |
| |
| |
| |
| |
|
Gene: TNIP2 |
Gene summary for TNIP2 |
| Gene information | Species | Human | Gene symbol | TNIP2 | Gene ID | 79155 |
| Gene name | TNFAIP3 interacting protein 2 | |
| Gene Alias | ABIN2 | |
| Cytomap | 4p16.3 | |
| Gene Type | protein-coding | GO ID | GO:0001775 | UniProtAcc | Q8NFZ5 |
Top |
Malignant transformation analysis |
| Identification of the aberrant gene expression in precancerous and cancerous lesions by comparing the gene expression of stem-like cells in diseased tissues with normal stem cells |
| Entrez ID | Symbol | Replicates | Species | Organ | Tissue | Adj P-value | Log2FC | Malignancy |
| 79155 | TNIP2 | LZE20T | Human | Esophagus | ESCC | 1.62e-04 | 3.31e-01 | 0.0662 |
| 79155 | TNIP2 | LZE22T | Human | Esophagus | ESCC | 1.88e-06 | 4.65e-01 | 0.068 |
| 79155 | TNIP2 | LZE24T | Human | Esophagus | ESCC | 1.48e-12 | 4.48e-01 | 0.0596 |
| 79155 | TNIP2 | P1T-E | Human | Esophagus | ESCC | 3.69e-06 | 4.88e-01 | 0.0875 |
| 79155 | TNIP2 | P2T-E | Human | Esophagus | ESCC | 1.87e-09 | 2.75e-01 | 0.1177 |
| 79155 | TNIP2 | P4T-E | Human | Esophagus | ESCC | 2.56e-13 | 2.67e-01 | 0.1323 |
| 79155 | TNIP2 | P5T-E | Human | Esophagus | ESCC | 3.49e-18 | 2.63e-01 | 0.1327 |
| 79155 | TNIP2 | P8T-E | Human | Esophagus | ESCC | 6.58e-26 | 4.65e-01 | 0.0889 |
| 79155 | TNIP2 | P9T-E | Human | Esophagus | ESCC | 3.70e-11 | 2.88e-01 | 0.1131 |
| 79155 | TNIP2 | P10T-E | Human | Esophagus | ESCC | 1.14e-16 | 1.52e-01 | 0.116 |
| 79155 | TNIP2 | P11T-E | Human | Esophagus | ESCC | 2.49e-10 | 4.06e-01 | 0.1426 |
| 79155 | TNIP2 | P12T-E | Human | Esophagus | ESCC | 7.51e-15 | 2.46e-01 | 0.1122 |
| 79155 | TNIP2 | P15T-E | Human | Esophagus | ESCC | 5.10e-14 | 2.84e-01 | 0.1149 |
| 79155 | TNIP2 | P16T-E | Human | Esophagus | ESCC | 3.85e-12 | 6.95e-02 | 0.1153 |
| 79155 | TNIP2 | P17T-E | Human | Esophagus | ESCC | 1.62e-08 | 3.99e-01 | 0.1278 |
| 79155 | TNIP2 | P19T-E | Human | Esophagus | ESCC | 2.84e-08 | 7.38e-01 | 0.1662 |
| 79155 | TNIP2 | P20T-E | Human | Esophagus | ESCC | 1.34e-09 | 2.50e-01 | 0.1124 |
| 79155 | TNIP2 | P21T-E | Human | Esophagus | ESCC | 1.35e-23 | 4.22e-01 | 0.1617 |
| 79155 | TNIP2 | P22T-E | Human | Esophagus | ESCC | 2.03e-10 | 1.79e-01 | 0.1236 |
| 79155 | TNIP2 | P23T-E | Human | Esophagus | ESCC | 9.91e-27 | 6.27e-01 | 0.108 |
| Page: 1 2 3 4 5 6 |
| Tissue | Expression Dynamics | Abbreviation |
| Esophagus | 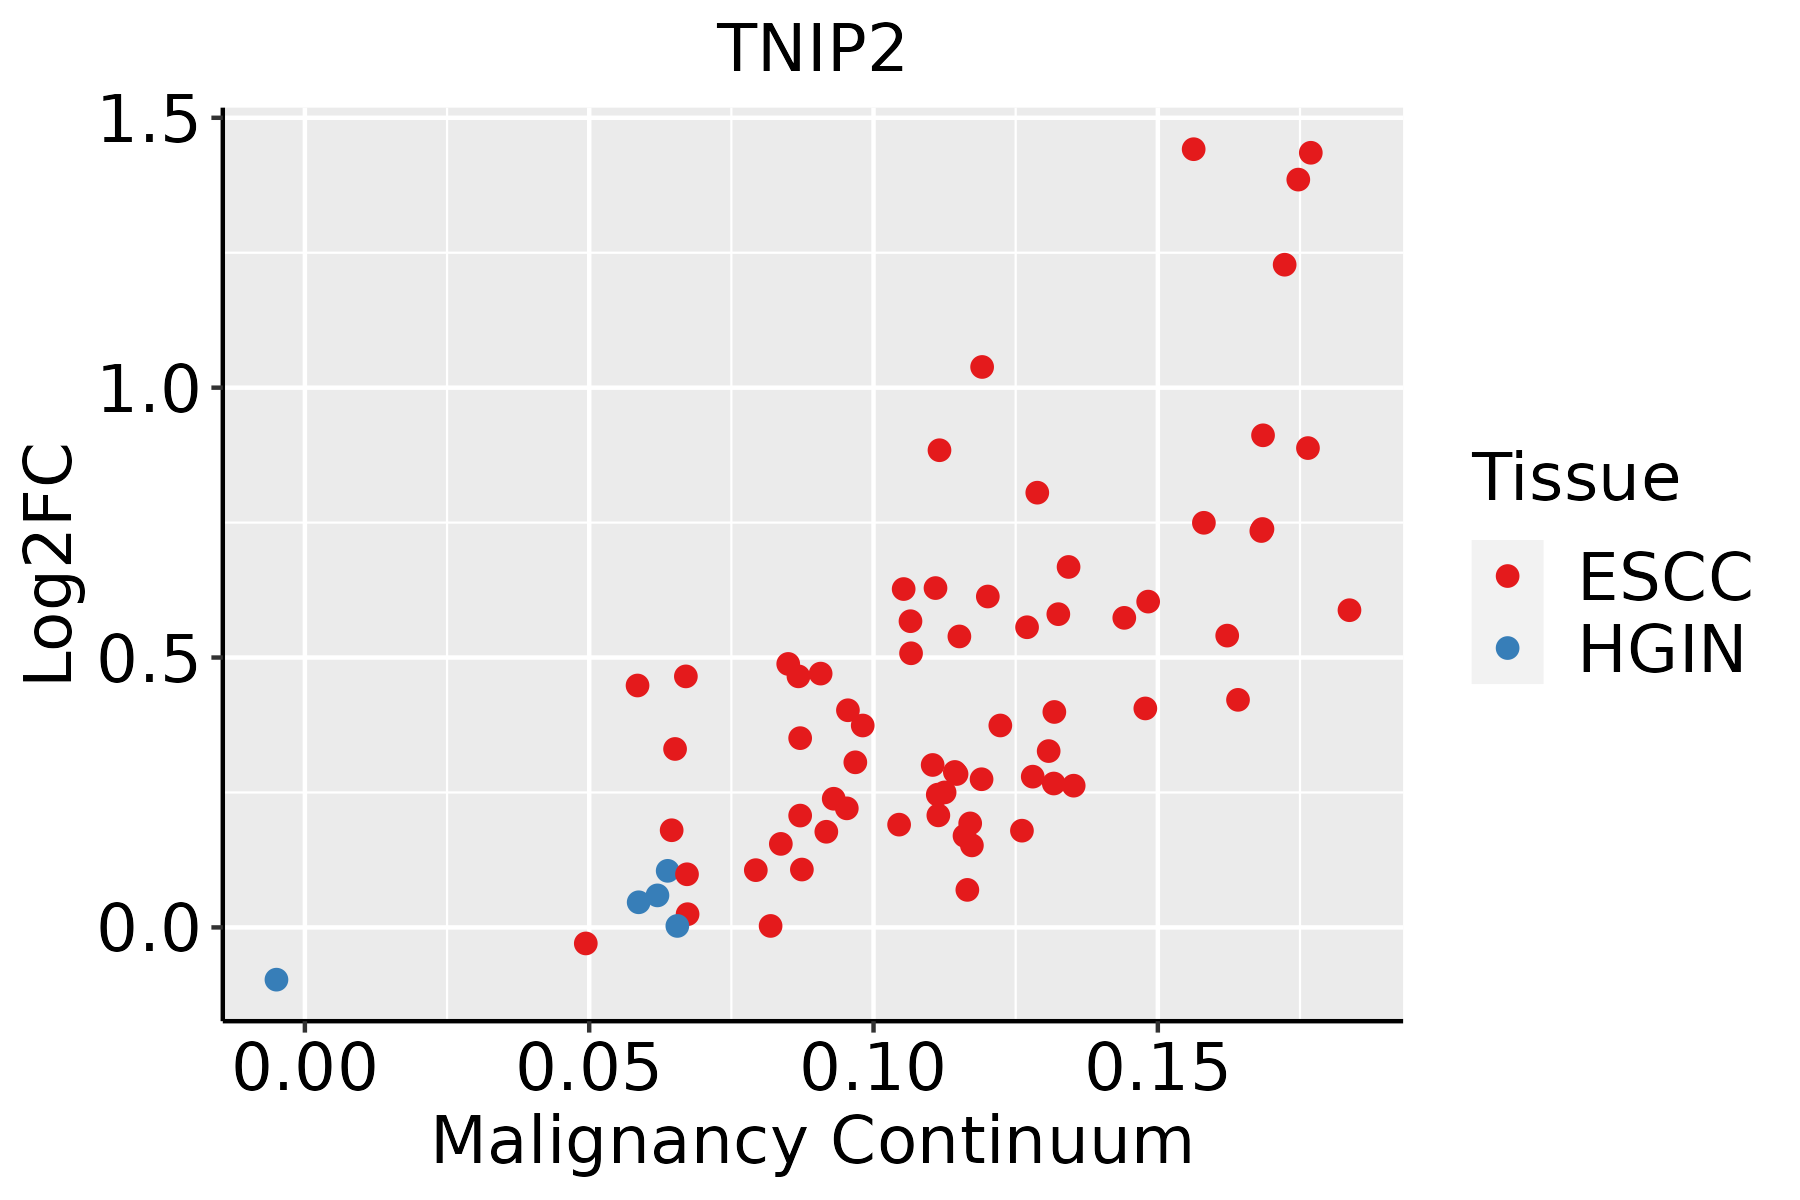 | ESCC: Esophageal squamous cell carcinoma |
| HGIN: High-grade intraepithelial neoplasias | ||
| LGIN: Low-grade intraepithelial neoplasias | ||
| Liver | 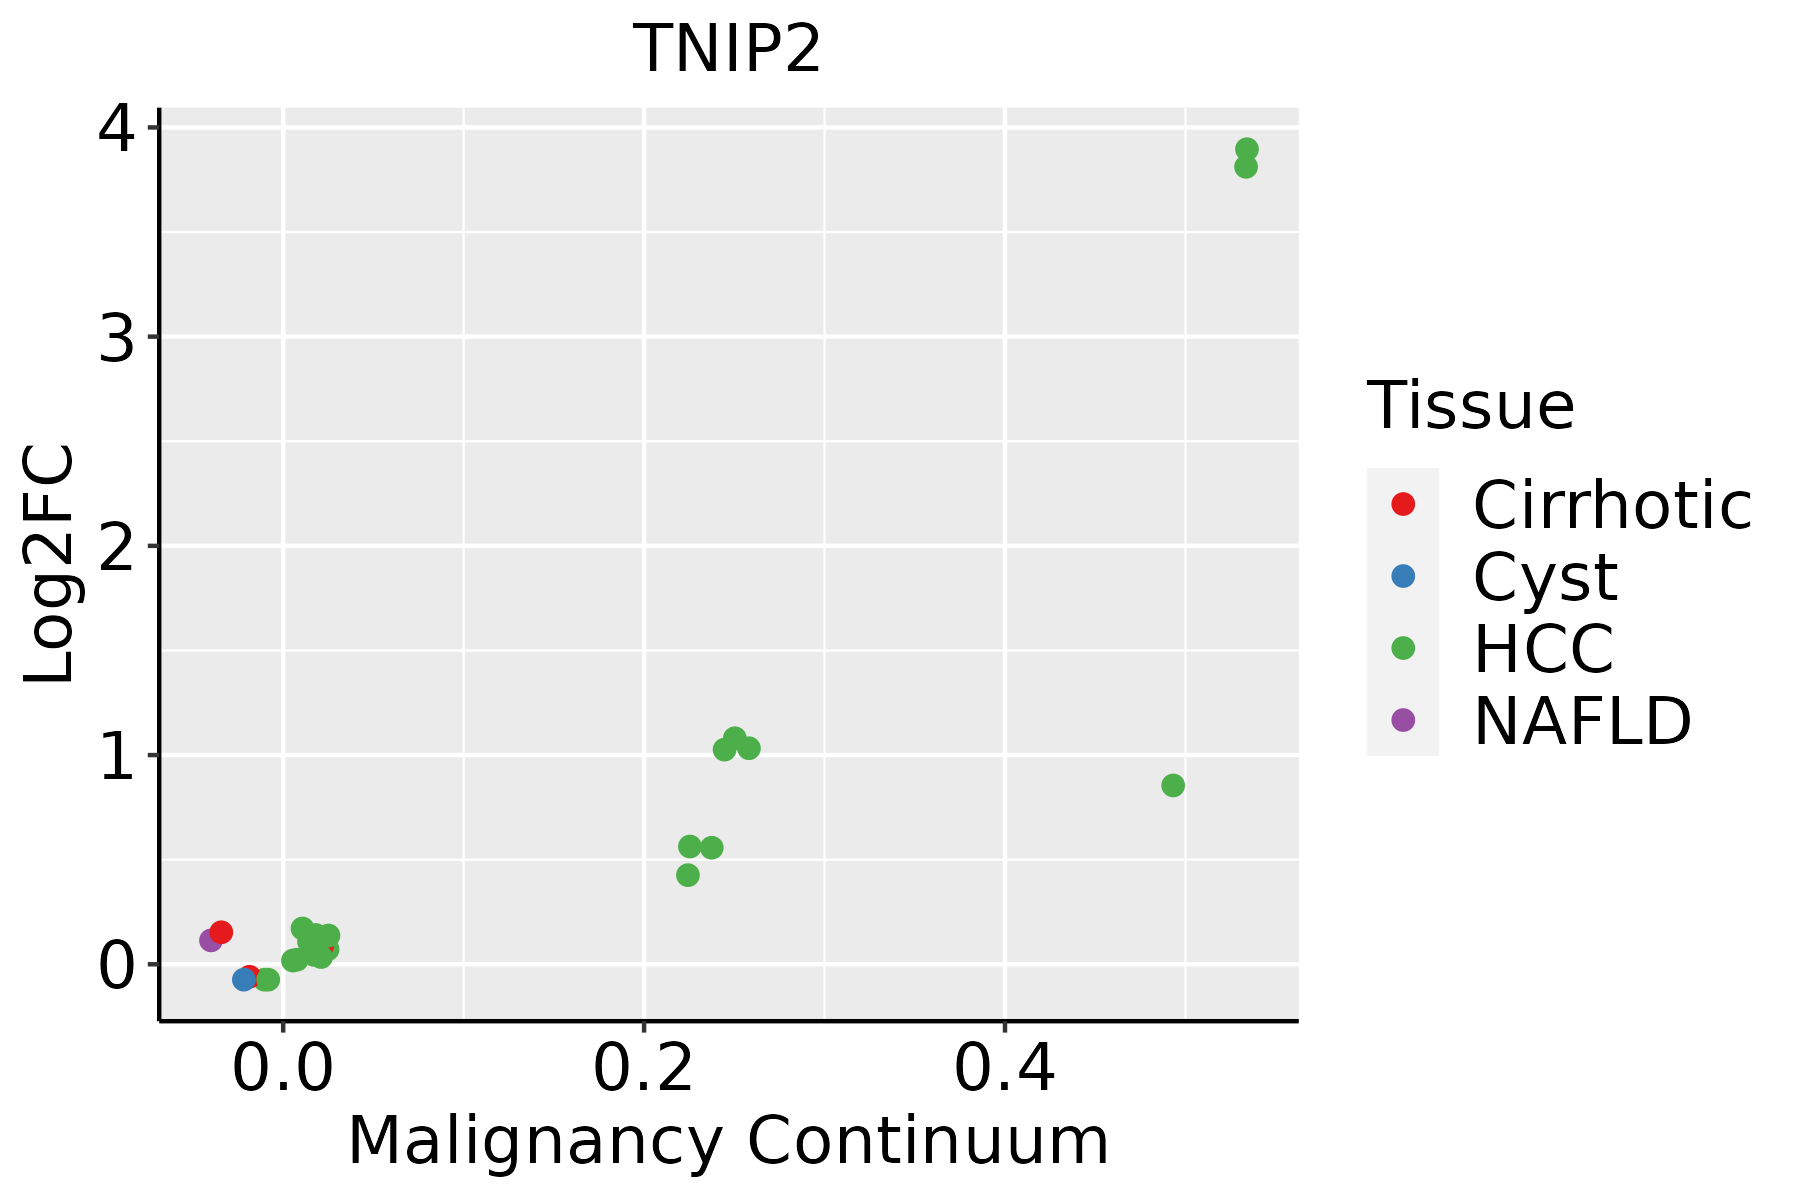 | HCC: Hepatocellular carcinoma |
| NAFLD: Non-alcoholic fatty liver disease | ||
| Oral Cavity | 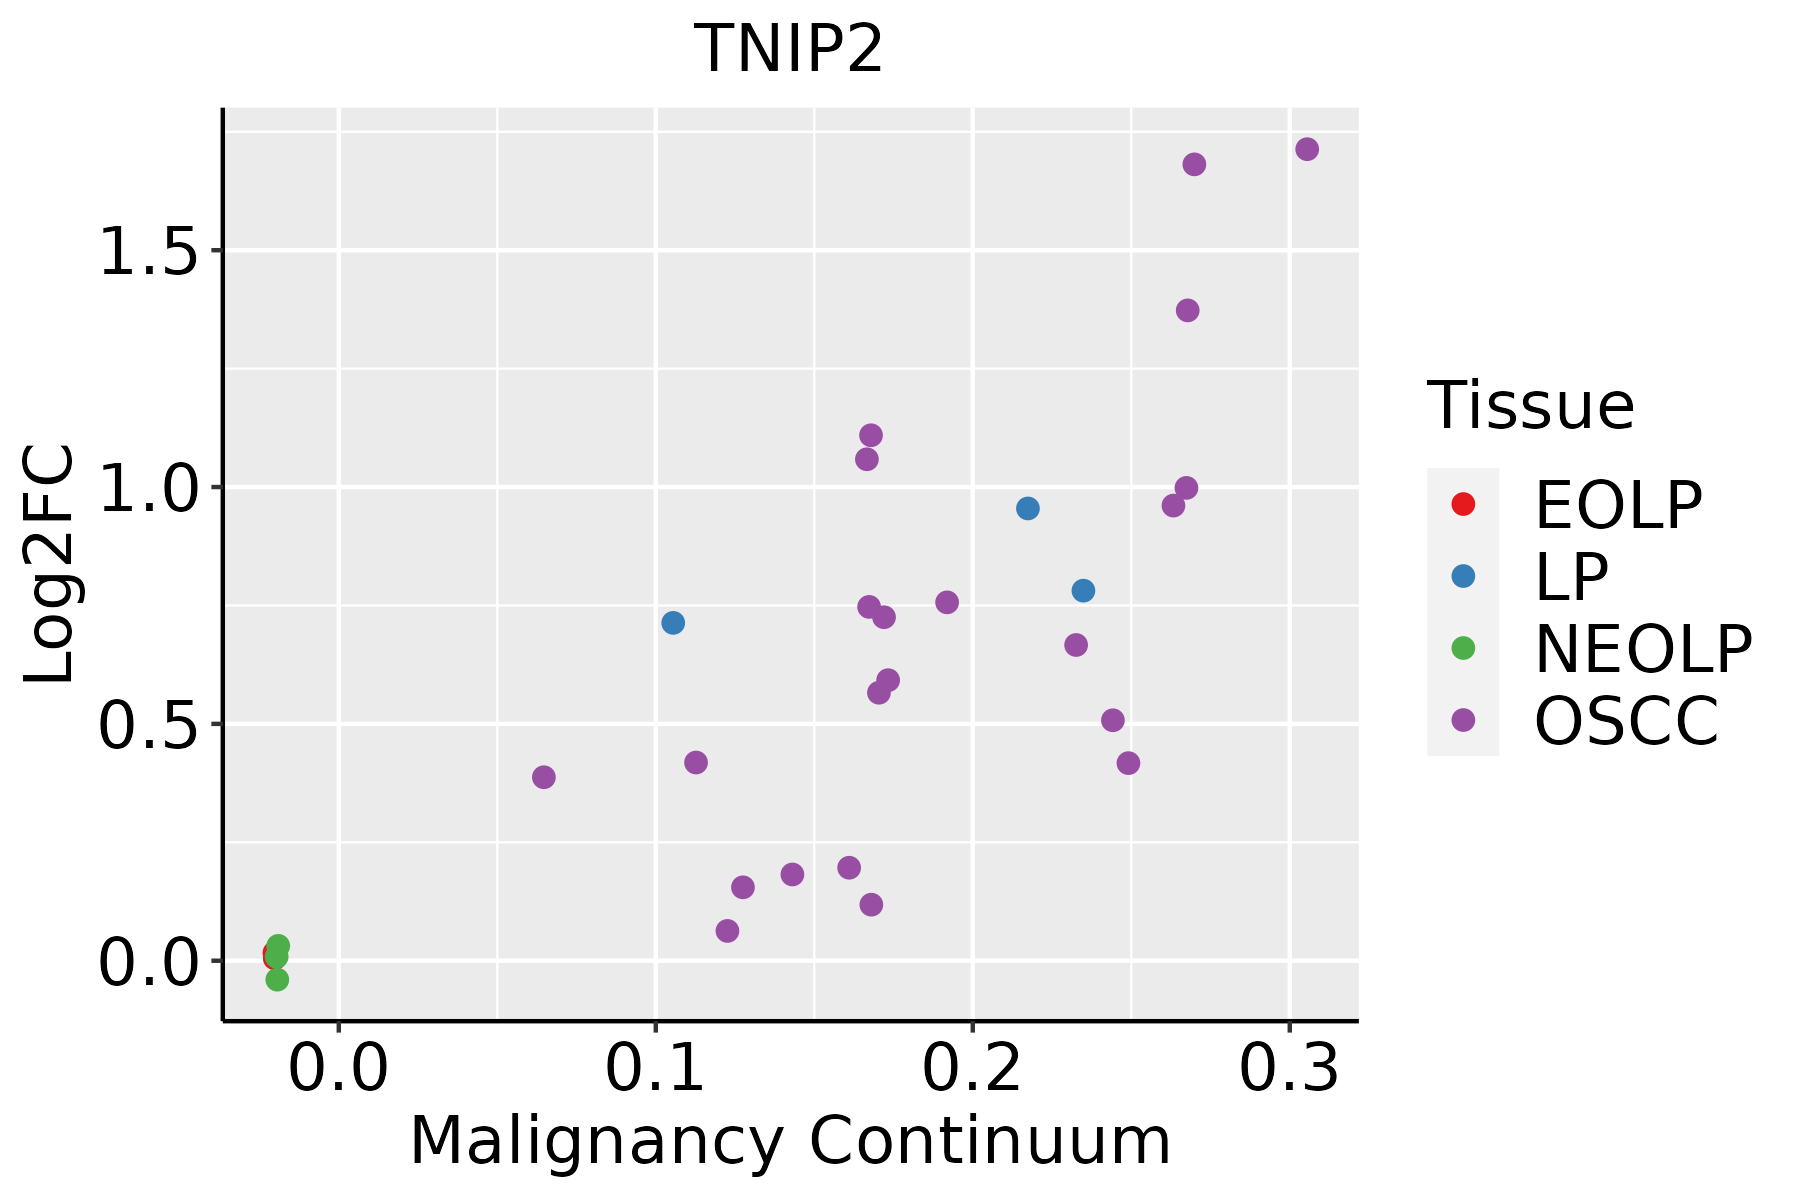 | EOLP: Erosive Oral lichen planus |
| LP: leukoplakia | ||
| NEOLP: Non-erosive oral lichen planus | ||
| OSCC: Oral squamous cell carcinoma | ||
| Skin | 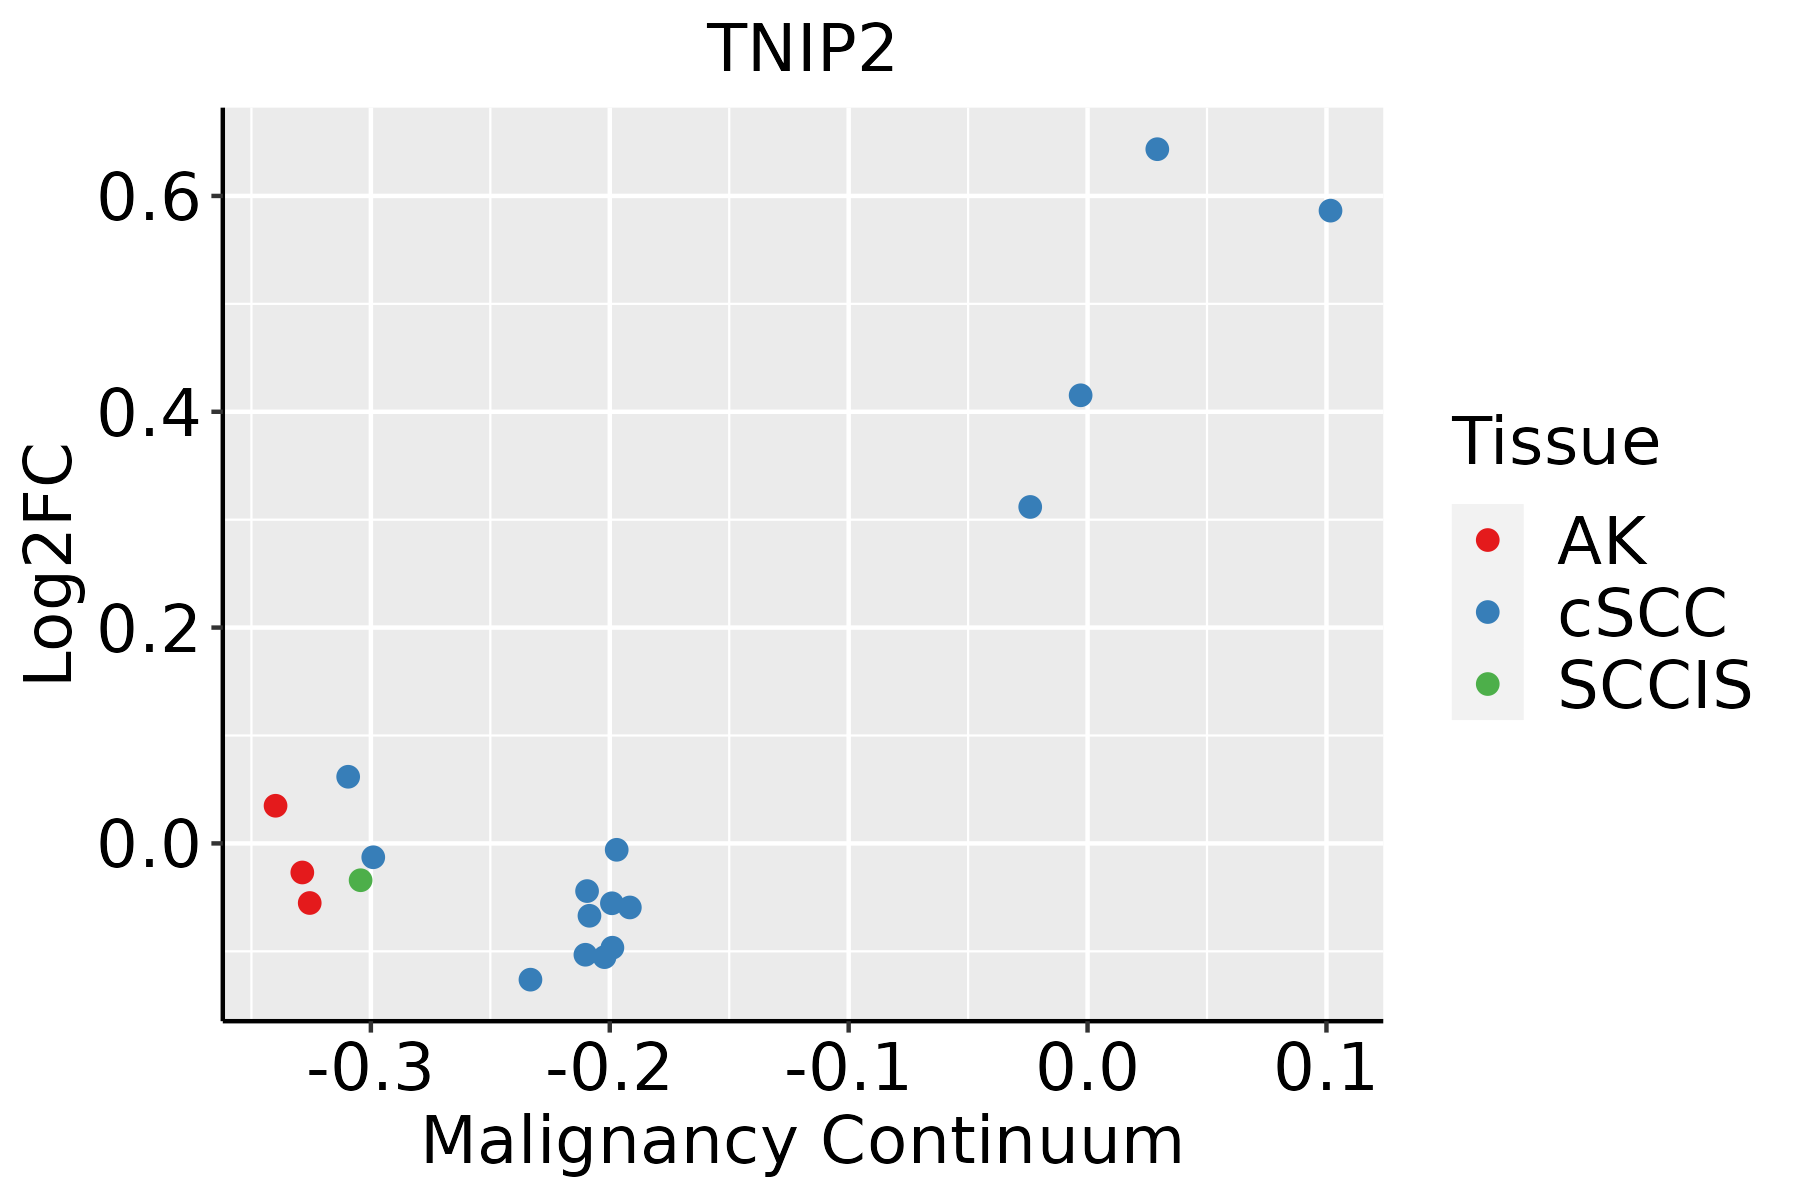 | AK: Actinic keratosis |
| cSCC: Cutaneous squamous cell carcinoma | ||
| SCCIS:squamous cell carcinoma in situ | ||
| Thyroid | 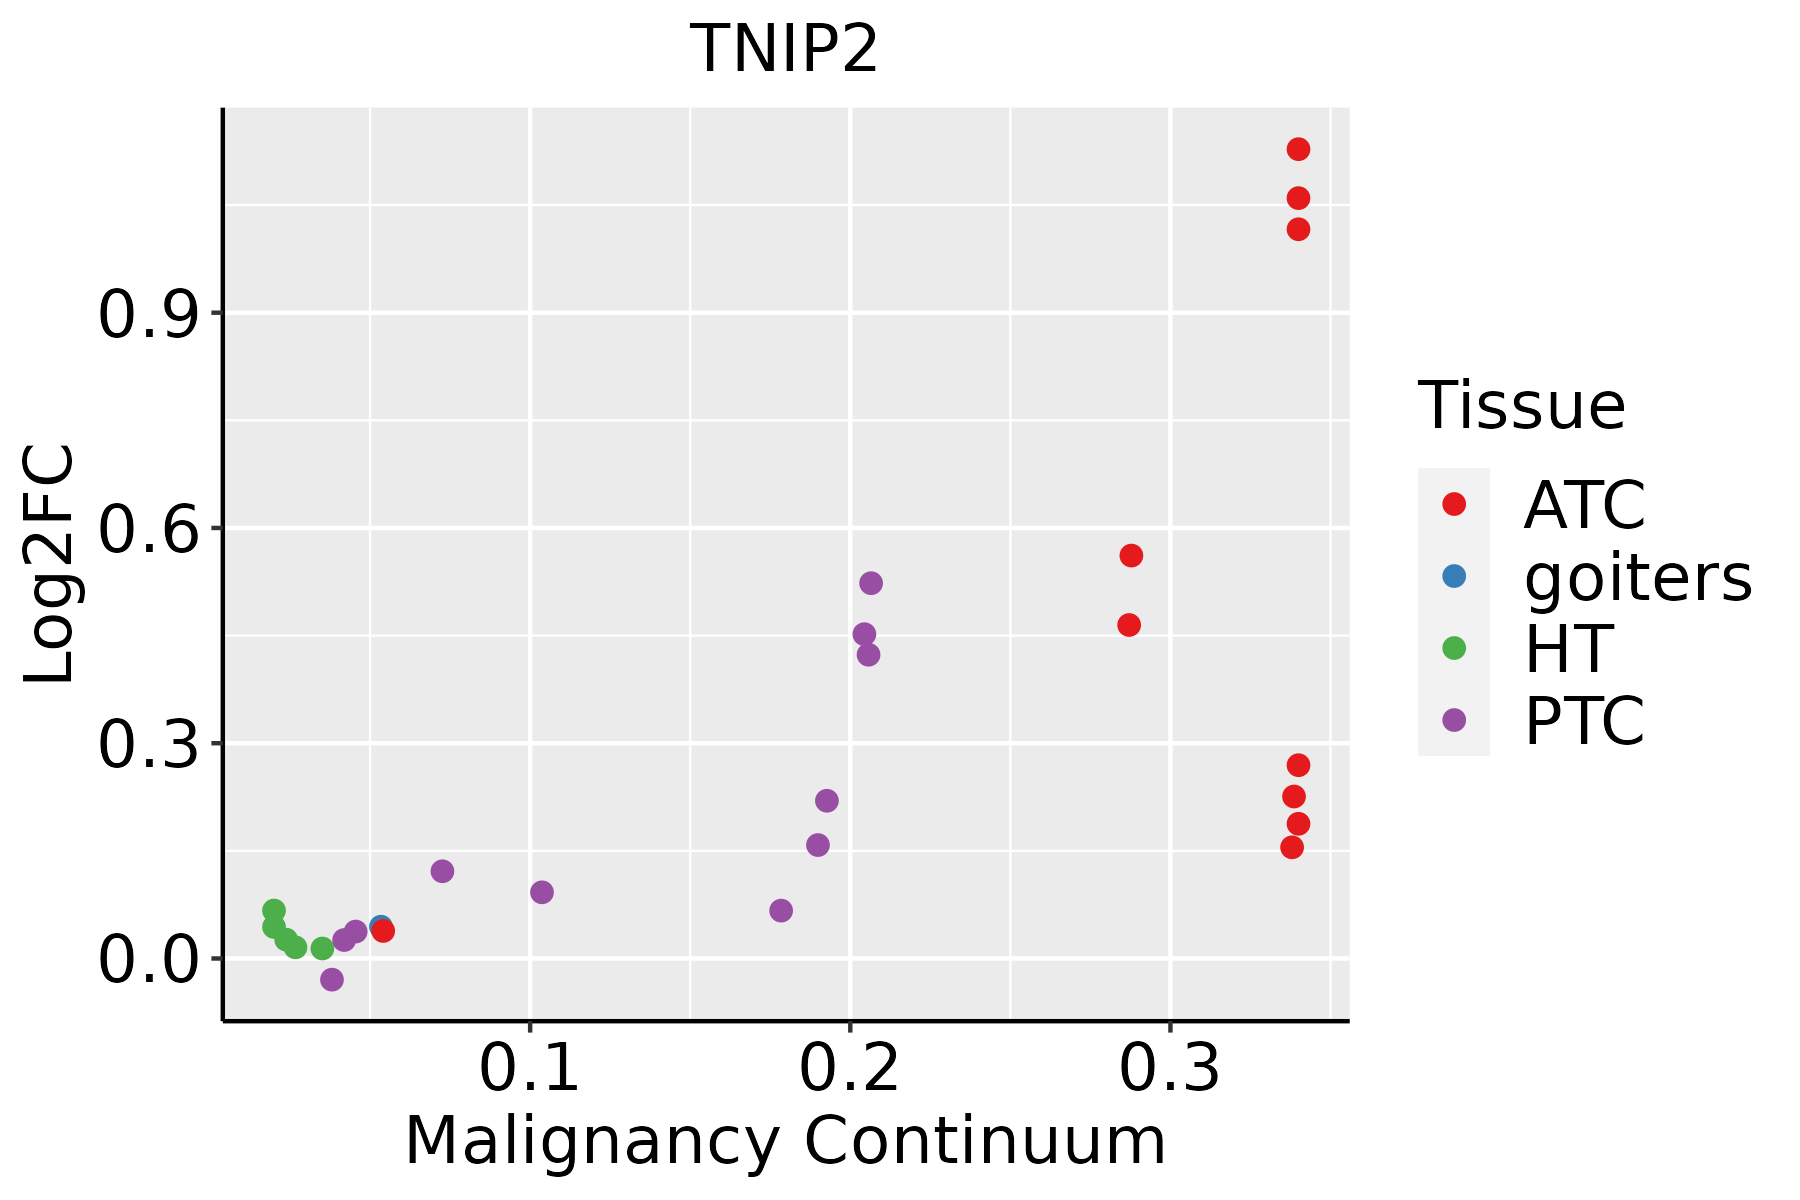 | ATC: Anaplastic thyroid cancer |
| HT: Hashimoto's thyroiditis | ||
| PTC: Papillary thyroid cancer |
| ∗log2FC in expression of this searched gene in stem-like cells from each diseased tissue sample relative to stem-like cells in normal samples in each tissue plotted against the malignancy continuum. Samples are colored based on if they are from different disease stage. |
Top |
Malignant transformation related pathway analysis |
| Find out the enriched GO biological processes and KEGG pathways involved in transition from healthy to precancer to cancer |
| Tissue | Disease Stage | Enriched GO biological Processes |
| Colorectum | AD |  |
| Colorectum | SER |  |
| Colorectum | MSS |  |
| Colorectum | MSI-H |  |
| Colorectum | FAP |  |
| ∗Top 15 enriched GO BP terms are showed in the bar plot of each disease state in each tissue. Each row represents a significant GO biological process which is colored according to the -log10(p.adjust). |
| Page: 1 2 3 4 5 6 7 8 9 |
| GO ID | Tissue | Disease Stage | Description | Gene Ratio | Bg Ratio | pvalue | p.adjust | Count |
| GO:0031647111 | Esophagus | ESCC | regulation of protein stability | 223/8552 | 298/18723 | 5.76e-25 | 1.52e-22 | 223 |
| GO:0050821111 | Esophagus | ESCC | protein stabilization | 140/8552 | 191/18723 | 6.50e-15 | 3.61e-13 | 140 |
| GO:004312318 | Esophagus | ESCC | positive regulation of I-kappaB kinase/NF-kappaB signaling | 132/8552 | 186/18723 | 2.07e-12 | 8.58e-11 | 132 |
| GO:0043122110 | Esophagus | ESCC | regulation of I-kappaB kinase/NF-kappaB signaling | 167/8552 | 249/18723 | 6.11e-12 | 2.32e-10 | 167 |
| GO:000724919 | Esophagus | ESCC | I-kappaB kinase/NF-kappaB signaling | 183/8552 | 281/18723 | 3.02e-11 | 1.01e-09 | 183 |
| GO:003249619 | Esophagus | ESCC | response to lipopolysaccharide | 191/8552 | 343/18723 | 1.11e-04 | 7.73e-04 | 191 |
| GO:000223719 | Esophagus | ESCC | response to molecule of bacterial origin | 194/8552 | 363/18723 | 1.64e-03 | 7.61e-03 | 194 |
| GO:007122215 | Esophagus | ESCC | cellular response to lipopolysaccharide | 113/8552 | 209/18723 | 8.79e-03 | 3.10e-02 | 113 |
| GO:007121617 | Esophagus | ESCC | cellular response to biotic stimulus | 131/8552 | 246/18723 | 9.85e-03 | 3.39e-02 | 131 |
| GO:19040197 | Esophagus | ESCC | epithelial cell apoptotic process | 68/8552 | 121/18723 | 1.27e-02 | 4.21e-02 | 68 |
| GO:003164712 | Liver | Cirrhotic | regulation of protein stability | 144/4634 | 298/18723 | 6.74e-19 | 1.28e-16 | 144 |
| GO:005082112 | Liver | Cirrhotic | protein stabilization | 97/4634 | 191/18723 | 6.67e-15 | 6.97e-13 | 97 |
| GO:00072494 | Liver | Cirrhotic | I-kappaB kinase/NF-kappaB signaling | 108/4634 | 281/18723 | 2.21e-07 | 5.64e-06 | 108 |
| GO:00431225 | Liver | Cirrhotic | regulation of I-kappaB kinase/NF-kappaB signaling | 95/4634 | 249/18723 | 1.68e-06 | 3.22e-05 | 95 |
| GO:00431234 | Liver | Cirrhotic | positive regulation of I-kappaB kinase/NF-kappaB signaling | 71/4634 | 186/18723 | 3.20e-05 | 3.97e-04 | 71 |
| GO:00324966 | Liver | Cirrhotic | response to lipopolysaccharide | 111/4634 | 343/18723 | 8.15e-04 | 5.95e-03 | 111 |
| GO:00705553 | Liver | Cirrhotic | response to interleukin-1 | 52/4634 | 143/18723 | 1.27e-03 | 8.54e-03 | 52 |
| GO:19040191 | Liver | Cirrhotic | epithelial cell apoptotic process | 44/4634 | 121/18723 | 2.86e-03 | 1.65e-02 | 44 |
| GO:00022376 | Liver | Cirrhotic | response to molecule of bacterial origin | 113/4634 | 363/18723 | 3.23e-03 | 1.81e-02 | 113 |
| GO:0071347 | Liver | Cirrhotic | cellular response to interleukin-1 | 41/4634 | 113/18723 | 4.08e-03 | 2.19e-02 | 41 |
| Page: 1 2 3 4 5 |
| Pathway ID | Tissue | Disease Stage | Description | Gene Ratio | Bg Ratio | pvalue | p.adjust | qvalue | Count |
| Page: 1 |
Top |
Cell-cell communication analysis |
| Identification of potential cell-cell interactions between two cell types and their ligand-receptor pairs for different disease states |
| Ligand | Receptor | LRpair | Pathway | Tissue | Disease Stage |
| Page: 1 |
Top |
Single-cell gene regulatory network inference analysis |
| Find out the significant the regulons (TFs) and the target genes of each regulon across cell types for different disease states |
| TF | Cell Type | Tissue | Disease Stage | Target Gene | RSS | Regulon Activity |
| ∗The dot plots of a searched regulon are shown for all cell subpopulations in each disease state of each tissue based on the regulon specific score inferred using pySCENIC and by calculating the average expression. |
| Page: 1 |
Top |
Somatic mutation of malignant transformation related genes |
| Annotation of somatic variants for genes involved in malignant transformation |
| Hugo Symbol | Variant Class | Variant Classification | dbSNP RS | HGVSc | HGVSp | HGVSp Short | SWISSPROT | BIOTYPE | SIFT | PolyPhen | Tumor Sample Barcode | Tissue | Histology | Sex | Age | Stage | Therapy Types | Drugs | Outcome |
| TNIP2 | SNV | Missense_Mutation | novel | c.1063G>A | p.Gly355Arg | p.G355R | Q8NFZ5 | protein_coding | deleterious(0.04) | possibly_damaging(0.708) | TCGA-BH-A2L8-01 | Breast | breast invasive carcinoma | Female | <65 | I/II | Chemotherapy | cytoxan | CR |
| TNIP2 | SNV | Missense_Mutation | novel | c.625N>A | p.Glu209Lys | p.E209K | Q8NFZ5 | protein_coding | deleterious(0) | benign(0.124) | TCGA-ZJ-AAXF-01 | Cervix | cervical & endocervical cancer | Female | <65 | I/II | Unknown | Unknown | SD |
| TNIP2 | SNV | Missense_Mutation | rs539733626 | c.524N>A | p.Arg175Gln | p.R175Q | Q8NFZ5 | protein_coding | tolerated(0.21) | benign(0) | TCGA-AA-A00N-01 | Colorectum | colon adenocarcinoma | Male | >=65 | I/II | Unknown | Unknown | PD |
| TNIP2 | SNV | Missense_Mutation | rs545493843 | c.415N>A | p.Ala139Thr | p.A139T | Q8NFZ5 | protein_coding | tolerated(1) | benign(0.019) | TCGA-AA-A022-01 | Colorectum | colon adenocarcinoma | Female | >=65 | I/II | Unknown | Unknown | SD |
| TNIP2 | SNV | Missense_Mutation | c.388N>G | p.Met130Val | p.M130V | Q8NFZ5 | protein_coding | tolerated(0.92) | benign(0) | TCGA-CM-6169-01 | Colorectum | colon adenocarcinoma | Male | >=65 | I/II | Ancillary | leucovorin | SD | |
| TNIP2 | SNV | Missense_Mutation | rs545493843 | c.415N>A | p.Ala139Thr | p.A139T | Q8NFZ5 | protein_coding | tolerated(1) | benign(0.019) | TCGA-AG-3901-01 | Colorectum | rectum adenocarcinoma | Female | >=65 | III/IV | Unknown | Unknown | SD |
| TNIP2 | SNV | Missense_Mutation | rs768831983 | c.712G>A | p.Val238Met | p.V238M | Q8NFZ5 | protein_coding | deleterious(0) | probably_damaging(0.997) | TCGA-A5-A0G2-01 | Endometrium | uterine corpus endometrioid carcinoma | Female | <65 | III/IV | Unknown | Unknown | SD |
| TNIP2 | SNV | Missense_Mutation | rs770013204 | c.706N>A | p.Glu236Lys | p.E236K | Q8NFZ5 | protein_coding | deleterious(0.03) | probably_damaging(0.993) | TCGA-A5-A2K5-01 | Endometrium | uterine corpus endometrioid carcinoma | Female | >=65 | I/II | Unknown | Unknown | SD |
| TNIP2 | SNV | Missense_Mutation | c.921N>T | p.Lys307Asn | p.K307N | Q8NFZ5 | protein_coding | deleterious(0) | probably_damaging(0.914) | TCGA-AP-A059-01 | Endometrium | uterine corpus endometrioid carcinoma | Female | >=65 | I/II | Unknown | Unknown | SD | |
| TNIP2 | SNV | Missense_Mutation | novel | c.391N>A | p.Ala131Thr | p.A131T | Q8NFZ5 | protein_coding | deleterious(0.04) | possibly_damaging(0.476) | TCGA-AP-A1DV-01 | Endometrium | uterine corpus endometrioid carcinoma | Female | <65 | I/II | Unknown | Unknown | SD |
| Page: 1 2 3 |
Top |
Related drugs of malignant transformation related genes |
| Identification of chemicals and drugs interact with genes involved in malignant transfromation |
| (DGIdb 4.0) |
| Entrez ID | Symbol | Category | Interaction Types | Drug Claim Name | Drug Name | PMIDs |
| Page: 1 |

Copyright 2023-Present -The University of Texas Health Science Center at Houston |