
|
|||||
|
 | |
| |
| |
| |
| |
| |
|
Gene: TNFSF15 |
Gene summary for TNFSF15 |
| Gene information | Species | Human | Gene symbol | TNFSF15 | Gene ID | 9966 |
| Gene name | TNF superfamily member 15 | |
| Gene Alias | TL1 | |
| Cytomap | 9q32 | |
| Gene Type | protein-coding | GO ID | GO:0001932 | UniProtAcc | O95150 |
Top |
Malignant transformation analysis |
| Identification of the aberrant gene expression in precancerous and cancerous lesions by comparing the gene expression of stem-like cells in diseased tissues with normal stem cells |
| Entrez ID | Symbol | Replicates | Species | Organ | Tissue | Adj P-value | Log2FC | Malignancy |
| 9966 | TNFSF15 | HCC2_Meng | Human | Liver | HCC | 1.12e-05 | 8.45e-02 | 0.0107 |
| 9966 | TNFSF15 | HCC1 | Human | Liver | HCC | 2.32e-07 | 6.34e-01 | 0.5336 |
| 9966 | TNFSF15 | HCC2 | Human | Liver | HCC | 1.57e-17 | 1.26e+00 | 0.5341 |
| 9966 | TNFSF15 | HCC5 | Human | Liver | HCC | 1.05e-06 | 6.16e-01 | 0.4932 |
| 9966 | TNFSF15 | S028 | Human | Liver | HCC | 2.26e-05 | 1.85e-01 | 0.2503 |
| 9966 | TNFSF15 | male-WTA | Human | Thyroid | PTC | 2.77e-02 | 8.82e-02 | 0.1037 |
| 9966 | TNFSF15 | PTC01 | Human | Thyroid | PTC | 3.08e-03 | 6.06e-02 | 0.1899 |
| 9966 | TNFSF15 | PTC05 | Human | Thyroid | PTC | 2.87e-07 | 3.91e-01 | 0.2065 |
| 9966 | TNFSF15 | PTC06 | Human | Thyroid | PTC | 3.41e-10 | 4.81e-01 | 0.2057 |
| 9966 | TNFSF15 | PTC07 | Human | Thyroid | PTC | 3.24e-06 | 2.50e-01 | 0.2044 |
| 9966 | TNFSF15 | ATC13 | Human | Thyroid | ATC | 4.92e-23 | 5.06e-01 | 0.34 |
| 9966 | TNFSF15 | ATC5 | Human | Thyroid | ATC | 6.27e-26 | 5.73e-01 | 0.34 |
| Page: 1 |
| Tissue | Expression Dynamics | Abbreviation |
| Liver |  | HCC: Hepatocellular carcinoma |
| NAFLD: Non-alcoholic fatty liver disease | ||
| Thyroid | 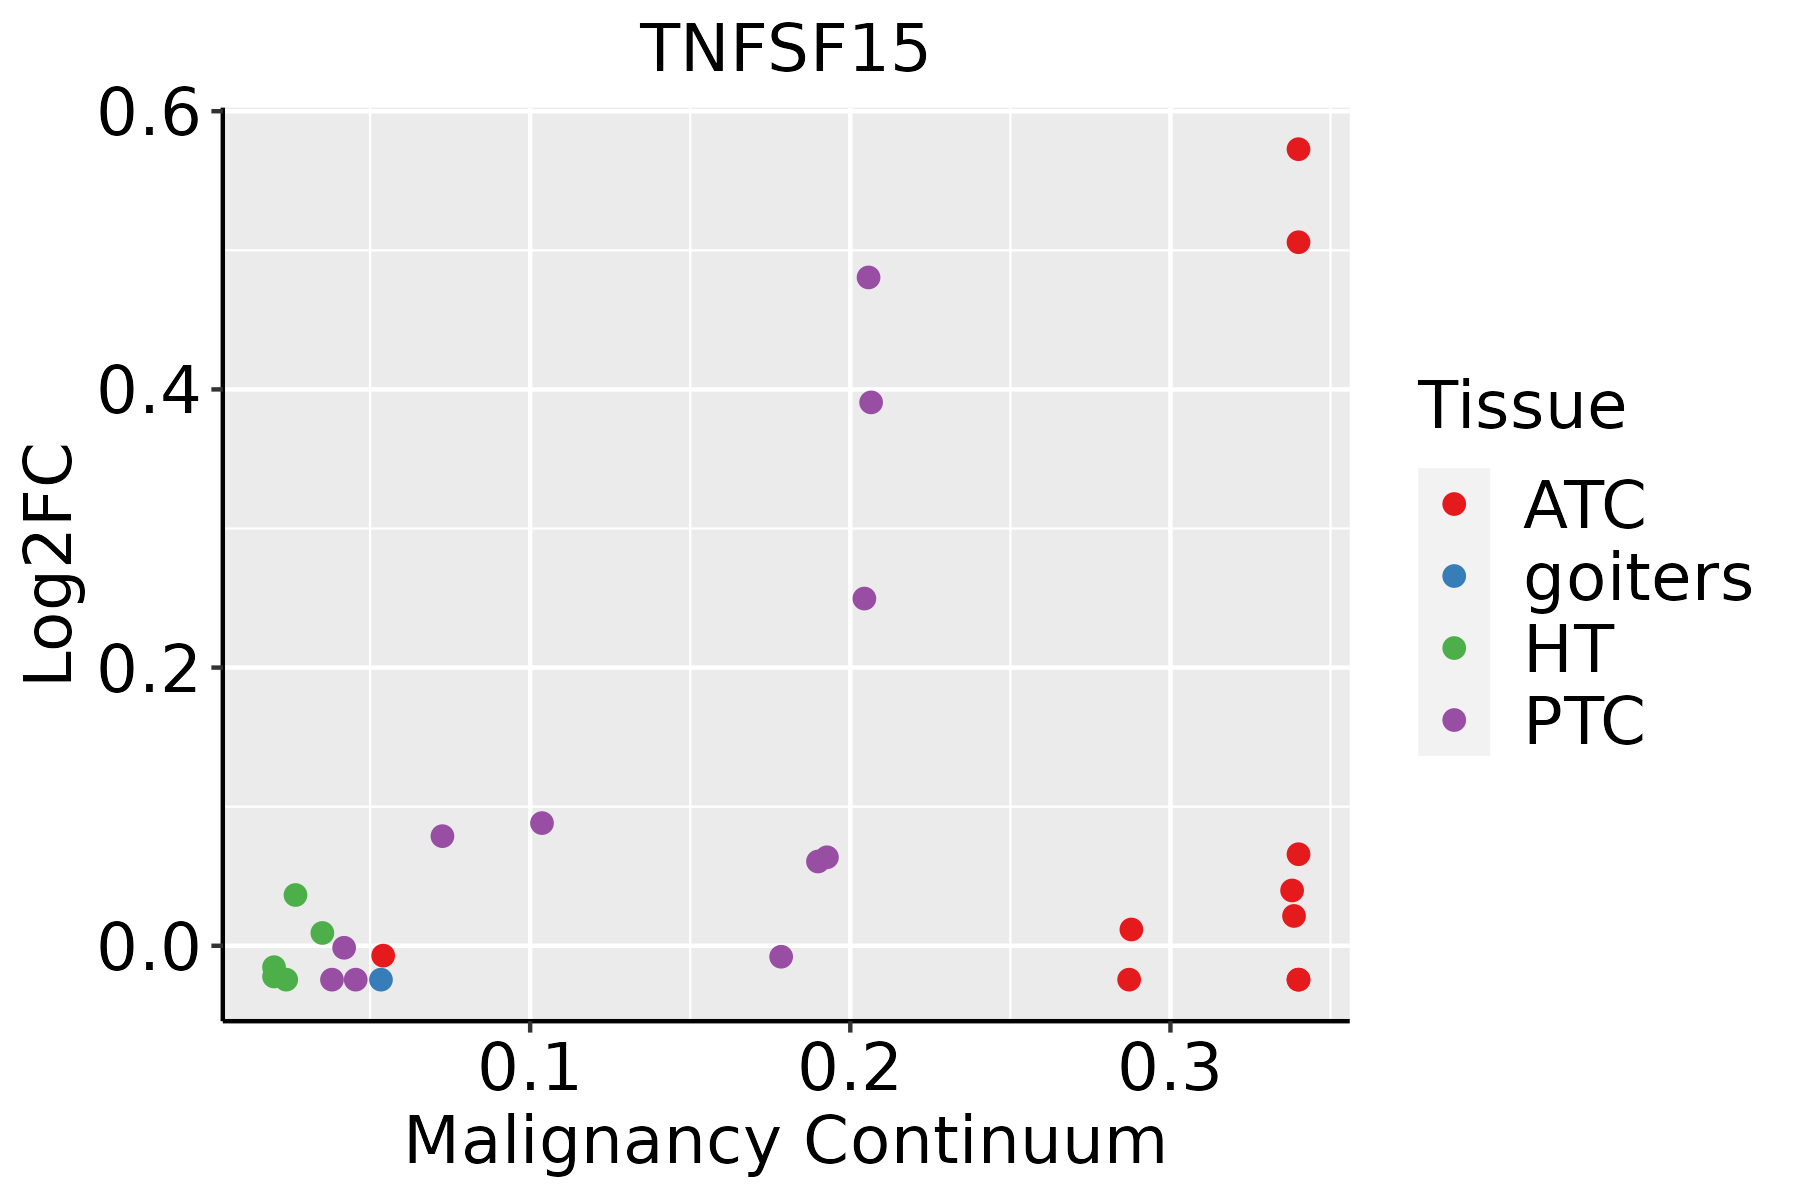 | ATC: Anaplastic thyroid cancer |
| HT: Hashimoto's thyroiditis | ||
| PTC: Papillary thyroid cancer |
| ∗log2FC in expression of this searched gene in stem-like cells from each diseased tissue sample relative to stem-like cells in normal samples in each tissue plotted against the malignancy continuum. Samples are colored based on if they are from different disease stage. |
Top |
Malignant transformation related pathway analysis |
| Find out the enriched GO biological processes and KEGG pathways involved in transition from healthy to precancer to cancer |
| Tissue | Disease Stage | Enriched GO biological Processes |
| Colorectum | AD |  |
| Colorectum | SER |  |
| Colorectum | MSS |  |
| Colorectum | MSI-H |  |
| Colorectum | FAP |  |
| ∗Top 15 enriched GO BP terms are showed in the bar plot of each disease state in each tissue. Each row represents a significant GO biological process which is colored according to the -log10(p.adjust). |
| Page: 1 2 3 4 5 6 7 8 9 |
| GO ID | Tissue | Disease Stage | Description | Gene Ratio | Bg Ratio | pvalue | p.adjust | Count |
| GO:004586222 | Liver | HCC | positive regulation of proteolysis | 232/7958 | 372/18723 | 5.66e-15 | 3.98e-13 | 232 |
| GO:004328112 | Liver | HCC | regulation of cysteine-type endopeptidase activity involved in apoptotic process | 125/7958 | 209/18723 | 3.12e-07 | 5.42e-06 | 125 |
| GO:200011612 | Liver | HCC | regulation of cysteine-type endopeptidase activity | 137/7958 | 235/18723 | 6.91e-07 | 1.08e-05 | 137 |
| GO:005254722 | Liver | HCC | regulation of peptidase activity | 247/7958 | 461/18723 | 8.28e-07 | 1.27e-05 | 247 |
| GO:005254822 | Liver | HCC | regulation of endopeptidase activity | 230/7958 | 432/18723 | 3.58e-06 | 4.68e-05 | 230 |
| GO:001095212 | Liver | HCC | positive regulation of peptidase activity | 110/7958 | 197/18723 | 1.04e-04 | 8.98e-04 | 110 |
| GO:004586021 | Liver | HCC | positive regulation of protein kinase activity | 194/7958 | 386/18723 | 1.16e-03 | 6.54e-03 | 194 |
| GO:001095012 | Liver | HCC | positive regulation of endopeptidase activity | 96/7958 | 179/18723 | 1.68e-03 | 8.79e-03 | 96 |
| GO:003367411 | Liver | HCC | positive regulation of kinase activity | 230/7958 | 467/18723 | 1.72e-03 | 8.95e-03 | 230 |
| GO:00380611 | Liver | HCC | NIK/NF-kappaB signaling | 77/7958 | 143/18723 | 3.98e-03 | 1.76e-02 | 77 |
| GO:004328012 | Liver | HCC | positive regulation of cysteine-type endopeptidase activity involved in apoptotic process | 70/7958 | 129/18723 | 4.58e-03 | 1.97e-02 | 70 |
| GO:200105612 | Liver | HCC | positive regulation of cysteine-type endopeptidase activity | 79/7958 | 148/18723 | 4.82e-03 | 2.03e-02 | 79 |
| GO:00321471 | Liver | HCC | activation of protein kinase activity | 72/7958 | 134/18723 | 5.61e-03 | 2.33e-02 | 72 |
| GO:0045862113 | Thyroid | PTC | positive regulation of proteolysis | 198/5968 | 372/18723 | 6.68e-18 | 6.91e-16 | 198 |
| GO:0045860111 | Thyroid | PTC | positive regulation of protein kinase activity | 176/5968 | 386/18723 | 8.89e-09 | 2.17e-07 | 176 |
| GO:0033674111 | Thyroid | PTC | positive regulation of kinase activity | 201/5968 | 467/18723 | 1.95e-07 | 3.54e-06 | 201 |
| GO:0043281113 | Thyroid | PTC | regulation of cysteine-type endopeptidase activity involved in apoptotic process | 99/5968 | 209/18723 | 1.93e-06 | 2.64e-05 | 99 |
| GO:0010952113 | Thyroid | PTC | positive regulation of peptidase activity | 94/5968 | 197/18723 | 2.34e-06 | 3.11e-05 | 94 |
| GO:2000116113 | Thyroid | PTC | regulation of cysteine-type endopeptidase activity | 108/5968 | 235/18723 | 3.99e-06 | 4.99e-05 | 108 |
| GO:0052547113 | Thyroid | PTC | regulation of peptidase activity | 191/5968 | 461/18723 | 7.82e-06 | 9.02e-05 | 191 |
| Page: 1 2 3 |
| Pathway ID | Tissue | Disease Stage | Description | Gene Ratio | Bg Ratio | pvalue | p.adjust | qvalue | Count |
| Page: 1 |
Top |
Cell-cell communication analysis |
| Identification of potential cell-cell interactions between two cell types and their ligand-receptor pairs for different disease states |
| Ligand | Receptor | LRpair | Pathway | Tissue | Disease Stage |
| TNFSF15 | TNFRSF25 | TNFSF15_TNFRSF25 | VEGI | THCA | Cancer |
| Page: 1 |
Top |
Single-cell gene regulatory network inference analysis |
| Find out the significant the regulons (TFs) and the target genes of each regulon across cell types for different disease states |
| TF | Cell Type | Tissue | Disease Stage | Target Gene | RSS | Regulon Activity |
| ∗The dot plots of a searched regulon are shown for all cell subpopulations in each disease state of each tissue based on the regulon specific score inferred using pySCENIC and by calculating the average expression. |
| Page: 1 |
Top |
Somatic mutation of malignant transformation related genes |
| Annotation of somatic variants for genes involved in malignant transformation |
| Hugo Symbol | Variant Class | Variant Classification | dbSNP RS | HGVSc | HGVSp | HGVSp Short | SWISSPROT | BIOTYPE | SIFT | PolyPhen | Tumor Sample Barcode | Tissue | Histology | Sex | Age | Stage | Therapy Types | Drugs | Outcome |
| TNFSF15 | SNV | Missense_Mutation | c.735N>A | p.Phe245Leu | p.F245L | O95150 | protein_coding | deleterious(0) | probably_damaging(0.998) | TCGA-AN-A046-01 | Breast | breast invasive carcinoma | Female | >=65 | I/II | Unknown | Unknown | SD | |
| TNFSF15 | insertion | Nonsense_Mutation | novel | c.458_459insATTAAGATGGGTTGGAGGATTGGCGAGTTTCTAAATATTAAGA | p.Thr154LeufsTer11 | p.T154Lfs*11 | O95150 | protein_coding | TCGA-A2-A0CP-01 | Breast | breast invasive carcinoma | Female | <65 | I/II | Chemotherapy | cytoxan | SD | ||
| TNFSF15 | insertion | Frame_Shift_Ins | novel | c.513_514insGAAAACAGTATAAACTTTCAGAGGCAAAATCCTTCACCAATTTTTC | p.Asn172GlufsTer34 | p.N172Efs*34 | O95150 | protein_coding | TCGA-BH-A0HF-01 | Breast | breast invasive carcinoma | Female | >=65 | I/II | Hormone Therapy | arimidex | SD | ||
| TNFSF15 | SNV | Missense_Mutation | novel | c.247N>A | p.Gln83Lys | p.Q83K | O95150 | protein_coding | tolerated(0.7) | benign(0.001) | TCGA-ZX-AA5X-01 | Cervix | cervical & endocervical cancer | Female | <65 | III/IV | Unknown | Unknown | SD |
| TNFSF15 | SNV | Missense_Mutation | c.596N>C | p.Lys199Thr | p.K199T | O95150 | protein_coding | deleterious(0) | probably_damaging(1) | TCGA-AA-3854-01 | Colorectum | colon adenocarcinoma | Female | >=65 | I/II | Unknown | Unknown | SD | |
| TNFSF15 | SNV | Missense_Mutation | c.419N>G | p.Leu140Arg | p.L140R | O95150 | protein_coding | deleterious(0) | benign(0.129) | TCGA-AA-3864-01 | Colorectum | colon adenocarcinoma | Male | >=65 | I/II | Unknown | Unknown | SD | |
| TNFSF15 | SNV | Missense_Mutation | rs368084272 | c.431C>T | p.Ser144Leu | p.S144L | O95150 | protein_coding | deleterious(0.01) | benign(0.438) | TCGA-AA-3984-01 | Colorectum | colon adenocarcinoma | Female | <65 | I/II | Unknown | Unknown | SD |
| TNFSF15 | SNV | Missense_Mutation | rs773380295 | c.336N>A | p.Asn112Lys | p.N112K | O95150 | protein_coding | deleterious(0.01) | benign(0.04) | TCGA-AG-A00Y-01 | Colorectum | rectum adenocarcinoma | Male | >=65 | I/II | Unknown | Unknown | PD |
| TNFSF15 | SNV | Missense_Mutation | novel | c.580N>A | p.Leu194Ile | p.L194I | O95150 | protein_coding | tolerated(0.07) | probably_damaging(0.998) | TCGA-A5-A0G1-01 | Endometrium | uterine corpus endometrioid carcinoma | Female | >=65 | I/II | Unknown | Unknown | SD |
| TNFSF15 | SNV | Missense_Mutation | novel | c.742N>T | p.Ala248Ser | p.A248S | O95150 | protein_coding | deleterious(0.01) | probably_damaging(0.999) | TCGA-A5-A1OF-01 | Endometrium | uterine corpus endometrioid carcinoma | Female | <65 | I/II | Unknown | Unknown | SD |
| Page: 1 2 3 |
Top |
Related drugs of malignant transformation related genes |
| Identification of chemicals and drugs interact with genes involved in malignant transfromation |
| (DGIdb 4.0) |
| Entrez ID | Symbol | Category | Interaction Types | Drug Claim Name | Drug Name | PMIDs |
| Page: 1 |

Copyright 2023-Present -The University of Texas Health Science Center at Houston |