
|
|||||
|
 | |
| |
| |
| |
| |
| |
|
Gene: TNFSF13B |
Gene summary for TNFSF13B |
| Gene information | Species | Human | Gene symbol | TNFSF13B | Gene ID | 10673 |
| Gene name | TNF superfamily member 13b | |
| Gene Alias | BAFF | |
| Cytomap | 13q33.3 | |
| Gene Type | protein-coding | GO ID | GO:0001775 | UniProtAcc | Q9Y275 |
Top |
Malignant transformation analysis |
| Identification of the aberrant gene expression in precancerous and cancerous lesions by comparing the gene expression of stem-like cells in diseased tissues with normal stem cells |
| Entrez ID | Symbol | Replicates | Species | Organ | Tissue | Adj P-value | Log2FC | Malignancy |
| 10673 | TNFSF13B | C04 | Human | Oral cavity | OSCC | 6.44e-03 | 2.22e-01 | 0.2633 |
| 10673 | TNFSF13B | C21 | Human | Oral cavity | OSCC | 1.22e-06 | 4.74e-01 | 0.2678 |
| 10673 | TNFSF13B | C30 | Human | Oral cavity | OSCC | 1.60e-13 | 6.84e-01 | 0.3055 |
| 10673 | TNFSF13B | C38 | Human | Oral cavity | OSCC | 1.22e-03 | 6.37e-01 | 0.172 |
| 10673 | TNFSF13B | C46 | Human | Oral cavity | OSCC | 3.51e-02 | 1.97e-01 | 0.1673 |
| 10673 | TNFSF13B | C06 | Human | Oral cavity | OSCC | 3.37e-06 | 1.10e+00 | 0.2699 |
| 10673 | TNFSF13B | LN46 | Human | Oral cavity | OSCC | 9.10e-08 | 1.24e+00 | 0.1666 |
| 10673 | TNFSF13B | NEOLP-1 | Human | Oral cavity | NEOLP | 4.47e-02 | 1.48e-01 | -0.0194 |
| 10673 | TNFSF13B | SYSMH2 | Human | Oral cavity | OSCC | 2.47e-03 | 1.73e-01 | 0.2326 |
| Page: 1 |
| Tissue | Expression Dynamics | Abbreviation |
| Oral Cavity | 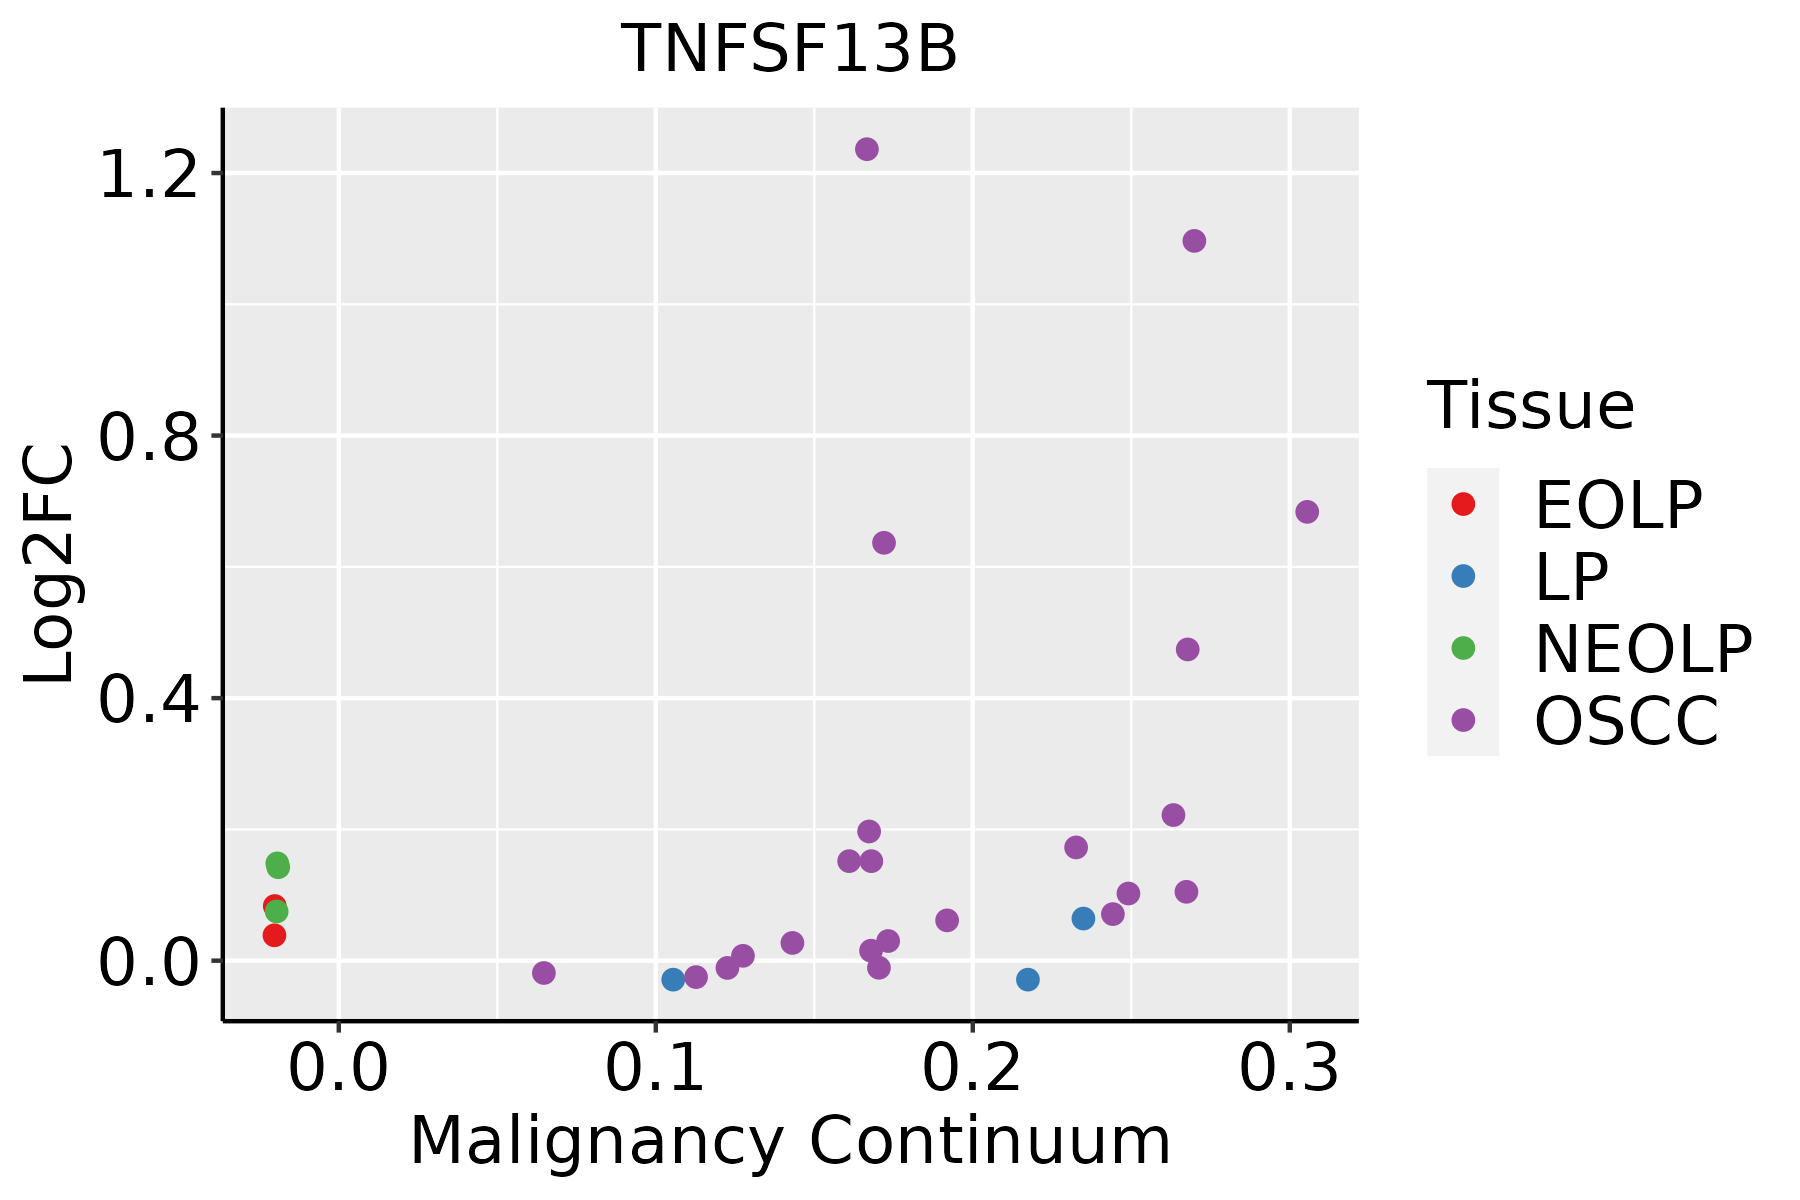 | EOLP: Erosive Oral lichen planus |
| LP: leukoplakia | ||
| NEOLP: Non-erosive oral lichen planus | ||
| OSCC: Oral squamous cell carcinoma |
| ∗log2FC in expression of this searched gene in stem-like cells from each diseased tissue sample relative to stem-like cells in normal samples in each tissue plotted against the malignancy continuum. Samples are colored based on if they are from different disease stage. |
Top |
Malignant transformation related pathway analysis |
| Find out the enriched GO biological processes and KEGG pathways involved in transition from healthy to precancer to cancer |
| Tissue | Disease Stage | Enriched GO biological Processes |
| Colorectum | AD |  |
| Colorectum | SER |  |
| Colorectum | MSS |  |
| Colorectum | MSI-H |  |
| Colorectum | FAP |  |
| ∗Top 15 enriched GO BP terms are showed in the bar plot of each disease state in each tissue. Each row represents a significant GO biological process which is colored according to the -log10(p.adjust). |
| Page: 1 2 3 4 5 6 7 8 9 |
| GO ID | Tissue | Disease Stage | Description | Gene Ratio | Bg Ratio | pvalue | p.adjust | Count |
| GO:004887220 | Oral cavity | OSCC | homeostasis of number of cells | 152/7305 | 272/18723 | 1.08e-08 | 2.23e-07 | 152 |
| GO:003461218 | Oral cavity | OSCC | response to tumor necrosis factor | 143/7305 | 253/18723 | 1.09e-08 | 2.23e-07 | 143 |
| GO:004578520 | Oral cavity | OSCC | positive regulation of cell adhesion | 225/7305 | 437/18723 | 6.06e-08 | 1.09e-06 | 225 |
| GO:007135618 | Oral cavity | OSCC | cellular response to tumor necrosis factor | 128/7305 | 229/18723 | 1.49e-07 | 2.49e-06 | 128 |
| GO:004211016 | Oral cavity | OSCC | T cell activation | 245/7305 | 487/18723 | 2.00e-07 | 3.22e-06 | 245 |
| GO:00332099 | Oral cavity | OSCC | tumor necrosis factor-mediated signaling pathway | 61/7305 | 99/18723 | 4.31e-06 | 4.98e-05 | 61 |
| GO:19031316 | Oral cavity | OSCC | mononuclear cell differentiation | 210/7305 | 426/18723 | 8.44e-06 | 9.02e-05 | 210 |
| GO:002240718 | Oral cavity | OSCC | regulation of cell-cell adhesion | 218/7305 | 448/18723 | 1.71e-05 | 1.68e-04 | 218 |
| GO:005086315 | Oral cavity | OSCC | regulation of T cell activation | 161/7305 | 329/18723 | 1.44e-04 | 1.02e-03 | 161 |
| GO:00192214 | Oral cavity | OSCC | cytokine-mediated signaling pathway | 222/7305 | 472/18723 | 2.02e-04 | 1.35e-03 | 222 |
| GO:000715916 | Oral cavity | OSCC | leukocyte cell-cell adhesion | 178/7305 | 371/18723 | 2.44e-04 | 1.57e-03 | 178 |
| GO:00300983 | Oral cavity | OSCC | lymphocyte differentiation | 179/7305 | 374/18723 | 2.74e-04 | 1.74e-03 | 179 |
| GO:190303715 | Oral cavity | OSCC | regulation of leukocyte cell-cell adhesion | 162/7305 | 336/18723 | 3.39e-04 | 2.08e-03 | 162 |
| GO:004209816 | Oral cavity | OSCC | T cell proliferation | 100/7305 | 199/18723 | 7.93e-04 | 4.27e-03 | 100 |
| GO:002240917 | Oral cavity | OSCC | positive regulation of cell-cell adhesion | 136/7305 | 284/18723 | 1.35e-03 | 6.62e-03 | 136 |
| GO:0001776 | Oral cavity | OSCC | leukocyte homeostasis | 48/7305 | 87/18723 | 1.60e-03 | 7.62e-03 | 48 |
| GO:190303910 | Oral cavity | OSCC | positive regulation of leukocyte cell-cell adhesion | 115/7305 | 239/18723 | 2.48e-03 | 1.09e-02 | 115 |
| GO:005087010 | Oral cavity | OSCC | positive regulation of T cell activation | 104/7305 | 216/18723 | 3.76e-03 | 1.55e-02 | 104 |
| GO:00706618 | Oral cavity | OSCC | leukocyte proliferation | 145/7305 | 318/18723 | 9.31e-03 | 3.33e-02 | 145 |
| GO:00466517 | Oral cavity | OSCC | lymphocyte proliferation | 131/7305 | 288/18723 | 1.41e-02 | 4.67e-02 | 131 |
| Page: 1 2 3 |
| Pathway ID | Tissue | Disease Stage | Description | Gene Ratio | Bg Ratio | pvalue | p.adjust | qvalue | Count |
| hsa040644 | Oral cavity | OSCC | NF-kappa B signaling pathway | 67/3704 | 104/8465 | 1.57e-05 | 6.75e-05 | 3.44e-05 | 67 |
| hsa0532318 | Oral cavity | OSCC | Rheumatoid arthritis | 56/3704 | 93/8465 | 9.72e-04 | 2.76e-03 | 1.40e-03 | 56 |
| hsa0406411 | Oral cavity | OSCC | NF-kappa B signaling pathway | 67/3704 | 104/8465 | 1.57e-05 | 6.75e-05 | 3.44e-05 | 67 |
| hsa0532319 | Oral cavity | OSCC | Rheumatoid arthritis | 56/3704 | 93/8465 | 9.72e-04 | 2.76e-03 | 1.40e-03 | 56 |
| Page: 1 |
Top |
Cell-cell communication analysis |
| Identification of potential cell-cell interactions between two cell types and their ligand-receptor pairs for different disease states |
| Ligand | Receptor | LRpair | Pathway | Tissue | Disease Stage |
| TNFSF13B | TNFRSF17 | TNFSF13B_TNFRSF17 | BAFF | Breast | DCIS |
| TNFSF13B | TNFRSF13B | TNFSF13B_TNFRSF13B | BAFF | Breast | DCIS |
| TNFSF13B | TNFRSF13C | TNFSF13B_TNFRSF13C | BAFF | Breast | DCIS |
| TNFSF13B | TNFRSF17 | TNFSF13B_TNFRSF17 | BAFF | Breast | Healthy |
| TNFSF13B | TNFRSF13C | TNFSF13B_TNFRSF13C | BAFF | Breast | Healthy |
| TNFSF13B | TNFRSF17 | TNFSF13B_TNFRSF17 | BAFF | Breast | IDC |
| TNFSF13B | TNFRSF13C | TNFSF13B_TNFRSF13C | BAFF | Breast | IDC |
| TNFSF13B | TNFRSF13C | TNFSF13B_TNFRSF13C | BAFF | Cervix | ADJ |
| TNFSF13B | TNFRSF13B | TNFSF13B_TNFRSF13B | BAFF | Cervix | CC |
| TNFSF13B | TNFRSF13C | TNFSF13B_TNFRSF13C | BAFF | Cervix | CC |
| TNFSF13B | TNFRSF13B | TNFSF13B_TNFRSF13B | BAFF | Cervix | Healthy |
| TNFSF13B | TNFRSF13C | TNFSF13B_TNFRSF13C | BAFF | Cervix | Healthy |
| TNFSF13B | TNFRSF13B | TNFSF13B_TNFRSF13B | BAFF | Cervix | Precancer |
| TNFSF13B | TNFRSF13C | TNFSF13B_TNFRSF13C | BAFF | Cervix | Precancer |
| TNFSF13B | TNFRSF17 | TNFSF13B_TNFRSF17 | BAFF | CRC | MSI-H |
| TNFSF13B | TNFRSF13C | TNFSF13B_TNFRSF13C | BAFF | CRC | MSI-H |
| TNFSF13B | TNFRSF17 | TNFSF13B_TNFRSF17 | BAFF | CRC | SER |
| TNFSF13B | TNFRSF13C | TNFSF13B_TNFRSF13C | BAFF | CRC | SER |
| TNFSF13B | TNFRSF13B | TNFSF13B_TNFRSF13B | BAFF | Endometrium | ADJ |
| TNFSF13B | TNFRSF13C | TNFSF13B_TNFRSF13C | BAFF | Endometrium | ADJ |
| Page: 1 2 3 4 |
Top |
Single-cell gene regulatory network inference analysis |
| Find out the significant the regulons (TFs) and the target genes of each regulon across cell types for different disease states |
| TF | Cell Type | Tissue | Disease Stage | Target Gene | RSS | Regulon Activity |
| ∗The dot plots of a searched regulon are shown for all cell subpopulations in each disease state of each tissue based on the regulon specific score inferred using pySCENIC and by calculating the average expression. |
| Page: 1 |
Top |
Somatic mutation of malignant transformation related genes |
| Annotation of somatic variants for genes involved in malignant transformation |
| Hugo Symbol | Variant Class | Variant Classification | dbSNP RS | HGVSc | HGVSp | HGVSp Short | SWISSPROT | BIOTYPE | SIFT | PolyPhen | Tumor Sample Barcode | Tissue | Histology | Sex | Age | Stage | Therapy Types | Drugs | Outcome |
| TNFSF13B | SNV | Missense_Mutation | c.281G>A | p.Gly94Glu | p.G94E | Q9Y275 | protein_coding | tolerated(0.64) | benign(0) | TCGA-BH-A18P-01 | Breast | breast invasive carcinoma | Female | <65 | I/II | Unknown | Unknown | PD | |
| TNFSF13B | insertion | In_Frame_Ins | novel | c.198_199insACATTAATTATTTTTATGACAGCAGCAGGAACTTTCAGCTGCTTT | p.Phe66_Tyr67insThrLeuIleIlePheMetThrAlaAlaGlyThrPheSerCysPhe | p.F66_Y67insTLIIFMTAAGTFSCF | Q9Y275 | protein_coding | TCGA-AO-A0JB-01 | Breast | breast invasive carcinoma | Female | <65 | III/IV | Chemotherapy | cyclophosphamide | SD | ||
| TNFSF13B | SNV | Missense_Mutation | novel | c.181N>A | p.Leu61Ile | p.L61I | Q9Y275 | protein_coding | deleterious(0.04) | benign(0.368) | TCGA-5M-AAT6-01 | Colorectum | colon adenocarcinoma | Female | <65 | III/IV | Unknown | Unknown | PD |
| TNFSF13B | SNV | Missense_Mutation | novel | c.477N>C | p.Gln159His | p.Q159H | Q9Y275 | protein_coding | tolerated(0.07) | benign(0.003) | TCGA-AG-3726-01 | Colorectum | rectum adenocarcinoma | Female | <65 | I/II | Unknown | Unknown | SD |
| TNFSF13B | SNV | Missense_Mutation | novel | c.62A>G | p.Glu21Gly | p.E21G | Q9Y275 | protein_coding | deleterious_low_confidence(0) | possibly_damaging(0.494) | TCGA-AG-A002-01 | Colorectum | rectum adenocarcinoma | Male | <65 | I/II | Unknown | Unknown | SD |
| TNFSF13B | SNV | Missense_Mutation | c.80G>A | p.Cys27Tyr | p.C27Y | Q9Y275 | protein_coding | tolerated_low_confidence(0.06) | benign(0) | TCGA-AG-A00Y-01 | Colorectum | rectum adenocarcinoma | Male | >=65 | I/II | Unknown | Unknown | PD | |
| TNFSF13B | SNV | Missense_Mutation | novel | c.586T>C | p.Tyr196His | p.Y196H | Q9Y275 | protein_coding | deleterious(0) | probably_damaging(0.986) | TCGA-F5-6814-01 | Colorectum | rectum adenocarcinoma | Male | <65 | I/II | Unknown | Unknown | SD |
| TNFSF13B | deletion | Frame_Shift_Del | c.34_37delNNNN | p.Thr13LeufsTer9 | p.T13Lfs*9 | Q9Y275 | protein_coding | TCGA-AA-3811-01 | Colorectum | colon adenocarcinoma | Female | >=65 | III/IV | Unknown | Unknown | PD | |||
| TNFSF13B | SNV | Missense_Mutation | novel | c.803N>T | p.Ala268Val | p.A268V | Q9Y275 | protein_coding | deleterious(0) | probably_damaging(0.999) | TCGA-AJ-A3EK-01 | Endometrium | uterine corpus endometrioid carcinoma | Female | <65 | I/II | Chemotherapy | carboplatin | CR |
| TNFSF13B | SNV | Missense_Mutation | novel | c.389G>T | p.Arg130Ile | p.R130I | Q9Y275 | protein_coding | deleterious(0) | possibly_damaging(0.689) | TCGA-AJ-A5DW-01 | Endometrium | uterine corpus endometrioid carcinoma | Female | <65 | I/II | Unknown | Unknown | SD |
| Page: 1 2 3 4 |
Top |
Related drugs of malignant transformation related genes |
| Identification of chemicals and drugs interact with genes involved in malignant transfromation |
| (DGIdb 4.0) |
| Entrez ID | Symbol | Category | Interaction Types | Drug Claim Name | Drug Name | PMIDs |
| 10673 | TNFSF13B | DRUGGABLE GENOME, TRANSCRIPTION FACTOR | Belimumab | BELIMUMAB | ||
| 10673 | TNFSF13B | DRUGGABLE GENOME, TRANSCRIPTION FACTOR | BLISIBIMOD | BLISIBIMOD | ||
| 10673 | TNFSF13B | DRUGGABLE GENOME, TRANSCRIPTION FACTOR | LY2127399 | |||
| 10673 | TNFSF13B | DRUGGABLE GENOME, TRANSCRIPTION FACTOR | inhibitor | CHEMBL2107877 | BLISIBIMOD | |
| 10673 | TNFSF13B | DRUGGABLE GENOME, TRANSCRIPTION FACTOR | inhibitor | CHEMBL1743075 | TABALUMAB | |
| 10673 | TNFSF13B | DRUGGABLE GENOME, TRANSCRIPTION FACTOR | belimumab | BELIMUMAB | ||
| 10673 | TNFSF13B | DRUGGABLE GENOME, TRANSCRIPTION FACTOR | Tabalumab | TABALUMAB | ||
| 10673 | TNFSF13B | DRUGGABLE GENOME, TRANSCRIPTION FACTOR | TACI-IG | ATACICEPT | ||
| 10673 | TNFSF13B | DRUGGABLE GENOME, TRANSCRIPTION FACTOR | BELIMUMAB | BELIMUMAB | ||
| 10673 | TNFSF13B | DRUGGABLE GENOME, TRANSCRIPTION FACTOR | AUTOANTIGEN | 15084273 |
| Page: 1 2 |

Copyright 2023-Present -The University of Texas Health Science Center at Houston |