
|
|||||
|
 | |
| |
| |
| |
| |
| |
|
Gene: TNFSF13 |
Gene summary for TNFSF13 |
| Gene information | Species | Human | Gene symbol | TNFSF13 | Gene ID | 8741 |
| Gene name | TNF superfamily member 13 | |
| Gene Alias | APRIL | |
| Cytomap | 17p13.1 | |
| Gene Type | protein-coding | GO ID | GO:0000018 | UniProtAcc | Q2QBA2 |
Top |
Malignant transformation analysis |
| Identification of the aberrant gene expression in precancerous and cancerous lesions by comparing the gene expression of stem-like cells in diseased tissues with normal stem cells |
| Entrez ID | Symbol | Replicates | Species | Organ | Tissue | Adj P-value | Log2FC | Malignancy |
| 8741 | TNFSF13 | HTA11_3410_2000001011 | Human | Colorectum | AD | 1.75e-12 | 2.65e-01 | 0.0155 |
| 8741 | TNFSF13 | HTA11_2487_2000001011 | Human | Colorectum | SER | 2.14e-15 | 4.98e-01 | -0.1808 |
| 8741 | TNFSF13 | HTA11_1938_2000001011 | Human | Colorectum | AD | 8.58e-13 | 4.31e-01 | -0.0811 |
| 8741 | TNFSF13 | HTA11_78_2000001011 | Human | Colorectum | AD | 8.26e-09 | 3.19e-01 | -0.1088 |
| 8741 | TNFSF13 | HTA11_347_2000001011 | Human | Colorectum | AD | 2.88e-22 | 4.07e-01 | -0.1954 |
| 8741 | TNFSF13 | HTA11_411_2000001011 | Human | Colorectum | SER | 7.44e-09 | 8.79e-01 | -0.2602 |
| 8741 | TNFSF13 | HTA11_2112_2000001011 | Human | Colorectum | SER | 8.76e-08 | 4.80e-01 | -0.2196 |
| 8741 | TNFSF13 | HTA11_3361_2000001011 | Human | Colorectum | AD | 1.71e-10 | 3.09e-01 | -0.1207 |
| 8741 | TNFSF13 | HTA11_83_2000001011 | Human | Colorectum | SER | 4.95e-16 | 4.54e-01 | -0.1526 |
| 8741 | TNFSF13 | HTA11_696_2000001011 | Human | Colorectum | AD | 5.44e-33 | 6.04e-01 | -0.1464 |
| 8741 | TNFSF13 | HTA11_866_2000001011 | Human | Colorectum | AD | 7.11e-14 | 3.12e-01 | -0.1001 |
| 8741 | TNFSF13 | HTA11_1391_2000001011 | Human | Colorectum | AD | 5.57e-29 | 6.57e-01 | -0.059 |
| 8741 | TNFSF13 | HTA11_2992_2000001011 | Human | Colorectum | SER | 2.31e-08 | 3.56e-01 | -0.1706 |
| 8741 | TNFSF13 | HTA11_5212_2000001011 | Human | Colorectum | AD | 1.91e-11 | 4.96e-01 | -0.2061 |
| 8741 | TNFSF13 | HTA11_5216_2000001011 | Human | Colorectum | SER | 1.20e-12 | 6.30e-01 | -0.1462 |
| 8741 | TNFSF13 | HTA11_546_2000001011 | Human | Colorectum | AD | 1.01e-16 | 4.80e-01 | -0.0842 |
| 8741 | TNFSF13 | HTA11_7862_2000001011 | Human | Colorectum | AD | 3.08e-04 | 2.52e-01 | -0.0179 |
| 8741 | TNFSF13 | HTA11_866_3004761011 | Human | Colorectum | AD | 9.05e-12 | 3.09e-01 | 0.096 |
| 8741 | TNFSF13 | HTA11_4255_2000001011 | Human | Colorectum | SER | 3.40e-03 | 2.80e-01 | 0.0446 |
| 8741 | TNFSF13 | HTA11_8622_2000001021 | Human | Colorectum | SER | 8.37e-05 | 2.26e-01 | 0.0528 |
| Page: 1 2 3 4 |
| Tissue | Expression Dynamics | Abbreviation |
| Colorectum (GSE201348) |  | FAP: Familial adenomatous polyposis |
| CRC: Colorectal cancer | ||
| Colorectum (HTA11) | 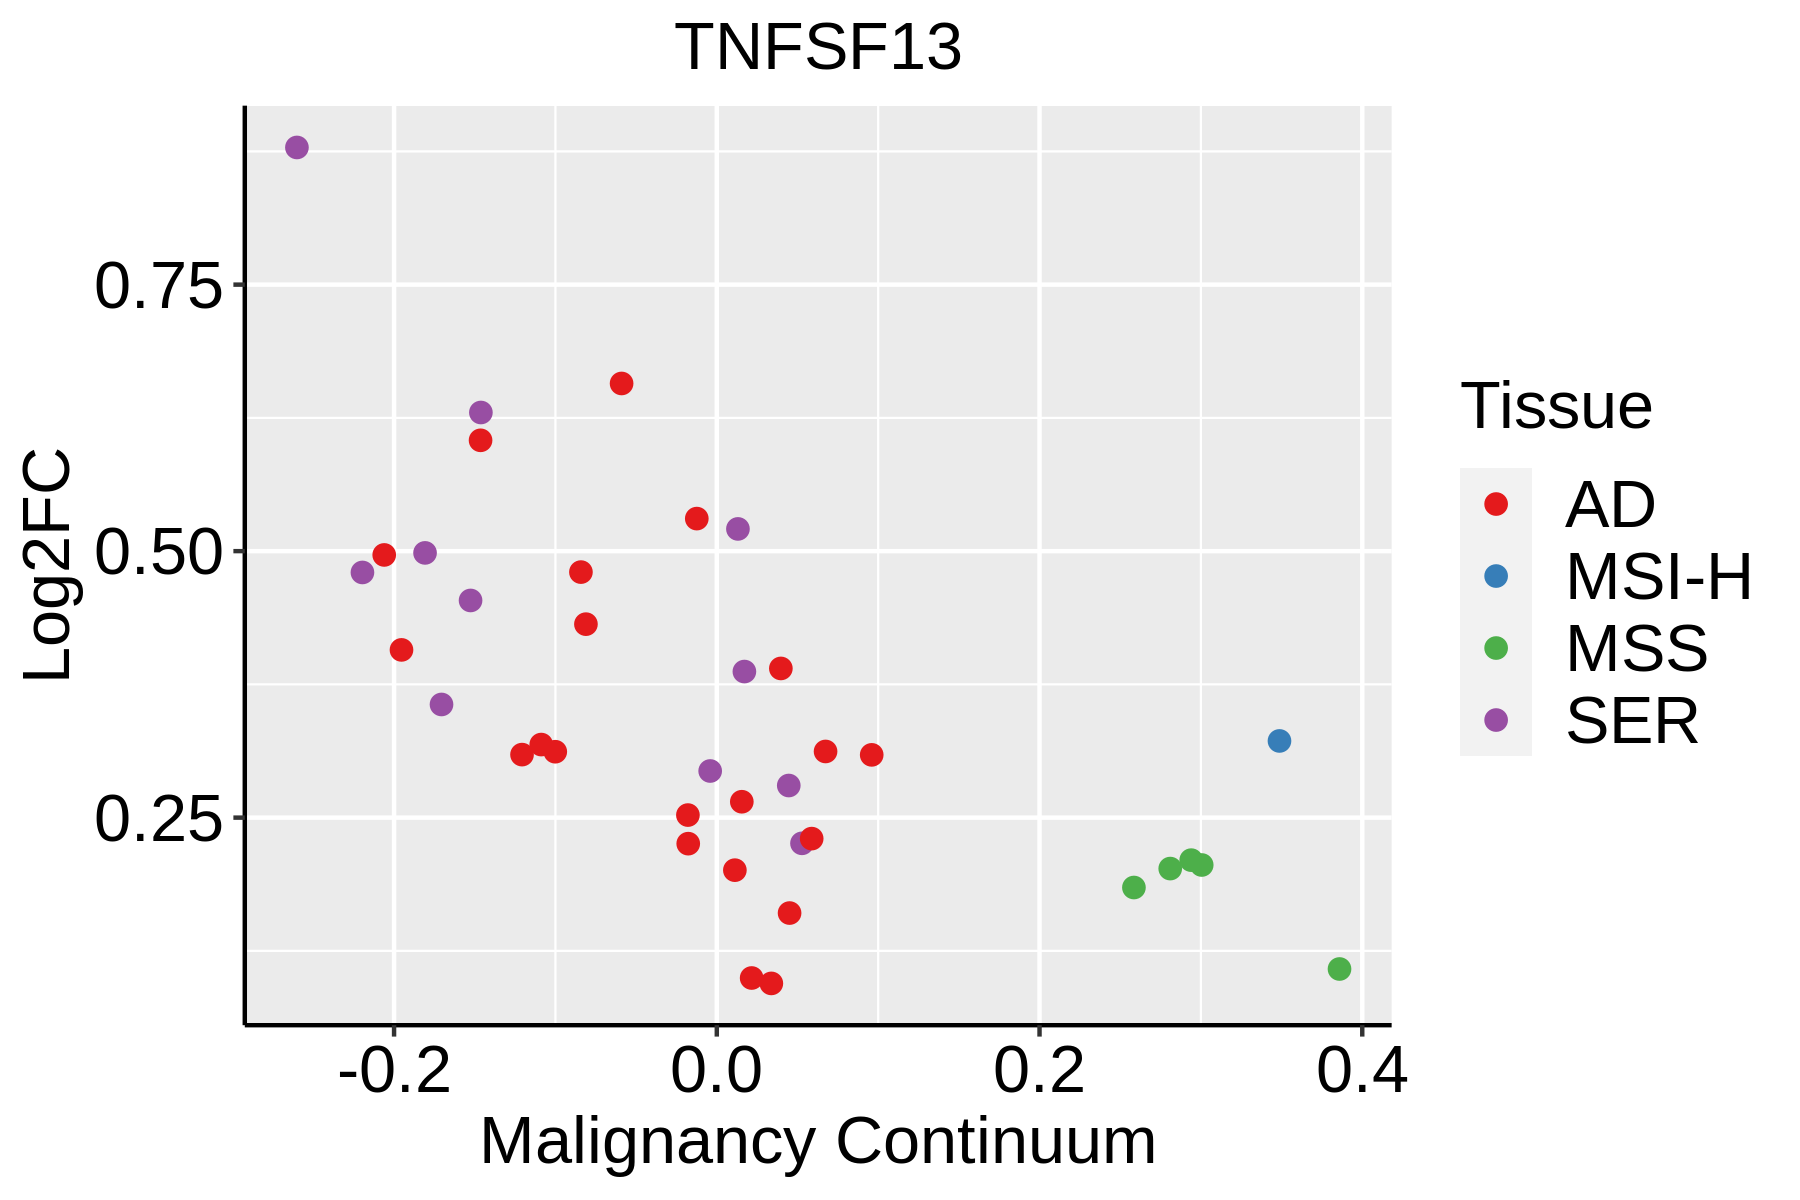 | AD: Adenomas |
| SER: Sessile serrated lesions | ||
| MSI-H: Microsatellite-high colorectal cancer | ||
| MSS: Microsatellite stable colorectal cancer | ||
| Esophagus | 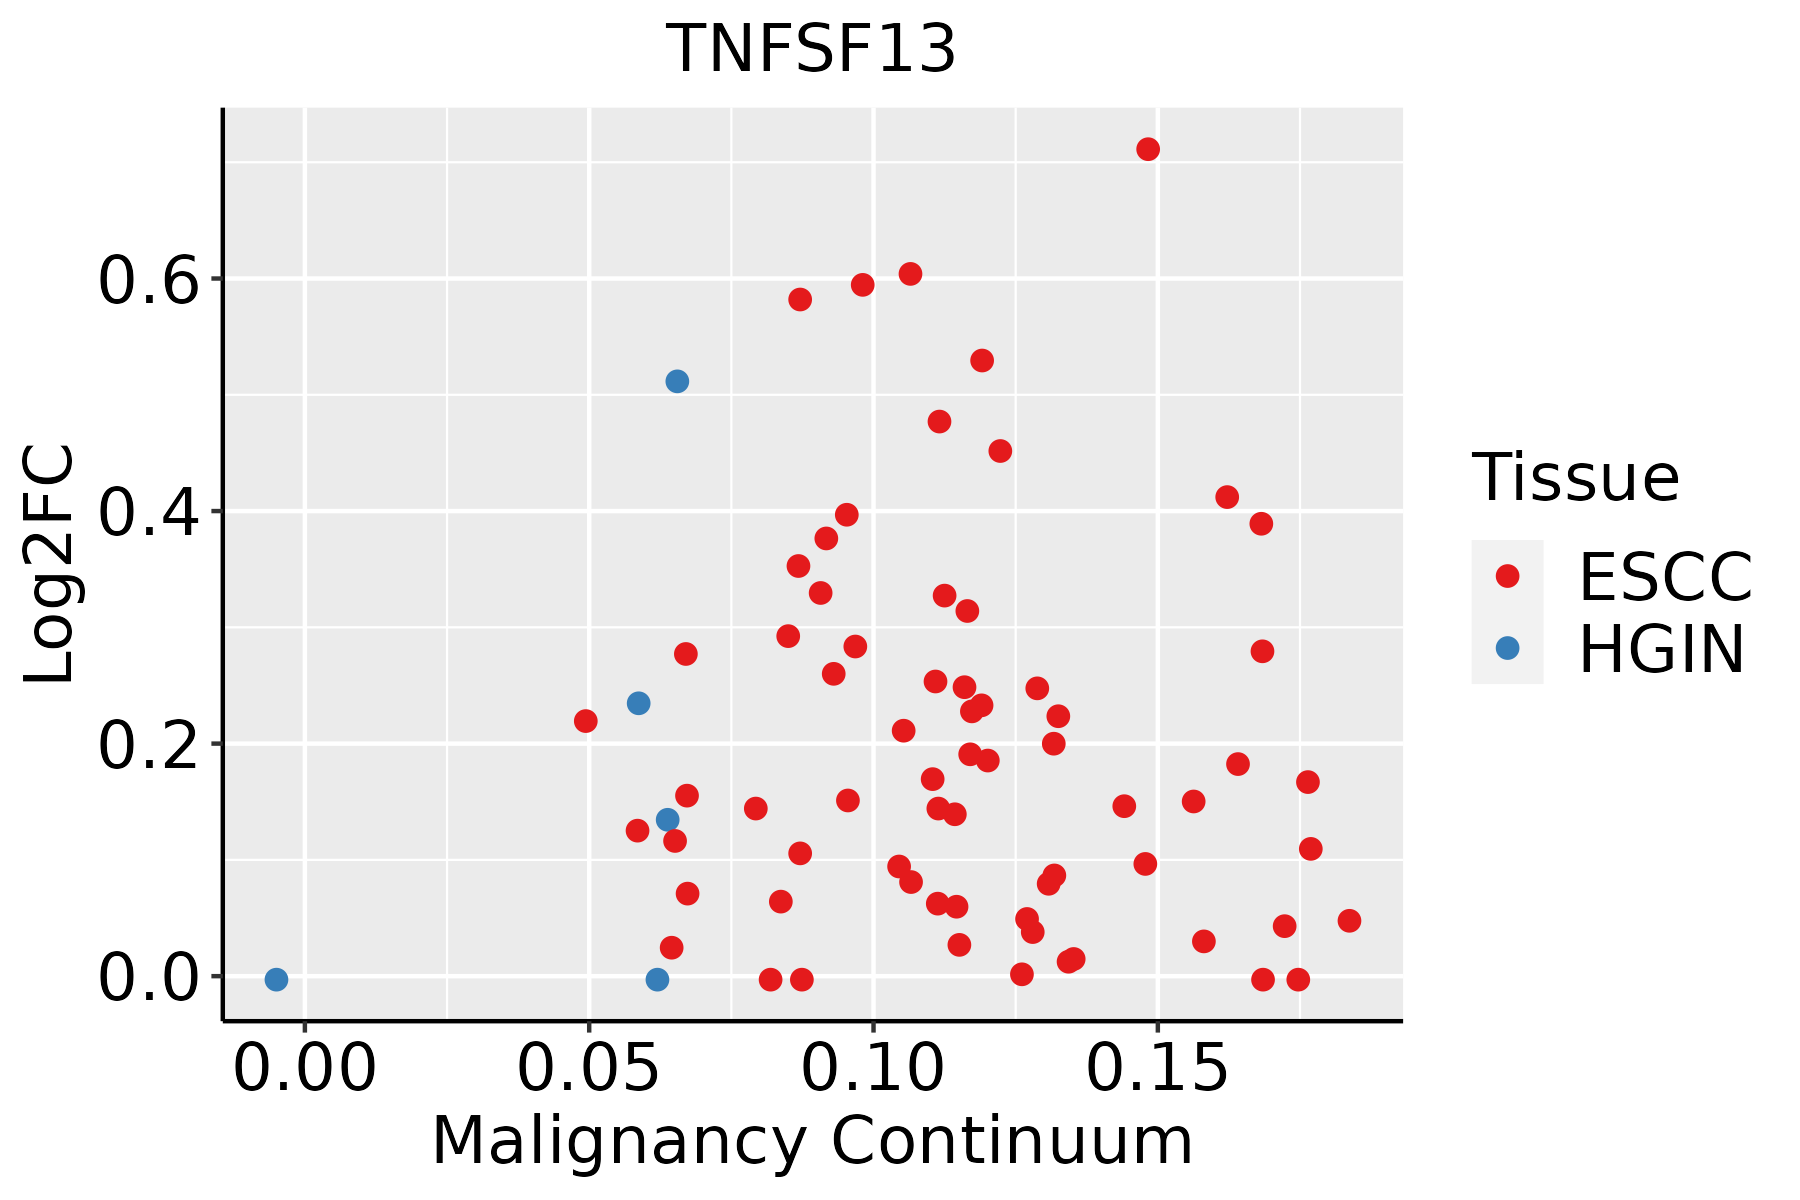 | ESCC: Esophageal squamous cell carcinoma |
| HGIN: High-grade intraepithelial neoplasias | ||
| LGIN: Low-grade intraepithelial neoplasias |
| ∗log2FC in expression of this searched gene in stem-like cells from each diseased tissue sample relative to stem-like cells in normal samples in each tissue plotted against the malignancy continuum. Samples are colored based on if they are from different disease stage. |
Top |
Malignant transformation related pathway analysis |
| Find out the enriched GO biological processes and KEGG pathways involved in transition from healthy to precancer to cancer |
| Tissue | Disease Stage | Enriched GO biological Processes |
| Colorectum | AD |  |
| Colorectum | SER |  |
| Colorectum | MSS |  |
| Colorectum | MSI-H |  |
| Colorectum | FAP |  |
| ∗Top 15 enriched GO BP terms are showed in the bar plot of each disease state in each tissue. Each row represents a significant GO biological process which is colored according to the -log10(p.adjust). |
| Page: 1 2 3 4 5 6 7 8 9 |
| GO ID | Tissue | Disease Stage | Description | Gene Ratio | Bg Ratio | pvalue | p.adjust | Count |
| GO:0051052 | Colorectum | AD | regulation of DNA metabolic process | 116/3918 | 359/18723 | 2.47e-07 | 1.00e-05 | 116 |
| GO:0051054 | Colorectum | AD | positive regulation of DNA metabolic process | 73/3918 | 201/18723 | 3.27e-07 | 1.29e-05 | 73 |
| GO:00510541 | Colorectum | SER | positive regulation of DNA metabolic process | 53/2897 | 201/18723 | 4.51e-05 | 1.13e-03 | 53 |
| GO:00510521 | Colorectum | SER | regulation of DNA metabolic process | 83/2897 | 359/18723 | 8.03e-05 | 1.77e-03 | 83 |
| GO:00510522 | Colorectum | MSS | regulation of DNA metabolic process | 108/3467 | 359/18723 | 5.86e-08 | 3.10e-06 | 108 |
| GO:00510542 | Colorectum | MSS | positive regulation of DNA metabolic process | 69/3467 | 201/18723 | 6.33e-08 | 3.26e-06 | 69 |
| GO:005105214 | Esophagus | HGIN | regulation of DNA metabolic process | 79/2587 | 359/18723 | 1.38e-05 | 3.85e-04 | 79 |
| GO:005105416 | Esophagus | HGIN | positive regulation of DNA metabolic process | 47/2587 | 201/18723 | 1.65e-04 | 3.21e-03 | 47 |
| GO:005105215 | Esophagus | ESCC | regulation of DNA metabolic process | 232/8552 | 359/18723 | 2.40e-13 | 1.13e-11 | 232 |
| GO:005105417 | Esophagus | ESCC | positive regulation of DNA metabolic process | 139/8552 | 201/18723 | 1.20e-11 | 4.33e-10 | 139 |
| GO:00063101 | Esophagus | ESCC | DNA recombination | 168/8552 | 305/18723 | 5.58e-04 | 3.05e-03 | 168 |
| GO:00025622 | Esophagus | ESCC | somatic diversification of immune receptors via germline recombination within a single locus | 43/8552 | 66/18723 | 1.10e-03 | 5.53e-03 | 43 |
| GO:00164442 | Esophagus | ESCC | somatic cell DNA recombination | 43/8552 | 66/18723 | 1.10e-03 | 5.53e-03 | 43 |
| GO:00164472 | Esophagus | ESCC | somatic recombination of immunoglobulin gene segments | 38/8552 | 57/18723 | 1.11e-03 | 5.56e-03 | 38 |
| GO:00022003 | Esophagus | ESCC | somatic diversification of immune receptors | 49/8552 | 77/18723 | 1.12e-03 | 5.60e-03 | 49 |
| GO:00164452 | Esophagus | ESCC | somatic diversification of immunoglobulins | 43/8552 | 67/18723 | 1.73e-03 | 7.97e-03 | 43 |
| GO:00023815 | Esophagus | ESCC | immunoglobulin production involved in immunoglobulin-mediated immune response | 44/8552 | 70/18723 | 2.80e-03 | 1.19e-02 | 44 |
| GO:0002204 | Esophagus | ESCC | somatic recombination of immunoglobulin genes involved in immune response | 31/8552 | 49/18723 | 9.89e-03 | 3.40e-02 | 31 |
| GO:0002208 | Esophagus | ESCC | somatic diversification of immunoglobulins involved in immune response | 31/8552 | 49/18723 | 9.89e-03 | 3.40e-02 | 31 |
| GO:0045190 | Esophagus | ESCC | isotype switching | 31/8552 | 49/18723 | 9.89e-03 | 3.40e-02 | 31 |
| Page: 1 2 3 4 |
| Pathway ID | Tissue | Disease Stage | Description | Gene Ratio | Bg Ratio | pvalue | p.adjust | qvalue | Count |
| hsa0532320 | Esophagus | ESCC | Rheumatoid arthritis | 59/4205 | 93/8465 | 4.98e-03 | 1.27e-02 | 6.52e-03 | 59 |
| hsa05323110 | Esophagus | ESCC | Rheumatoid arthritis | 59/4205 | 93/8465 | 4.98e-03 | 1.27e-02 | 6.52e-03 | 59 |
| Page: 1 |
Top |
Cell-cell communication analysis |
| Identification of potential cell-cell interactions between two cell types and their ligand-receptor pairs for different disease states |
| Ligand | Receptor | LRpair | Pathway | Tissue | Disease Stage |
| TNFSF13 | TNFRSF17 | TNFSF13_TNFRSF17 | APRIL | CRC | AD |
| TNFSF13 | TNFRSF13B | TNFSF13_TNFRSF13B | APRIL | CRC | AD |
| TNFSF13 | TNFRSF17 | TNFSF13_TNFRSF17 | APRIL | CRC | MSI-H |
| TNFSF13 | TNFRSF17 | TNFSF13_TNFRSF17 | APRIL | CRC | MSS |
| TNFSF13 | TNFRSF17 | TNFSF13_TNFRSF17 | APRIL | CRC | SER |
| TNFSF13 | TNFRSF13B | TNFSF13_TNFRSF13B | APRIL | Endometrium | ADJ |
| TNFSF13 | TNFRSF13B | TNFSF13_TNFRSF13B | APRIL | Liver | HCC |
| TNFSF13 | TNFRSF17 | TNFSF13_TNFRSF17 | APRIL | Lung | AAH |
| TNFSF13 | TNFRSF13B | TNFSF13_TNFRSF13B | APRIL | Lung | AAH |
| TNFSF13 | TNFRSF17 | TNFSF13_TNFRSF17 | APRIL | Lung | ADJ |
| TNFSF13 | TNFRSF13B | TNFSF13_TNFRSF13B | APRIL | Lung | ADJ |
| TNFSF13 | TNFRSF17 | TNFSF13_TNFRSF17 | APRIL | Lung | AIS |
| TNFSF13 | TNFRSF13B | TNFSF13_TNFRSF13B | APRIL | Lung | AIS |
| TNFSF13 | TNFRSF17 | TNFSF13_TNFRSF17 | APRIL | Lung | IAC |
| TNFSF13 | TNFRSF13B | TNFSF13_TNFRSF13B | APRIL | Lung | IAC |
| TNFSF13 | TNFRSF17 | TNFSF13_TNFRSF17 | APRIL | Lung | MIAC |
| TNFSF13 | TNFRSF13B | TNFSF13_TNFRSF13B | APRIL | Lung | MIAC |
| TNFSF13 | TNFRSF17 | TNFSF13_TNFRSF17 | APRIL | Lung | Precancer |
| TNFSF13 | TNFRSF13B | TNFSF13_TNFRSF13B | APRIL | Lung | Precancer |
| TNFSF13 | TNFRSF17 | TNFSF13_TNFRSF17 | APRIL | Prostate | BPH |
| Page: 1 |
Top |
Single-cell gene regulatory network inference analysis |
| Find out the significant the regulons (TFs) and the target genes of each regulon across cell types for different disease states |
| TF | Cell Type | Tissue | Disease Stage | Target Gene | RSS | Regulon Activity |
| ∗The dot plots of a searched regulon are shown for all cell subpopulations in each disease state of each tissue based on the regulon specific score inferred using pySCENIC and by calculating the average expression. |
| Page: 1 |
Top |
Somatic mutation of malignant transformation related genes |
| Annotation of somatic variants for genes involved in malignant transformation |
| Hugo Symbol | Variant Class | Variant Classification | dbSNP RS | HGVSc | HGVSp | HGVSp Short | SWISSPROT | BIOTYPE | SIFT | PolyPhen | Tumor Sample Barcode | Tissue | Histology | Sex | Age | Stage | Therapy Types | Drugs | Outcome |
| TNFSF13 | SNV | Missense_Mutation | novel | c.339N>T | p.Lys113Asn | p.K113N | O75888 | protein_coding | tolerated(0.16) | benign(0.261) | TCGA-AX-A2HD-01 | Endometrium | uterine corpus endometrioid carcinoma | Female | >=65 | III/IV | Unknown | Unknown | SD |
| TNFSF13 | SNV | Missense_Mutation | novel | c.140C>T | p.Ala47Val | p.A47V | O75888 | protein_coding | tolerated(0.39) | benign(0.007) | TCGA-CV-7429-01 | Oral cavity | head & neck squamous cell carcinoma | Male | <65 | I/II | Unknown | Unknown | PD |
| TNFSF13 | deletion | Frame_Shift_Del | c.104delN | p.Ala37GlnfsTer13 | p.A37Qfs*13 | O75888 | protein_coding | TCGA-B7-5816-01 | Stomach | stomach adenocarcinoma | Female | <65 | I/II | Unknown | Unknown | SD | |||
| TNFSF13 | deletion | Frame_Shift_Del | c.104delN | p.Ala37GlnfsTer13 | p.A37Qfs*13 | O75888 | protein_coding | TCGA-CG-5723-01 | Stomach | stomach adenocarcinoma | Male | >=65 | I/II | Unknown | Unknown | SD | |||
| TNFSF13 | insertion | Frame_Shift_Ins | rs775253472 | c.103_104insG | p.Ala37GlyfsTer88 | p.A37Gfs*88 | O75888 | protein_coding | TCGA-HU-A4G8-01 | Stomach | stomach adenocarcinoma | Female | >=65 | I/II | Chemotherapy | 5-fluorouracil | SD |
| Page: 1 |
Top |
Related drugs of malignant transformation related genes |
| Identification of chemicals and drugs interact with genes involved in malignant transfromation |
| (DGIdb 4.0) |
| Entrez ID | Symbol | Category | Interaction Types | Drug Claim Name | Drug Name | PMIDs |
| 8741 | TNFSF13 | DRUGGABLE GENOME | TACI-IG | ATACICEPT | ||
| 8741 | TNFSF13 | DRUGGABLE GENOME | Atacicept | ATACICEPT | ||
| 8741 | TNFSF13 | DRUGGABLE GENOME | inhibitor | CHEMBL1742986 | ATACICEPT |
| Page: 1 |

Copyright 2023-Present -The University of Texas Health Science Center at Houston |