
|
|||||
|
 | |
| |
| |
| |
| |
| |
|
Gene: TNFRSF9 |
Gene summary for TNFRSF9 |
| Gene information | Species | Human | Gene symbol | TNFRSF9 | Gene ID | 3604 |
| Gene name | TNF receptor superfamily member 9 | |
| Gene Alias | 4-1BB | |
| Cytomap | 1p36.23 | |
| Gene Type | protein-coding | GO ID | GO:0006915 | UniProtAcc | Q07011 |
Top |
Malignant transformation analysis |
| Identification of the aberrant gene expression in precancerous and cancerous lesions by comparing the gene expression of stem-like cells in diseased tissues with normal stem cells |
| Entrez ID | Symbol | Replicates | Species | Organ | Tissue | Adj P-value | Log2FC | Malignancy |
| 3604 | TNFRSF9 | HCC1 | Human | Liver | HCC | 1.17e-09 | 7.63e-01 | 0.5336 |
| 3604 | TNFRSF9 | HCC2 | Human | Liver | HCC | 2.33e-16 | 1.44e+00 | 0.5341 |
| 3604 | TNFRSF9 | HCC5 | Human | Liver | HCC | 3.66e-16 | 1.33e+00 | 0.4932 |
| Page: 1 |
| Tissue | Expression Dynamics | Abbreviation |
| Liver | 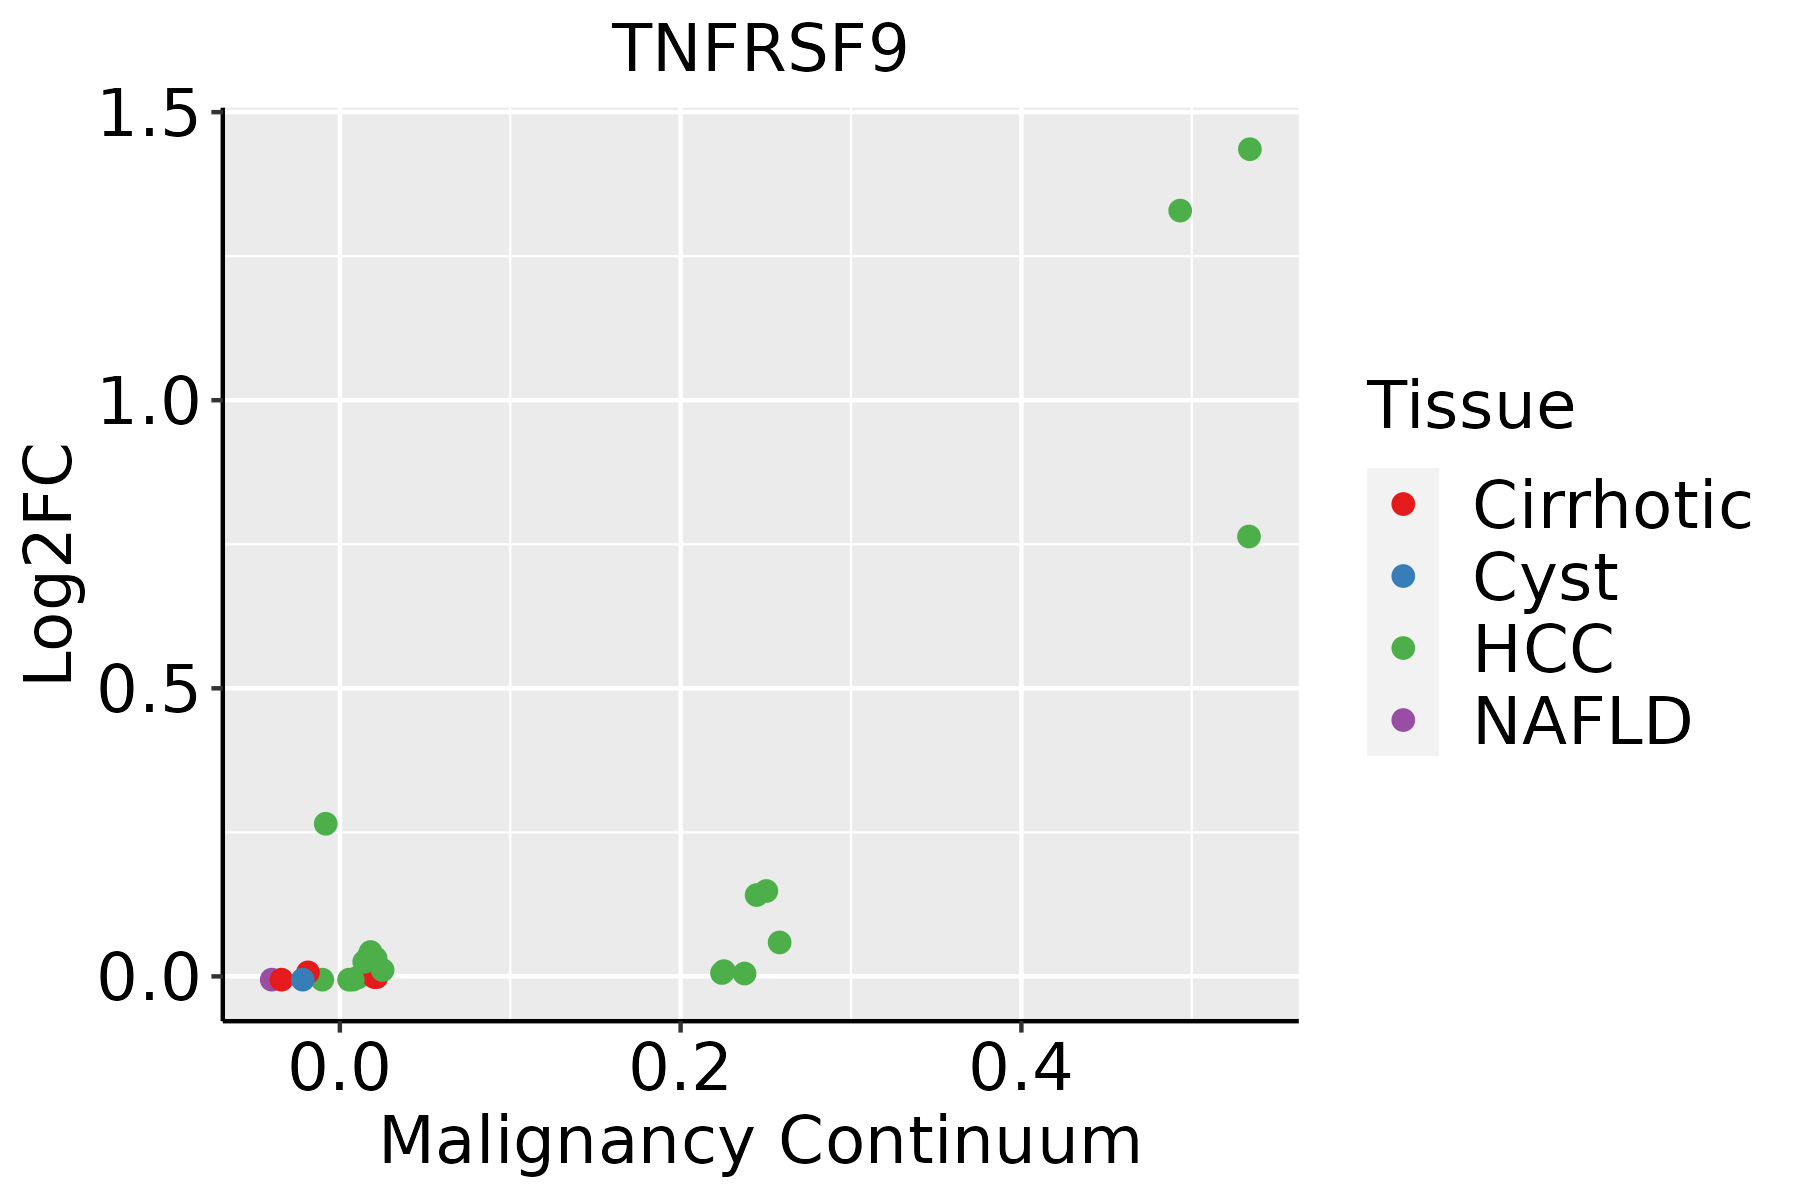 | HCC: Hepatocellular carcinoma |
| NAFLD: Non-alcoholic fatty liver disease |
| ∗log2FC in expression of this searched gene in stem-like cells from each diseased tissue sample relative to stem-like cells in normal samples in each tissue plotted against the malignancy continuum. Samples are colored based on if they are from different disease stage. |
Top |
Malignant transformation related pathway analysis |
| Find out the enriched GO biological processes and KEGG pathways involved in transition from healthy to precancer to cancer |
| Tissue | Disease Stage | Enriched GO biological Processes |
| Colorectum | AD |  |
| Colorectum | SER |  |
| Colorectum | MSS |  |
| Colorectum | MSI-H |  |
| Colorectum | FAP |  |
| ∗Top 15 enriched GO BP terms are showed in the bar plot of each disease state in each tissue. Each row represents a significant GO biological process which is colored according to the -log10(p.adjust). |
| Page: 1 2 3 4 5 6 7 8 9 |
| GO ID | Tissue | Disease Stage | Description | Gene Ratio | Bg Ratio | pvalue | p.adjust | Count |
| Page: 1 |
| Pathway ID | Tissue | Disease Stage | Description | Gene Ratio | Bg Ratio | pvalue | p.adjust | qvalue | Count |
| Page: 1 |
Top |
Cell-cell communication analysis |
| Identification of potential cell-cell interactions between two cell types and their ligand-receptor pairs for different disease states |
| Ligand | Receptor | LRpair | Pathway | Tissue | Disease Stage |
| TNFSF9 | TNFRSF9 | TNFSF9_TNFRSF9 | CD137 | Breast | DCIS |
| TNFSF9 | TNFRSF9 | TNFSF9_TNFRSF9 | CD137 | Breast | Healthy |
| TNFSF9 | TNFRSF9 | TNFSF9_TNFRSF9 | CD137 | Cervix | CC |
| TNFSF9 | TNFRSF9 | TNFSF9_TNFRSF9 | CD137 | Cervix | Precancer |
| TNFSF9 | TNFRSF9 | TNFSF9_TNFRSF9 | CD137 | CRC | MSI-H |
| TNFSF9 | TNFRSF9 | TNFSF9_TNFRSF9 | CD137 | Endometrium | ADJ |
| TNFSF9 | TNFRSF9 | TNFSF9_TNFRSF9 | CD137 | Endometrium | AEH |
| TNFSF9 | TNFRSF9 | TNFSF9_TNFRSF9 | CD137 | HNSCC | OSCC |
| TNFSF9 | TNFRSF9 | TNFSF9_TNFRSF9 | CD137 | HNSCC | Precancer |
| TNFSF9 | TNFRSF9 | TNFSF9_TNFRSF9 | CD137 | Prostate | BPH |
| TNFSF9 | TNFRSF9 | TNFSF9_TNFRSF9 | CD137 | Prostate | Tumor |
| TNFSF9 | TNFRSF9 | TNFSF9_TNFRSF9 | CD137 | THCA | ADJ |
| TNFSF9 | TNFRSF9 | TNFSF9_TNFRSF9 | CD137 | THCA | Cancer |
| TNFSF9 | TNFRSF9 | TNFSF9_TNFRSF9 | CD137 | THCA | PTC |
| Page: 1 |
Top |
Single-cell gene regulatory network inference analysis |
| Find out the significant the regulons (TFs) and the target genes of each regulon across cell types for different disease states |
| TF | Cell Type | Tissue | Disease Stage | Target Gene | RSS | Regulon Activity |
| ∗The dot plots of a searched regulon are shown for all cell subpopulations in each disease state of each tissue based on the regulon specific score inferred using pySCENIC and by calculating the average expression. |
| Page: 1 |
Top |
Somatic mutation of malignant transformation related genes |
| Annotation of somatic variants for genes involved in malignant transformation |
| Hugo Symbol | Variant Class | Variant Classification | dbSNP RS | HGVSc | HGVSp | HGVSp Short | SWISSPROT | BIOTYPE | SIFT | PolyPhen | Tumor Sample Barcode | Tissue | Histology | Sex | Age | Stage | Therapy Types | Drugs | Outcome |
| TNFRSF9 | SNV | Missense_Mutation | novel | c.470T>G | p.Val157Gly | p.V157G | Q07011 | protein_coding | deleterious(0) | possibly_damaging(0.809) | TCGA-AN-A0FX-01 | Breast | breast invasive carcinoma | Female | <65 | I/II | Unknown | Unknown | SD |
| TNFRSF9 | SNV | Missense_Mutation | rs554909019 | c.731N>A | p.Arg244Gln | p.R244Q | Q07011 | protein_coding | tolerated(0.07) | benign(0.074) | TCGA-BH-A201-01 | Breast | breast invasive carcinoma | Female | <65 | I/II | Unknown | Unknown | SD |
| TNFRSF9 | SNV | Missense_Mutation | rs145966863 | c.500N>T | p.Pro167Leu | p.P167L | Q07011 | protein_coding | tolerated(0.28) | benign(0.098) | TCGA-A6-6653-01 | Colorectum | colon adenocarcinoma | Male | >=65 | I/II | Unknown | Unknown | SD |
| TNFRSF9 | SNV | Missense_Mutation | rs145966863 | c.500N>T | p.Pro167Leu | p.P167L | Q07011 | protein_coding | tolerated(0.28) | benign(0.098) | TCGA-AA-A01P-01 | Colorectum | colon adenocarcinoma | Female | >=65 | III/IV | Unknown | Unknown | PD |
| TNFRSF9 | SNV | Missense_Mutation | rs777956091 | c.625C>T | p.Arg209Cys | p.R209C | Q07011 | protein_coding | tolerated(0.22) | benign(0) | TCGA-AA-A02R-01 | Colorectum | colon adenocarcinoma | Female | >=65 | I/II | Unknown | Unknown | PD |
| TNFRSF9 | SNV | Missense_Mutation | novel | c.354N>C | p.Lys118Asn | p.K118N | Q07011 | protein_coding | deleterious(0.01) | possibly_damaging(0.81) | TCGA-CA-6717-01 | Colorectum | colon adenocarcinoma | Male | <65 | I/II | Chemotherapy | oxaliplatin | CR |
| TNFRSF9 | SNV | Missense_Mutation | novel | c.654G>T | p.Lys218Asn | p.K218N | Q07011 | protein_coding | deleterious(0) | probably_damaging(0.941) | TCGA-AG-A002-01 | Colorectum | rectum adenocarcinoma | Male | <65 | I/II | Unknown | Unknown | SD |
| TNFRSF9 | SNV | Missense_Mutation | rs554909019 | c.731N>A | p.Arg244Gln | p.R244Q | Q07011 | protein_coding | tolerated(0.07) | benign(0.074) | TCGA-A5-A0G2-01 | Endometrium | uterine corpus endometrioid carcinoma | Female | <65 | III/IV | Unknown | Unknown | SD |
| TNFRSF9 | SNV | Missense_Mutation | rs372213895 | c.250N>A | p.Ala84Thr | p.A84T | Q07011 | protein_coding | tolerated(0.17) | benign(0.153) | TCGA-A5-A0G2-01 | Endometrium | uterine corpus endometrioid carcinoma | Female | <65 | III/IV | Unknown | Unknown | SD |
| TNFRSF9 | SNV | Missense_Mutation | novel | c.103A>G | p.Thr35Ala | p.T35A | Q07011 | protein_coding | deleterious(0.03) | possibly_damaging(0.862) | TCGA-AP-A1E0-01 | Endometrium | uterine corpus endometrioid carcinoma | Female | <65 | III/IV | Chemotherapy | paclitaxel | SD |
| Page: 1 2 3 |
Top |
Related drugs of malignant transformation related genes |
| Identification of chemicals and drugs interact with genes involved in malignant transfromation |
| (DGIdb 4.0) |
| Entrez ID | Symbol | Category | Interaction Types | Drug Claim Name | Drug Name | PMIDs |
| 3604 | TNFRSF9 | DRUGGABLE GENOME, CLINICALLY ACTIONABLE, EXTERNAL SIDE OF PLASMA MEMBRANE | PF-05082566 | UTOMILUMAB | ||
| 3604 | TNFRSF9 | DRUGGABLE GENOME, CLINICALLY ACTIONABLE, EXTERNAL SIDE OF PLASMA MEMBRANE | CD137 CAR-T Cell | |||
| 3604 | TNFRSF9 | DRUGGABLE GENOME, CLINICALLY ACTIONABLE, EXTERNAL SIDE OF PLASMA MEMBRANE | antibody | 318164830 | URELUMAB | |
| 3604 | TNFRSF9 | DRUGGABLE GENOME, CLINICALLY ACTIONABLE, EXTERNAL SIDE OF PLASMA MEMBRANE | CD28 and CD137 CAR-T Cells | |||
| 3604 | TNFRSF9 | DRUGGABLE GENOME, CLINICALLY ACTIONABLE, EXTERNAL SIDE OF PLASMA MEMBRANE | Urelumab | URELUMAB | ||
| 3604 | TNFRSF9 | DRUGGABLE GENOME, CLINICALLY ACTIONABLE, EXTERNAL SIDE OF PLASMA MEMBRANE | antibody | 315661319 | UTOMILUMAB | |
| 3604 | TNFRSF9 | DRUGGABLE GENOME, CLINICALLY ACTIONABLE, EXTERNAL SIDE OF PLASMA MEMBRANE | 178101774 | |||
| 3604 | TNFRSF9 | DRUGGABLE GENOME, CLINICALLY ACTIONABLE, EXTERNAL SIDE OF PLASMA MEMBRANE | MG7-CART | |||
| 3604 | TNFRSF9 | DRUGGABLE GENOME, CLINICALLY ACTIONABLE, EXTERNAL SIDE OF PLASMA MEMBRANE | agonist | CHEMBL1743085 | URELUMAB | |
| 3604 | TNFRSF9 | DRUGGABLE GENOME, CLINICALLY ACTIONABLE, EXTERNAL SIDE OF PLASMA MEMBRANE | Anti-CD137 |
| Page: 1 |

Copyright 2023-Present -The University of Texas Health Science Center at Houston |