
|
|||||
|
 | |
| |
| |
| |
| |
| |
|
Gene: TNFRSF25 |
Gene summary for TNFRSF25 |
| Gene information | Species | Human | Gene symbol | TNFRSF25 | Gene ID | 8718 |
| Gene name | TNF receptor superfamily member 25 | |
| Gene Alias | APO-3 | |
| Cytomap | 1p36.31 | |
| Gene Type | protein-coding | GO ID | GO:0006915 | UniProtAcc | Q93038 |
Top |
Malignant transformation analysis |
| Identification of the aberrant gene expression in precancerous and cancerous lesions by comparing the gene expression of stem-like cells in diseased tissues with normal stem cells |
| Entrez ID | Symbol | Replicates | Species | Organ | Tissue | Adj P-value | Log2FC | Malignancy |
| 8718 | TNFRSF25 | C04 | Human | Oral cavity | OSCC | 3.61e-06 | 4.01e-01 | 0.2633 |
| 8718 | TNFRSF25 | C21 | Human | Oral cavity | OSCC | 5.69e-04 | 2.95e-01 | 0.2678 |
| 8718 | TNFRSF25 | C30 | Human | Oral cavity | OSCC | 6.13e-14 | 5.21e-01 | 0.3055 |
| 8718 | TNFRSF25 | C38 | Human | Oral cavity | OSCC | 8.75e-07 | 4.63e-01 | 0.172 |
| 8718 | TNFRSF25 | C46 | Human | Oral cavity | OSCC | 3.72e-09 | 1.79e-01 | 0.1673 |
| 8718 | TNFRSF25 | C51 | Human | Oral cavity | OSCC | 8.48e-08 | 3.93e-01 | 0.2674 |
| 8718 | TNFRSF25 | C08 | Human | Oral cavity | OSCC | 8.48e-04 | 9.44e-02 | 0.1919 |
| 8718 | TNFRSF25 | C09 | Human | Oral cavity | OSCC | 8.35e-04 | 1.10e-01 | 0.1431 |
| 8718 | TNFRSF25 | LN22 | Human | Oral cavity | OSCC | 1.24e-13 | 1.21e+00 | 0.1733 |
| 8718 | TNFRSF25 | LN46 | Human | Oral cavity | OSCC | 1.39e-03 | 2.72e-01 | 0.1666 |
| 8718 | TNFRSF25 | SYSMH1 | Human | Oral cavity | OSCC | 5.00e-03 | 5.98e-02 | 0.1127 |
| 8718 | TNFRSF25 | SYSMH2 | Human | Oral cavity | OSCC | 1.03e-04 | 1.88e-01 | 0.2326 |
| 8718 | TNFRSF25 | SYSMH3 | Human | Oral cavity | OSCC | 1.41e-09 | 3.47e-01 | 0.2442 |
| 8718 | TNFRSF25 | SYSMH5 | Human | Oral cavity | OSCC | 1.22e-04 | 1.76e-01 | 0.0647 |
| Page: 1 |
| Tissue | Expression Dynamics | Abbreviation |
| Oral Cavity | 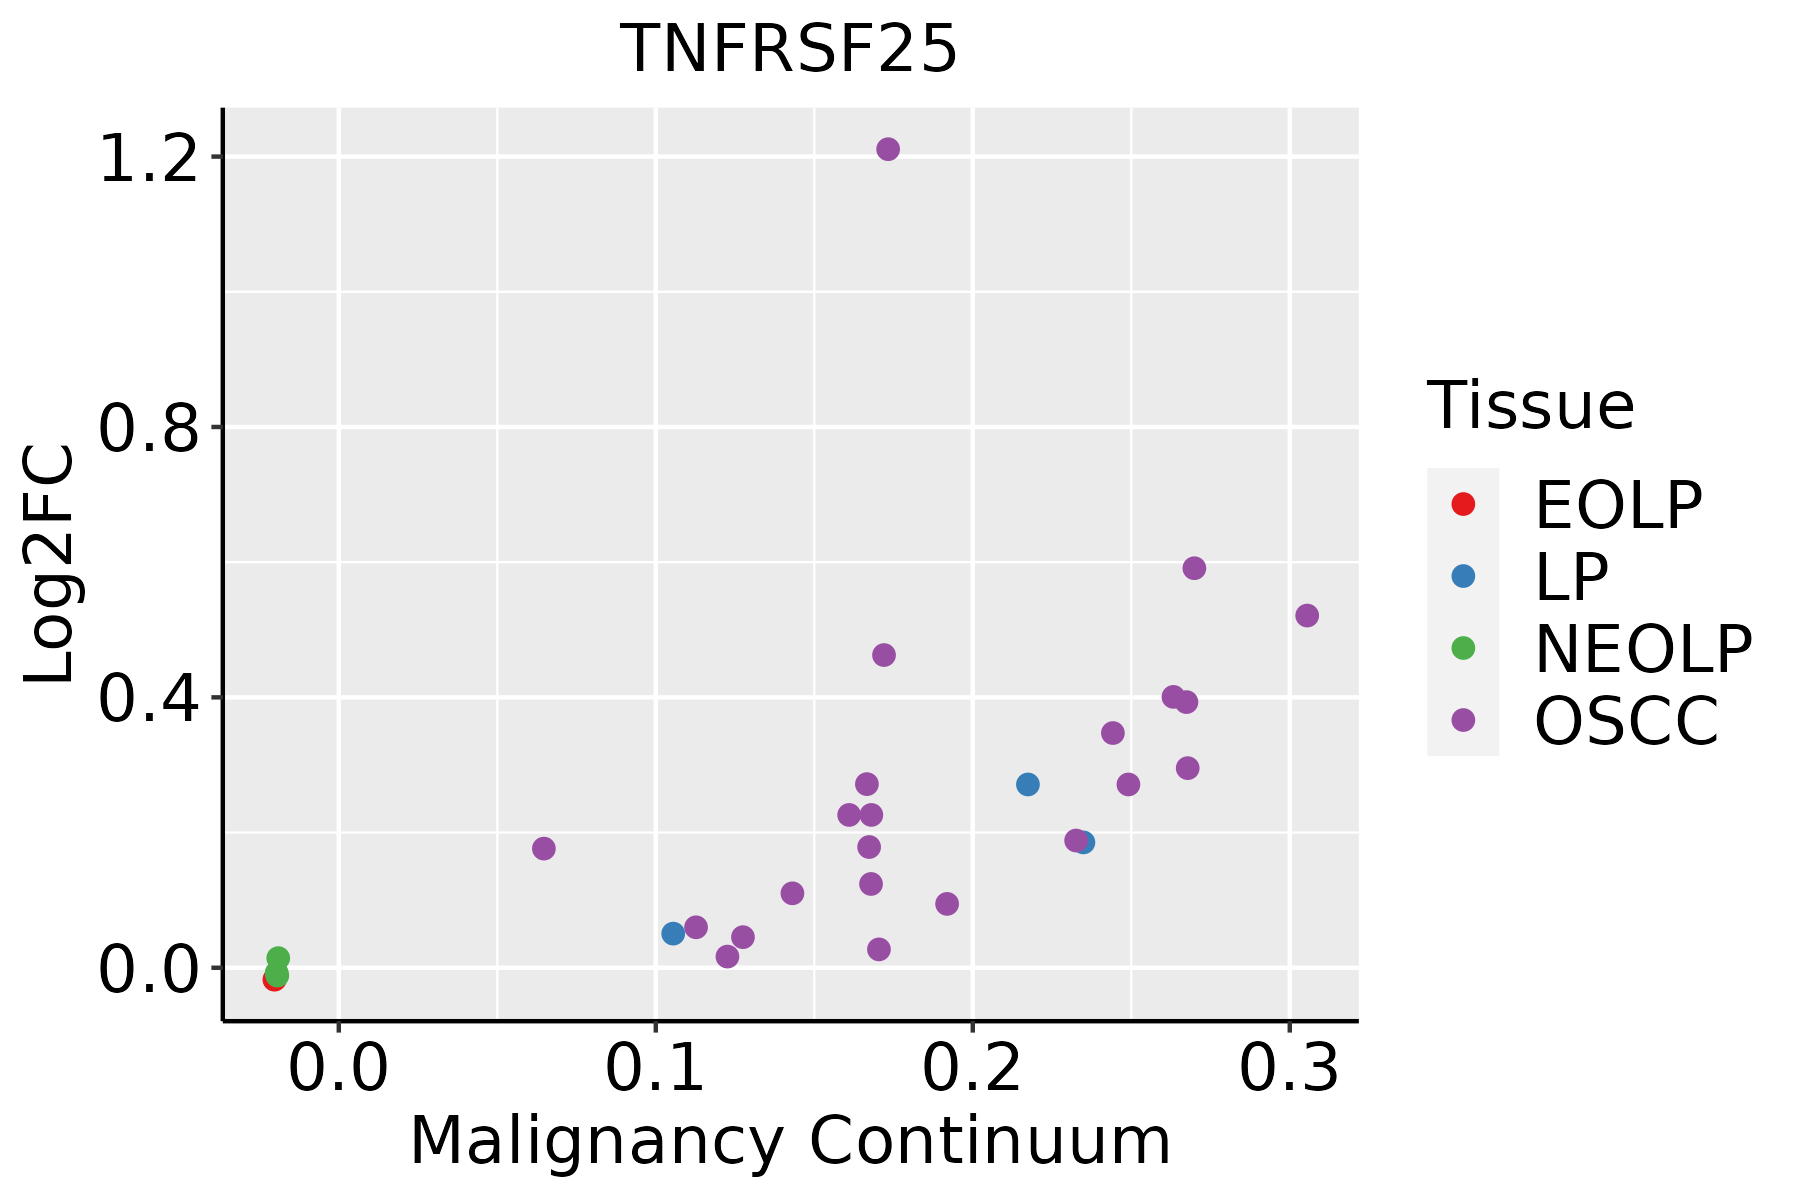 | EOLP: Erosive Oral lichen planus |
| LP: leukoplakia | ||
| NEOLP: Non-erosive oral lichen planus | ||
| OSCC: Oral squamous cell carcinoma |
| ∗log2FC in expression of this searched gene in stem-like cells from each diseased tissue sample relative to stem-like cells in normal samples in each tissue plotted against the malignancy continuum. Samples are colored based on if they are from different disease stage. |
Top |
Malignant transformation related pathway analysis |
| Find out the enriched GO biological processes and KEGG pathways involved in transition from healthy to precancer to cancer |
| Tissue | Disease Stage | Enriched GO biological Processes |
| Colorectum | AD |  |
| Colorectum | SER |  |
| Colorectum | MSS |  |
| Colorectum | MSI-H |  |
| Colorectum | FAP |  |
| ∗Top 15 enriched GO BP terms are showed in the bar plot of each disease state in each tissue. Each row represents a significant GO biological process which is colored according to the -log10(p.adjust). |
| Page: 1 2 3 4 5 6 7 8 9 |
| GO ID | Tissue | Disease Stage | Description | Gene Ratio | Bg Ratio | pvalue | p.adjust | Count |
| GO:003461218 | Oral cavity | OSCC | response to tumor necrosis factor | 143/7305 | 253/18723 | 1.09e-08 | 2.23e-07 | 143 |
| GO:007135618 | Oral cavity | OSCC | cellular response to tumor necrosis factor | 128/7305 | 229/18723 | 1.49e-07 | 2.49e-06 | 128 |
| GO:00332099 | Oral cavity | OSCC | tumor necrosis factor-mediated signaling pathway | 61/7305 | 99/18723 | 4.31e-06 | 4.98e-05 | 61 |
| GO:00192214 | Oral cavity | OSCC | cytokine-mediated signaling pathway | 222/7305 | 472/18723 | 2.02e-04 | 1.35e-03 | 222 |
| Page: 1 |
| Pathway ID | Tissue | Disease Stage | Description | Gene Ratio | Bg Ratio | pvalue | p.adjust | qvalue | Count |
| Page: 1 |
Top |
Cell-cell communication analysis |
| Identification of potential cell-cell interactions between two cell types and their ligand-receptor pairs for different disease states |
| Ligand | Receptor | LRpair | Pathway | Tissue | Disease Stage |
| TNFSF15 | TNFRSF25 | TNFSF15_TNFRSF25 | VEGI | THCA | Cancer |
| Page: 1 |
Top |
Single-cell gene regulatory network inference analysis |
| Find out the significant the regulons (TFs) and the target genes of each regulon across cell types for different disease states |
| TF | Cell Type | Tissue | Disease Stage | Target Gene | RSS | Regulon Activity |
| ∗The dot plots of a searched regulon are shown for all cell subpopulations in each disease state of each tissue based on the regulon specific score inferred using pySCENIC and by calculating the average expression. |
| Page: 1 |
Top |
Somatic mutation of malignant transformation related genes |
| Annotation of somatic variants for genes involved in malignant transformation |
| Hugo Symbol | Variant Class | Variant Classification | dbSNP RS | HGVSc | HGVSp | HGVSp Short | SWISSPROT | BIOTYPE | SIFT | PolyPhen | Tumor Sample Barcode | Tissue | Histology | Sex | Age | Stage | Therapy Types | Drugs | Outcome |
| TNFRSF25 | SNV | Missense_Mutation | rs771941306 | c.272N>A | p.Arg91His | p.R91H | Q93038 | protein_coding | deleterious(0) | probably_damaging(0.992) | TCGA-AC-A3EH-01 | Breast | breast invasive carcinoma | Female | >=65 | III/IV | Unknown | Unknown | SD |
| TNFRSF25 | SNV | Missense_Mutation | c.874N>A | p.Pro292Thr | p.P292T | Q93038 | protein_coding | deleterious(0.01) | benign(0.242) | TCGA-E9-A1RF-01 | Breast | breast invasive carcinoma | Female | >=65 | III/IV | Hormone Therapy | tamoxiphen | SD | |
| TNFRSF25 | SNV | Missense_Mutation | novel | c.154N>A | p.Pro52Thr | p.P52T | Q93038 | protein_coding | deleterious(0) | probably_damaging(0.998) | TCGA-LP-A4AU-01 | Cervix | cervical & endocervical cancer | Female | <65 | III/IV | Chemotherapy | cisplatin | CR |
| TNFRSF25 | SNV | Missense_Mutation | rs144966576 | c.67C>T | p.Arg23Trp | p.R23W | Q93038 | protein_coding | deleterious(0.02) | benign(0.401) | TCGA-VS-A9U6-01 | Cervix | cervical & endocervical cancer | Female | <65 | I/II | Chemotherapy | cisplatin | PD |
| TNFRSF25 | SNV | Missense_Mutation | novel | c.1010T>C | p.Met337Thr | p.M337T | Q93038 | protein_coding | tolerated(0.54) | benign(0.003) | TCGA-A6-5665-01 | Colorectum | colon adenocarcinoma | Female | >=65 | I/II | Unknown | Unknown | PD |
| TNFRSF25 | SNV | Missense_Mutation | c.878N>A | p.Gly293Asp | p.G293D | Q93038 | protein_coding | tolerated(0.11) | possibly_damaging(0.84) | TCGA-AA-3492-01 | Colorectum | colon adenocarcinoma | Female | >=65 | I/II | Unknown | Unknown | SD | |
| TNFRSF25 | SNV | Missense_Mutation | c.35N>T | p.Ala12Val | p.A12V | Q93038 | protein_coding | tolerated(0.31) | benign(0.058) | TCGA-AD-6889-01 | Colorectum | colon adenocarcinoma | Male | >=65 | I/II | Chemotherapy | xeloda | PD | |
| TNFRSF25 | SNV | Missense_Mutation | rs780893824 | c.446N>A | p.Arg149His | p.R149H | Q93038 | protein_coding | deleterious(0.04) | benign(0.081) | TCGA-AP-A1DV-01 | Endometrium | uterine corpus endometrioid carcinoma | Female | <65 | I/II | Unknown | Unknown | SD |
| TNFRSF25 | SNV | Missense_Mutation | rs780893824 | c.446G>A | p.Arg149His | p.R149H | Q93038 | protein_coding | deleterious(0.04) | benign(0.081) | TCGA-D1-A177-01 | Endometrium | uterine corpus endometrioid carcinoma | Female | >=65 | I/II | Unknown | Unknown | PD |
| TNFRSF25 | SNV | Missense_Mutation | rs143172535 | c.626N>C | p.Val209Ala | p.V209A | Q93038 | protein_coding | tolerated(0.27) | benign(0.003) | TCGA-DI-A1BU-01 | Endometrium | uterine corpus endometrioid carcinoma | Female | <65 | I/II | Chemotherapy | paclitaxel | SD |
| Page: 1 2 3 4 |
Top |
Related drugs of malignant transformation related genes |
| Identification of chemicals and drugs interact with genes involved in malignant transfromation |
| (DGIdb 4.0) |
| Entrez ID | Symbol | Category | Interaction Types | Drug Claim Name | Drug Name | PMIDs |
| 8718 | TNFRSF25 | DRUGGABLE GENOME | 178101764 |
| Page: 1 |

Copyright 2023-Present -The University of Texas Health Science Center at Houston |