
|
|||||
|
 | |
| |
| |
| |
| |
| |
|
Gene: TNFRSF21 |
Gene summary for TNFRSF21 |
| Gene information | Species | Human | Gene symbol | TNFRSF21 | Gene ID | 27242 |
| Gene name | TNF receptor superfamily member 21 | |
| Gene Alias | BM-018 | |
| Cytomap | 6p12.3 | |
| Gene Type | protein-coding | GO ID | GO:0001775 | UniProtAcc | A0A024RD71 |
Top |
Malignant transformation analysis |
| Identification of the aberrant gene expression in precancerous and cancerous lesions by comparing the gene expression of stem-like cells in diseased tissues with normal stem cells |
| Entrez ID | Symbol | Replicates | Species | Organ | Tissue | Adj P-value | Log2FC | Malignancy |
| 27242 | TNFRSF21 | HTA11_2487_2000001011 | Human | Colorectum | SER | 7.43e-03 | 4.44e-01 | -0.1808 |
| 27242 | TNFRSF21 | HTA11_411_2000001011 | Human | Colorectum | SER | 1.50e-02 | 1.02e+00 | -0.2602 |
| 27242 | TNFRSF21 | HTA11_2112_2000001011 | Human | Colorectum | SER | 1.75e-03 | 7.46e-01 | -0.2196 |
| 27242 | TNFRSF21 | A015-C-203 | Human | Colorectum | FAP | 4.11e-06 | -1.66e-01 | -0.1294 |
| 27242 | TNFRSF21 | A002-C-205 | Human | Colorectum | FAP | 1.51e-04 | -2.02e-01 | -0.1236 |
| 27242 | TNFRSF21 | A015-C-006 | Human | Colorectum | FAP | 1.18e-03 | -2.49e-01 | -0.0994 |
| 27242 | TNFRSF21 | A002-C-114 | Human | Colorectum | FAP | 3.46e-02 | -1.55e-01 | -0.1561 |
| 27242 | TNFRSF21 | A015-C-104 | Human | Colorectum | FAP | 9.49e-06 | -1.27e-01 | -0.1899 |
| 27242 | TNFRSF21 | A002-C-016 | Human | Colorectum | FAP | 1.37e-03 | -9.78e-02 | 0.0521 |
| 27242 | TNFRSF21 | A002-C-116 | Human | Colorectum | FAP | 3.15e-05 | -1.74e-01 | -0.0452 |
| 27242 | TNFRSF21 | A018-E-020 | Human | Colorectum | FAP | 3.91e-03 | -1.98e-01 | -0.2034 |
| 27242 | TNFRSF21 | F034 | Human | Colorectum | FAP | 5.21e-04 | -1.52e-01 | -0.0665 |
| 27242 | TNFRSF21 | F072B | Human | Colorectum | FAP | 1.20e-02 | -1.57e-01 | 0.257 |
| 27242 | TNFRSF21 | LZE4T | Human | Esophagus | ESCC | 1.07e-10 | -4.55e-01 | 0.0811 |
| 27242 | TNFRSF21 | LZE5T | Human | Esophagus | ESCC | 7.06e-06 | -1.36e-02 | 0.0514 |
| 27242 | TNFRSF21 | LZE7T | Human | Esophagus | ESCC | 1.31e-03 | -2.41e-01 | 0.0667 |
| 27242 | TNFRSF21 | LZE8T | Human | Esophagus | ESCC | 7.45e-04 | -8.65e-02 | 0.067 |
| 27242 | TNFRSF21 | LZE20T | Human | Esophagus | ESCC | 3.76e-02 | 1.96e-01 | 0.0662 |
| 27242 | TNFRSF21 | LZE24T | Human | Esophagus | ESCC | 3.55e-03 | 4.94e-01 | 0.0596 |
| 27242 | TNFRSF21 | P2T-E | Human | Esophagus | ESCC | 2.74e-15 | -3.62e-01 | 0.1177 |
| Page: 1 2 3 4 5 6 7 8 |
| Tissue | Expression Dynamics | Abbreviation |
| Colorectum (GSE201348) |  | FAP: Familial adenomatous polyposis |
| CRC: Colorectal cancer | ||
| Colorectum (HTA11) | 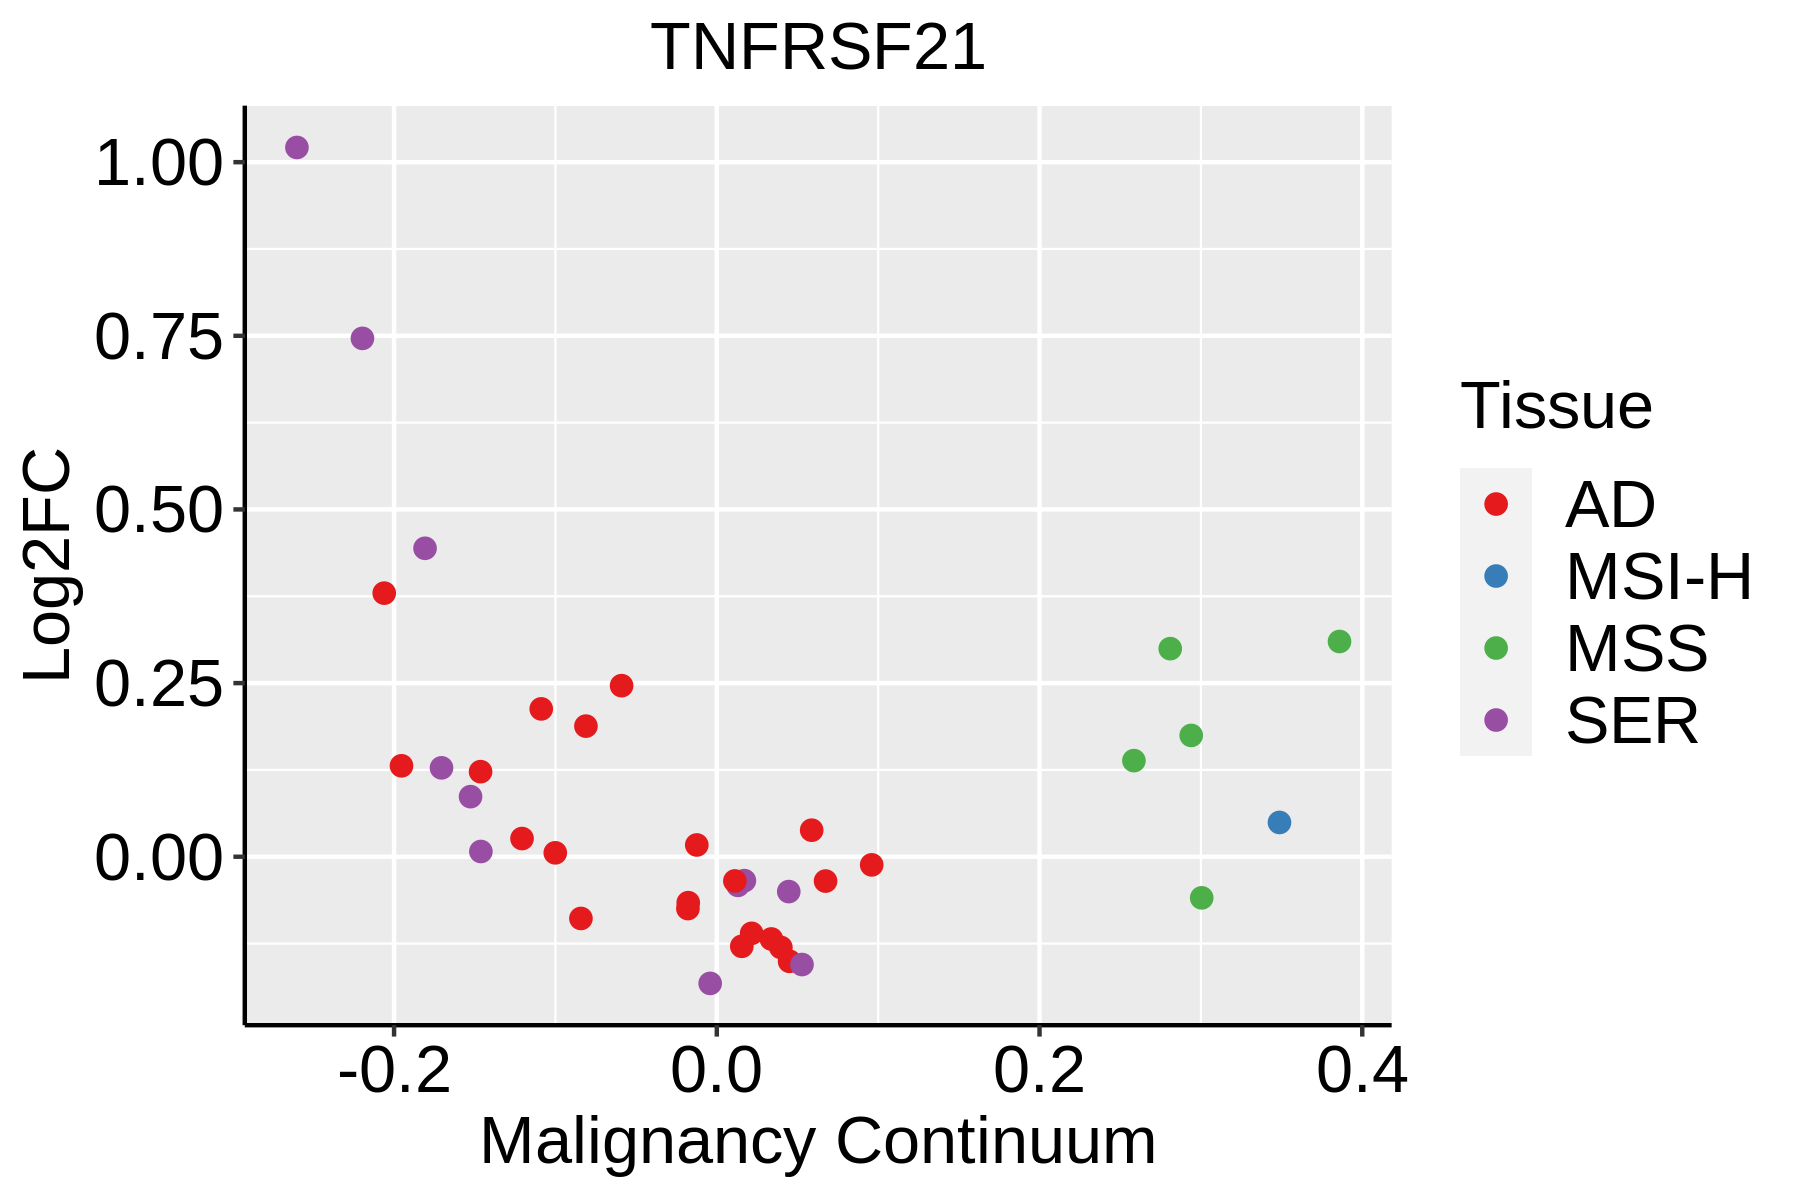 | AD: Adenomas |
| SER: Sessile serrated lesions | ||
| MSI-H: Microsatellite-high colorectal cancer | ||
| MSS: Microsatellite stable colorectal cancer | ||
| Esophagus | 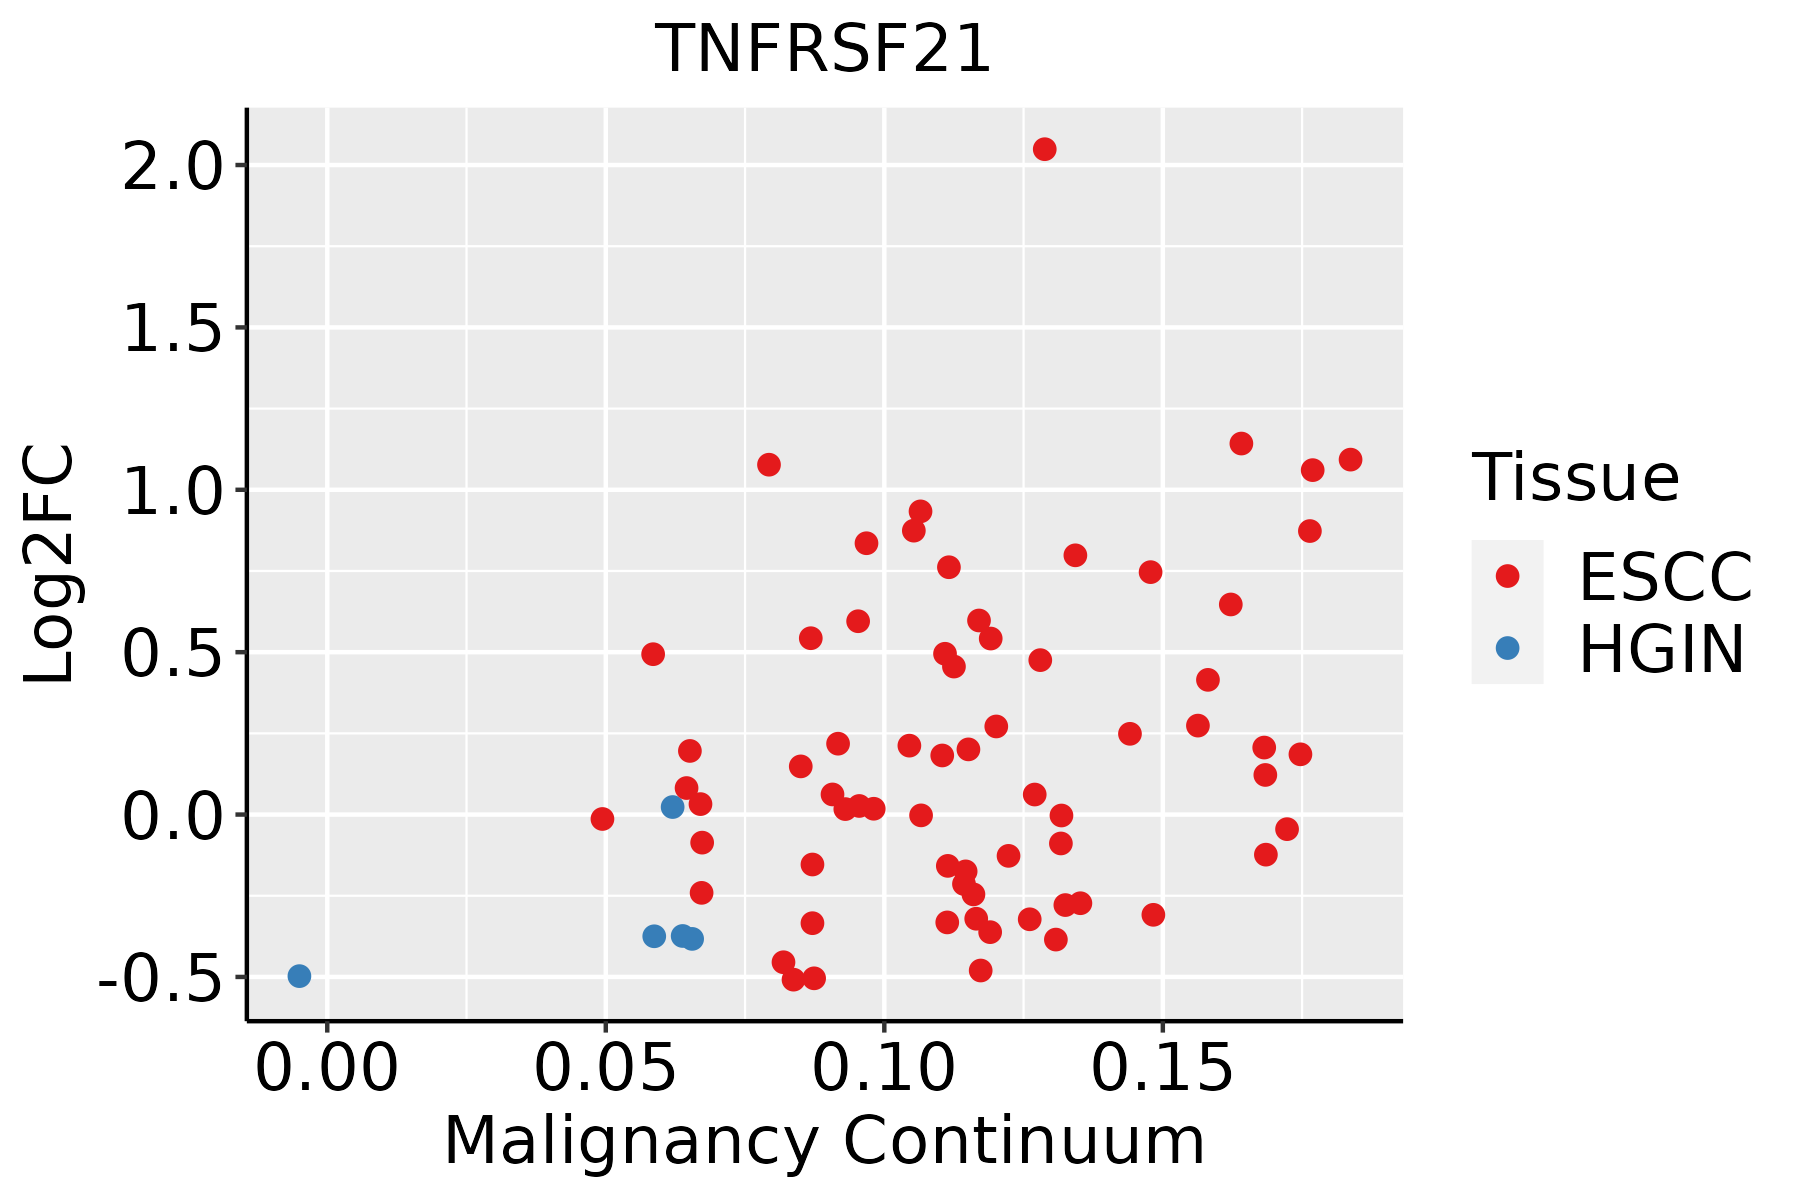 | ESCC: Esophageal squamous cell carcinoma |
| HGIN: High-grade intraepithelial neoplasias | ||
| LGIN: Low-grade intraepithelial neoplasias | ||
| GC |  | CAG: Chronic atrophic gastritis |
| CAG with IM: Chronic atrophic gastritis with intestinal metaplasia | ||
| CSG: Chronic superficial gastritis | ||
| GC: Gastric cancer | ||
| SIM: Severe intestinal metaplasia | ||
| WIM: Wild intestinal metaplasia | ||
| Liver |  | HCC: Hepatocellular carcinoma |
| NAFLD: Non-alcoholic fatty liver disease | ||
| Lung | 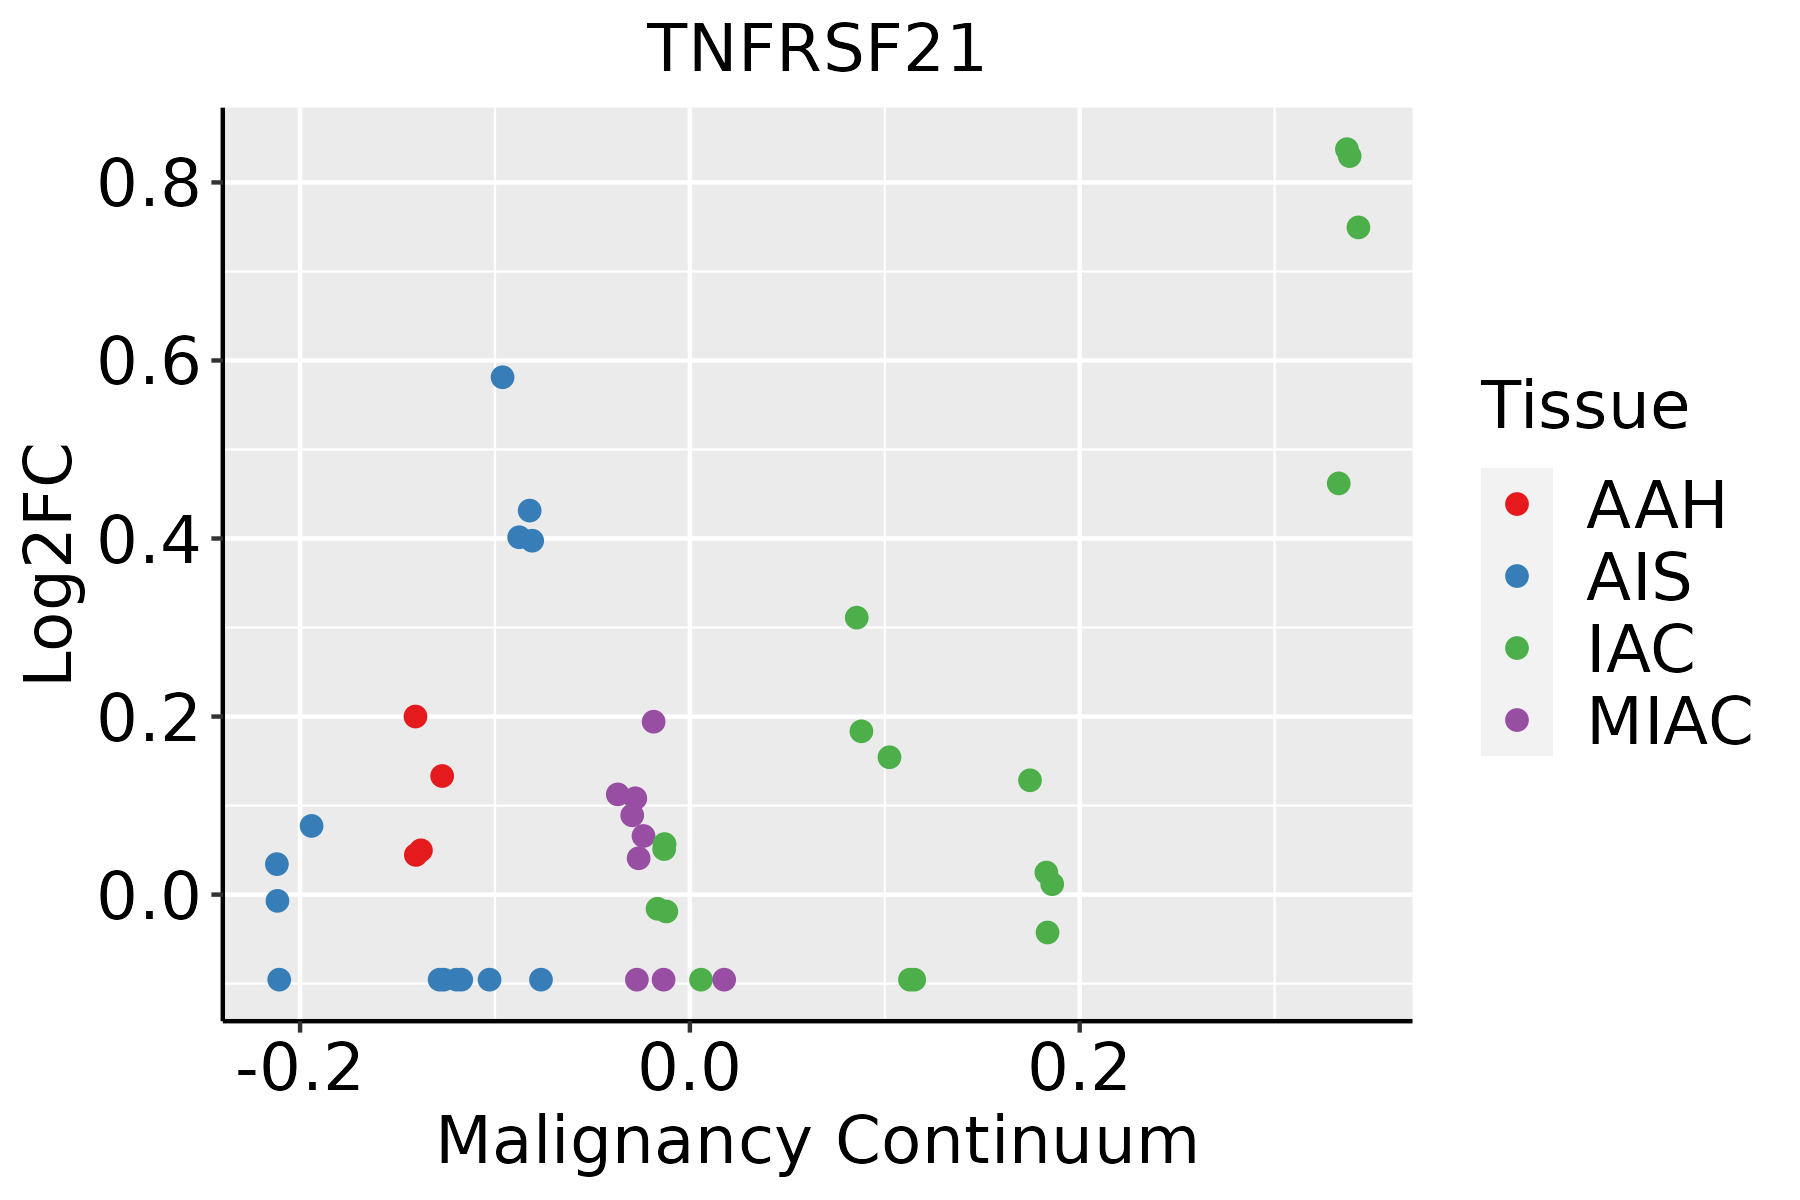 | AAH: Atypical adenomatous hyperplasia |
| AIS: Adenocarcinoma in situ | ||
| IAC: Invasive lung adenocarcinoma | ||
| MIA: Minimally invasive adenocarcinoma | ||
| Oral Cavity |  | EOLP: Erosive Oral lichen planus |
| LP: leukoplakia | ||
| NEOLP: Non-erosive oral lichen planus | ||
| OSCC: Oral squamous cell carcinoma | ||
| Prostate | 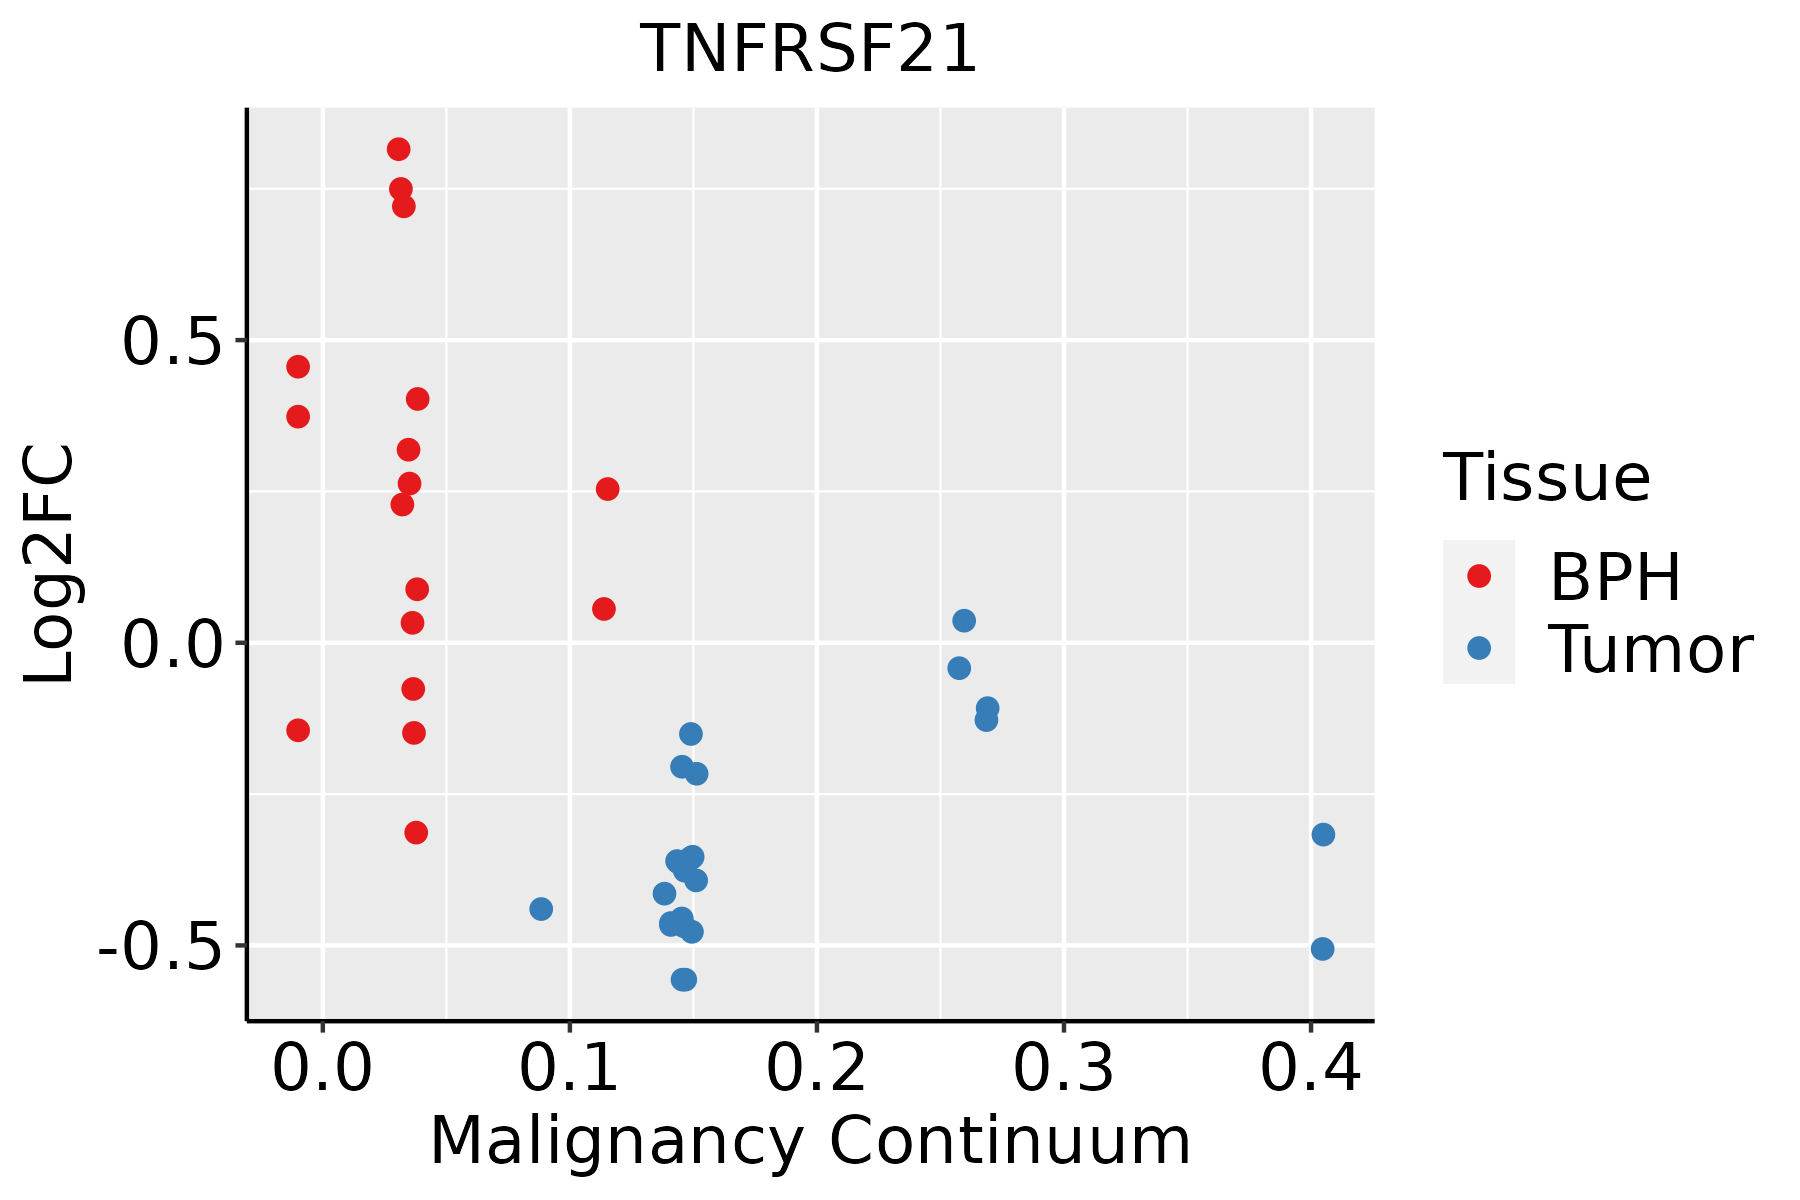 | BPH: Benign Prostatic Hyperplasia |
| Skin |  | AK: Actinic keratosis |
| cSCC: Cutaneous squamous cell carcinoma | ||
| SCCIS:squamous cell carcinoma in situ |
| ∗log2FC in expression of this searched gene in stem-like cells from each diseased tissue sample relative to stem-like cells in normal samples in each tissue plotted against the malignancy continuum. Samples are colored based on if they are from different disease stage. |
Top |
Malignant transformation related pathway analysis |
| Find out the enriched GO biological processes and KEGG pathways involved in transition from healthy to precancer to cancer |
| Tissue | Disease Stage | Enriched GO biological Processes |
| Colorectum | AD |  |
| Colorectum | SER |  |
| Colorectum | MSS |  |
| Colorectum | MSI-H |  |
| Colorectum | FAP |  |
| ∗Top 15 enriched GO BP terms are showed in the bar plot of each disease state in each tissue. Each row represents a significant GO biological process which is colored according to the -log10(p.adjust). |
| Page: 1 2 3 4 5 6 7 8 9 |
| GO ID | Tissue | Disease Stage | Description | Gene Ratio | Bg Ratio | pvalue | p.adjust | Count |
| GO:00709971 | Colorectum | SER | neuron death | 84/2897 | 361/18723 | 5.76e-05 | 1.35e-03 | 84 |
| GO:00514021 | Colorectum | SER | neuron apoptotic process | 60/2897 | 246/18723 | 1.65e-04 | 3.13e-03 | 60 |
| GO:0007162 | Colorectum | SER | negative regulation of cell adhesion | 68/2897 | 303/18723 | 8.02e-04 | 1.01e-02 | 68 |
| GO:00615641 | Colorectum | SER | axon development | 94/2897 | 467/18723 | 3.78e-03 | 3.13e-02 | 94 |
| GO:0022408 | Colorectum | SER | negative regulation of cell-cell adhesion | 44/2897 | 196/18723 | 6.08e-03 | 4.42e-02 | 44 |
| GO:00615643 | Colorectum | FAP | axon development | 106/2622 | 467/18723 | 1.98e-07 | 1.21e-05 | 106 |
| GO:00709974 | Colorectum | FAP | neuron death | 81/2622 | 361/18723 | 8.35e-06 | 2.46e-04 | 81 |
| GO:00519601 | Colorectum | FAP | regulation of nervous system development | 89/2622 | 443/18723 | 2.32e-04 | 3.25e-03 | 89 |
| GO:00514024 | Colorectum | FAP | neuron apoptotic process | 55/2622 | 246/18723 | 2.42e-04 | 3.37e-03 | 55 |
| GO:00071621 | Colorectum | FAP | negative regulation of cell adhesion | 61/2622 | 303/18723 | 1.96e-03 | 1.65e-02 | 61 |
| GO:0070997111 | Esophagus | ESCC | neuron death | 216/8552 | 361/18723 | 3.49e-08 | 6.45e-07 | 216 |
| GO:0051402110 | Esophagus | ESCC | neuron apoptotic process | 148/8552 | 246/18723 | 3.08e-06 | 3.47e-05 | 148 |
| GO:003461220 | Esophagus | ESCC | response to tumor necrosis factor | 149/8552 | 253/18723 | 1.47e-05 | 1.33e-04 | 149 |
| GO:00425524 | Esophagus | ESCC | myelination | 85/8552 | 134/18723 | 2.51e-05 | 2.13e-04 | 85 |
| GO:00072724 | Esophagus | ESCC | ensheathment of neurons | 86/8552 | 136/18723 | 2.68e-05 | 2.24e-04 | 86 |
| GO:00083664 | Esophagus | ESCC | axon ensheathment | 86/8552 | 136/18723 | 2.68e-05 | 2.24e-04 | 86 |
| GO:00420636 | Esophagus | ESCC | gliogenesis | 172/8552 | 301/18723 | 3.75e-05 | 3.04e-04 | 172 |
| GO:007135620 | Esophagus | ESCC | cellular response to tumor necrosis factor | 132/8552 | 229/18723 | 1.69e-04 | 1.11e-03 | 132 |
| GO:006156415 | Esophagus | ESCC | axon development | 251/8552 | 467/18723 | 2.41e-04 | 1.49e-03 | 251 |
| GO:00100016 | Esophagus | ESCC | glial cell differentiation | 129/8552 | 225/18723 | 2.73e-04 | 1.65e-03 | 129 |
| Page: 1 2 3 4 5 6 7 8 9 10 11 12 13 14 15 16 17 |
| Pathway ID | Tissue | Disease Stage | Description | Gene Ratio | Bg Ratio | pvalue | p.adjust | qvalue | Count |
| Page: 1 |
Top |
Cell-cell communication analysis |
| Identification of potential cell-cell interactions between two cell types and their ligand-receptor pairs for different disease states |
| Ligand | Receptor | LRpair | Pathway | Tissue | Disease Stage |
| Page: 1 |
Top |
Single-cell gene regulatory network inference analysis |
| Find out the significant the regulons (TFs) and the target genes of each regulon across cell types for different disease states |
| TF | Cell Type | Tissue | Disease Stage | Target Gene | RSS | Regulon Activity |
| ∗The dot plots of a searched regulon are shown for all cell subpopulations in each disease state of each tissue based on the regulon specific score inferred using pySCENIC and by calculating the average expression. |
| Page: 1 |
Top |
Somatic mutation of malignant transformation related genes |
| Annotation of somatic variants for genes involved in malignant transformation |
| Hugo Symbol | Variant Class | Variant Classification | dbSNP RS | HGVSc | HGVSp | HGVSp Short | SWISSPROT | BIOTYPE | SIFT | PolyPhen | Tumor Sample Barcode | Tissue | Histology | Sex | Age | Stage | Therapy Types | Drugs | Outcome |
| TNFRSF21 | SNV | Missense_Mutation | c.1600N>A | p.Ala534Thr | p.A534T | O75509 | protein_coding | tolerated(1) | benign(0) | TCGA-A8-A097-01 | Breast | breast invasive carcinoma | Female | >=65 | I/II | Hormone Therapy | tamoxiphen | SD | |
| TNFRSF21 | insertion | In_Frame_Ins | novel | c.420_421insTATACCAAAGATGTTTTCTCCATTTCGTGTATTCCAAAG | p.Ser140_Asn141insTyrThrLysAspValPheSerIleSerCysIleProLys | p.S140_N141insYTKDVFSISCIPK | O75509 | protein_coding | TCGA-A8-A09M-01 | Breast | breast invasive carcinoma | Female | >=65 | III/IV | Chemotherapy | paclitaxel | CR | ||
| TNFRSF21 | insertion | Frame_Shift_Ins | novel | c.1319_1320insACACACACACACACGCATACGCCTGCACA | p.Ser441HisfsTer48 | p.S441Hfs*48 | O75509 | protein_coding | TCGA-AQ-A04J-01 | Breast | breast invasive carcinoma | Female | <65 | I/II | Chemotherapy | cytoxan | SD | ||
| TNFRSF21 | SNV | Missense_Mutation | rs781439087 | c.1414G>A | p.Glu472Lys | p.E472K | O75509 | protein_coding | deleterious(0.01) | benign(0.266) | TCGA-2W-A8YY-01 | Cervix | cervical & endocervical cancer | Female | <65 | I/II | Chemotherapy | cisplatin | CR |
| TNFRSF21 | SNV | Missense_Mutation | c.1224N>G | p.Ile408Met | p.I408M | O75509 | protein_coding | deleterious(0.04) | possibly_damaging(0.779) | TCGA-EK-A2PL-01 | Cervix | cervical & endocervical cancer | Female | <65 | III/IV | Unknown | Unknown | SD | |
| TNFRSF21 | SNV | Missense_Mutation | c.1036N>G | p.Ile346Val | p.I346V | O75509 | protein_coding | deleterious(0) | probably_damaging(0.991) | TCGA-EK-A2RE-01 | Cervix | cervical & endocervical cancer | Female | <65 | I/II | Unknown | Unknown | SD | |
| TNFRSF21 | SNV | Missense_Mutation | rs778427574 | c.1769N>A | p.Arg590His | p.R590H | O75509 | protein_coding | deleterious(0) | probably_damaging(0.981) | TCGA-AA-3672-01 | Colorectum | colon adenocarcinoma | Female | >=65 | III/IV | Unknown | Unknown | SD |
| TNFRSF21 | SNV | Missense_Mutation | c.1376N>T | p.Ala459Val | p.A459V | O75509 | protein_coding | deleterious(0) | possibly_damaging(0.64) | TCGA-AA-3854-01 | Colorectum | colon adenocarcinoma | Female | >=65 | I/II | Unknown | Unknown | SD | |
| TNFRSF21 | SNV | Missense_Mutation | rs867596127 | c.1483N>T | p.Arg495Cys | p.R495C | O75509 | protein_coding | deleterious(0) | probably_damaging(0.986) | TCGA-AA-A010-01 | Colorectum | colon adenocarcinoma | Female | <65 | I/II | Chemotherapy | folinic | CR |
| TNFRSF21 | SNV | Missense_Mutation | c.1363G>A | p.Asp455Asn | p.D455N | O75509 | protein_coding | deleterious(0.01) | probably_damaging(0.976) | TCGA-CK-5913-01 | Colorectum | colon adenocarcinoma | Female | <65 | I/II | Unknown | Unknown | SD |
| Page: 1 2 3 4 5 6 7 |
Top |
Related drugs of malignant transformation related genes |
| Identification of chemicals and drugs interact with genes involved in malignant transfromation |
| (DGIdb 4.0) |
| Entrez ID | Symbol | Category | Interaction Types | Drug Claim Name | Drug Name | PMIDs |
| Page: 1 |

Copyright 2023-Present -The University of Texas Health Science Center at Houston |