
|
|||||
|
 | |
| |
| |
| |
| |
| |
|
Gene: TNFRSF1A |
Gene summary for TNFRSF1A |
| Gene information | Species | Human | Gene symbol | TNFRSF1A | Gene ID | 7132 |
| Gene name | TNF receptor superfamily member 1A | |
| Gene Alias | CD120a | |
| Cytomap | 12p13.31 | |
| Gene Type | protein-coding | GO ID | GO:0001885 | UniProtAcc | P19438 |
Top |
Malignant transformation analysis |
| Identification of the aberrant gene expression in precancerous and cancerous lesions by comparing the gene expression of stem-like cells in diseased tissues with normal stem cells |
| Entrez ID | Symbol | Replicates | Species | Organ | Tissue | Adj P-value | Log2FC | Malignancy |
| 7132 | TNFRSF1A | HTA11_2487_2000001011 | Human | Colorectum | SER | 7.09e-05 | 4.40e-01 | -0.1808 |
| 7132 | TNFRSF1A | HTA11_347_2000001011 | Human | Colorectum | AD | 2.09e-05 | 3.28e-01 | -0.1954 |
| 7132 | TNFRSF1A | HTA11_411_2000001011 | Human | Colorectum | SER | 4.81e-02 | 8.89e-01 | -0.2602 |
| 7132 | TNFRSF1A | HTA11_696_2000001011 | Human | Colorectum | AD | 2.23e-05 | 3.82e-01 | -0.1464 |
| 7132 | TNFRSF1A | HTA11_1391_2000001011 | Human | Colorectum | AD | 9.65e-07 | 4.56e-01 | -0.059 |
| 7132 | TNFRSF1A | HTA11_7696_3000711011 | Human | Colorectum | AD | 4.38e-03 | 1.37e-01 | 0.0674 |
| 7132 | TNFRSF1A | HTA11_99999971662_82457 | Human | Colorectum | MSS | 7.03e-04 | 2.34e-01 | 0.3859 |
| 7132 | TNFRSF1A | A015-C-203 | Human | Colorectum | FAP | 8.20e-03 | -1.17e-01 | -0.1294 |
| 7132 | TNFRSF1A | A002-C-205 | Human | Colorectum | FAP | 4.05e-02 | -1.45e-01 | -0.1236 |
| 7132 | TNFRSF1A | A002-C-016 | Human | Colorectum | FAP | 4.45e-04 | -1.44e-01 | 0.0521 |
| 7132 | TNFRSF1A | A002-C-116 | Human | Colorectum | FAP | 5.45e-03 | -1.57e-01 | -0.0452 |
| 7132 | TNFRSF1A | F034 | Human | Colorectum | FAP | 3.81e-02 | -1.41e-01 | -0.0665 |
| 7132 | TNFRSF1A | CRC-3-11773 | Human | Colorectum | CRC | 2.19e-02 | -8.51e-02 | 0.2564 |
| 7132 | TNFRSF1A | LZE2T | Human | Esophagus | ESCC | 4.29e-03 | 3.71e-02 | 0.082 |
| 7132 | TNFRSF1A | LZE3D | Human | Esophagus | HGIN | 5.58e-03 | 4.70e-01 | 0.0668 |
| 7132 | TNFRSF1A | LZE4T | Human | Esophagus | ESCC | 5.99e-16 | 2.96e-01 | 0.0811 |
| 7132 | TNFRSF1A | LZE5T | Human | Esophagus | ESCC | 1.41e-02 | 2.52e-01 | 0.0514 |
| 7132 | TNFRSF1A | LZE8T | Human | Esophagus | ESCC | 1.37e-05 | 3.36e-01 | 0.067 |
| 7132 | TNFRSF1A | LZE20T | Human | Esophagus | ESCC | 7.22e-09 | 2.15e-01 | 0.0662 |
| 7132 | TNFRSF1A | LZE22D1 | Human | Esophagus | HGIN | 3.91e-05 | 9.52e-02 | 0.0595 |
| Page: 1 2 3 4 5 6 7 8 9 |
| Tissue | Expression Dynamics | Abbreviation |
| Colorectum (GSE201348) |  | FAP: Familial adenomatous polyposis |
| CRC: Colorectal cancer | ||
| Colorectum (HTA11) |  | AD: Adenomas |
| SER: Sessile serrated lesions | ||
| MSI-H: Microsatellite-high colorectal cancer | ||
| MSS: Microsatellite stable colorectal cancer | ||
| Esophagus | 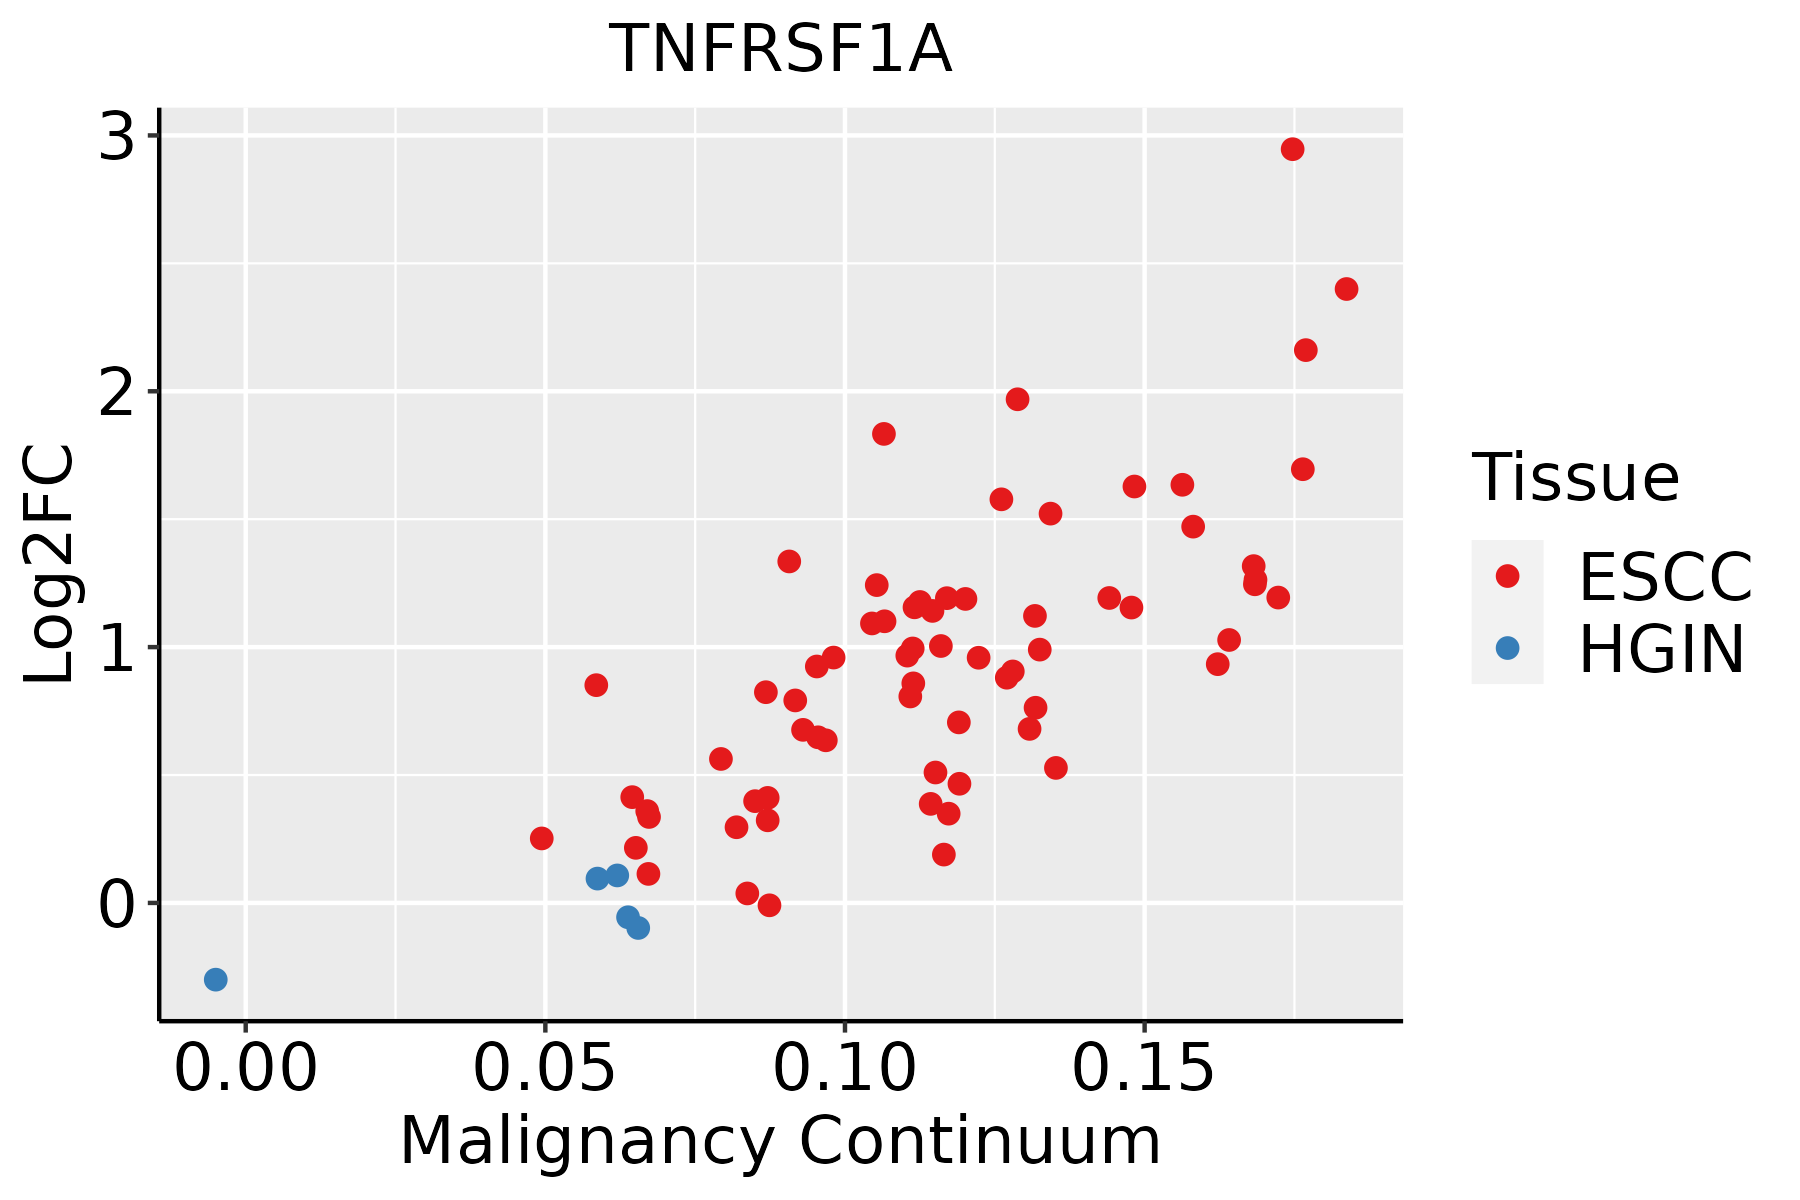 | ESCC: Esophageal squamous cell carcinoma |
| HGIN: High-grade intraepithelial neoplasias | ||
| LGIN: Low-grade intraepithelial neoplasias | ||
| GC | 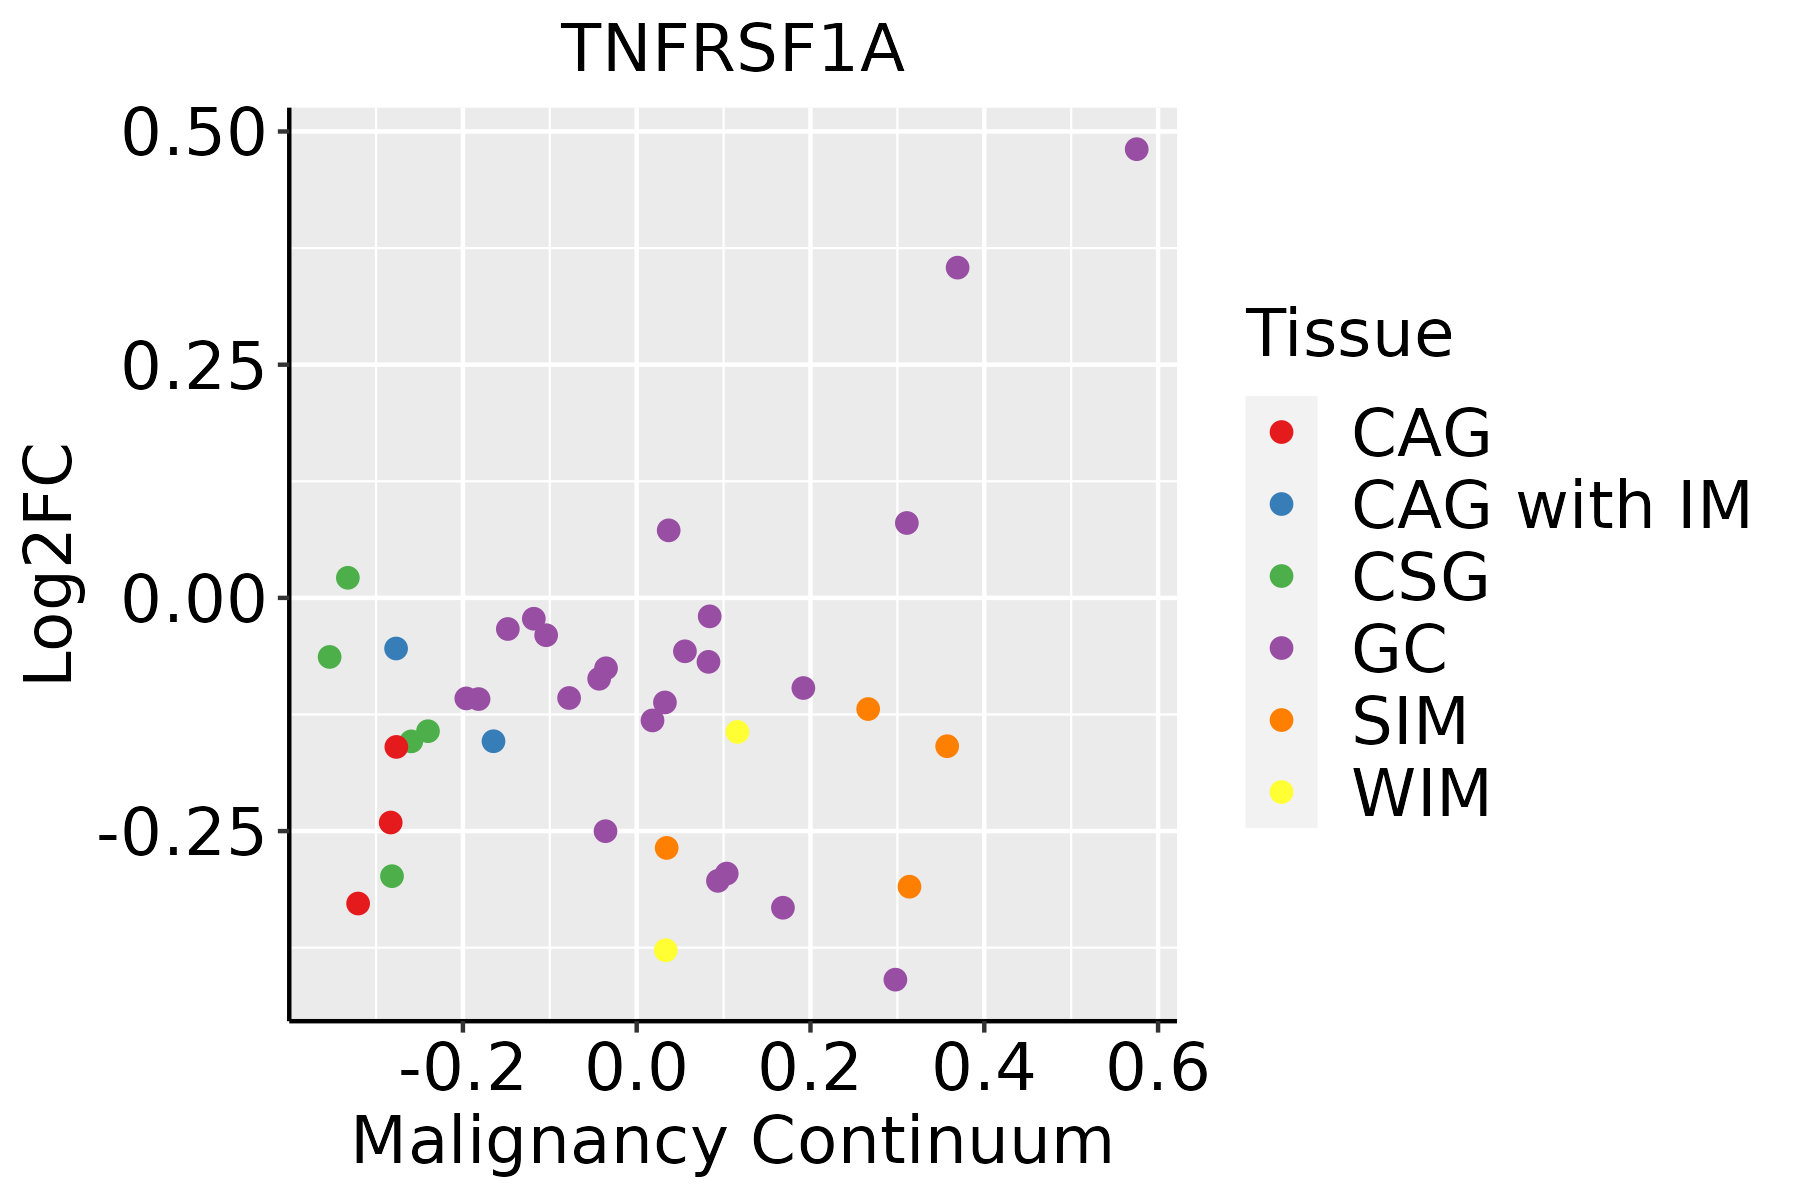 | CAG: Chronic atrophic gastritis |
| CAG with IM: Chronic atrophic gastritis with intestinal metaplasia | ||
| CSG: Chronic superficial gastritis | ||
| GC: Gastric cancer | ||
| SIM: Severe intestinal metaplasia | ||
| WIM: Wild intestinal metaplasia | ||
| Liver |  | HCC: Hepatocellular carcinoma |
| NAFLD: Non-alcoholic fatty liver disease | ||
| Oral Cavity |  | EOLP: Erosive Oral lichen planus |
| LP: leukoplakia | ||
| NEOLP: Non-erosive oral lichen planus | ||
| OSCC: Oral squamous cell carcinoma | ||
| Prostate |  | BPH: Benign Prostatic Hyperplasia |
| Skin |  | AK: Actinic keratosis |
| cSCC: Cutaneous squamous cell carcinoma | ||
| SCCIS:squamous cell carcinoma in situ | ||
| Thyroid |  | ATC: Anaplastic thyroid cancer |
| HT: Hashimoto's thyroiditis | ||
| PTC: Papillary thyroid cancer |
| ∗log2FC in expression of this searched gene in stem-like cells from each diseased tissue sample relative to stem-like cells in normal samples in each tissue plotted against the malignancy continuum. Samples are colored based on if they are from different disease stage. |
Top |
Malignant transformation related pathway analysis |
| Find out the enriched GO biological processes and KEGG pathways involved in transition from healthy to precancer to cancer |
| Tissue | Disease Stage | Enriched GO biological Processes |
| Colorectum | AD |  |
| Colorectum | SER |  |
| Colorectum | MSS |  |
| Colorectum | MSI-H |  |
| Colorectum | FAP |  |
| ∗Top 15 enriched GO BP terms are showed in the bar plot of each disease state in each tissue. Each row represents a significant GO biological process which is colored according to the -log10(p.adjust). |
| Page: 1 2 3 4 5 6 7 8 9 |
| GO ID | Tissue | Disease Stage | Description | Gene Ratio | Bg Ratio | pvalue | p.adjust | Count |
| GO:0072659 | Colorectum | AD | protein localization to plasma membrane | 122/3918 | 284/18723 | 2.86e-17 | 1.49e-14 | 122 |
| GO:1990778 | Colorectum | AD | protein localization to cell periphery | 129/3918 | 333/18723 | 5.51e-14 | 1.15e-11 | 129 |
| GO:0002064 | Colorectum | AD | epithelial cell development | 89/3918 | 220/18723 | 2.98e-11 | 3.52e-09 | 89 |
| GO:0097193 | Colorectum | AD | intrinsic apoptotic signaling pathway | 108/3918 | 288/18723 | 6.25e-11 | 6.41e-09 | 108 |
| GO:0061028 | Colorectum | AD | establishment of endothelial barrier | 23/3918 | 46/18723 | 1.14e-05 | 2.57e-04 | 23 |
| GO:0006631 | Colorectum | AD | fatty acid metabolic process | 114/3918 | 390/18723 | 5.58e-05 | 9.44e-04 | 114 |
| GO:0043123 | Colorectum | AD | positive regulation of I-kappaB kinase/NF-kappaB signaling | 60/3918 | 186/18723 | 1.91e-04 | 2.56e-03 | 60 |
| GO:0071496 | Colorectum | AD | cellular response to external stimulus | 94/3918 | 320/18723 | 1.98e-04 | 2.64e-03 | 94 |
| GO:0043122 | Colorectum | AD | regulation of I-kappaB kinase/NF-kappaB signaling | 76/3918 | 249/18723 | 2.17e-04 | 2.85e-03 | 76 |
| GO:0097191 | Colorectum | AD | extrinsic apoptotic signaling pathway | 68/3918 | 219/18723 | 2.64e-04 | 3.27e-03 | 68 |
| GO:0001885 | Colorectum | AD | endothelial cell development | 26/3918 | 64/18723 | 2.67e-04 | 3.29e-03 | 26 |
| GO:0007249 | Colorectum | AD | I-kappaB kinase/NF-kappaB signaling | 82/3918 | 281/18723 | 6.09e-04 | 6.40e-03 | 82 |
| GO:0003158 | Colorectum | AD | endothelium development | 44/3918 | 136/18723 | 1.20e-03 | 1.07e-02 | 44 |
| GO:0045446 | Colorectum | AD | endothelial cell differentiation | 39/3918 | 118/18723 | 1.42e-03 | 1.22e-02 | 39 |
| GO:0090257 | Colorectum | AD | regulation of muscle system process | 73/3918 | 252/18723 | 1.46e-03 | 1.24e-02 | 73 |
| GO:0008630 | Colorectum | AD | intrinsic apoptotic signaling pathway in response to DNA damage | 33/3918 | 99/18723 | 2.71e-03 | 2.05e-02 | 33 |
| GO:0043502 | Colorectum | AD | regulation of muscle adaptation | 31/3918 | 98/18723 | 8.45e-03 | 4.94e-02 | 31 |
| GO:00726591 | Colorectum | SER | protein localization to plasma membrane | 92/2897 | 284/18723 | 6.36e-13 | 1.86e-10 | 92 |
| GO:19907781 | Colorectum | SER | protein localization to cell periphery | 98/2897 | 333/18723 | 6.09e-11 | 9.57e-09 | 98 |
| GO:00971931 | Colorectum | SER | intrinsic apoptotic signaling pathway | 87/2897 | 288/18723 | 1.67e-10 | 2.32e-08 | 87 |
| Page: 1 2 3 4 5 6 7 8 9 10 11 12 13 14 15 16 17 18 19 20 21 22 23 24 25 26 27 |
| Pathway ID | Tissue | Disease Stage | Description | Gene Ratio | Bg Ratio | pvalue | p.adjust | qvalue | Count |
| hsa05010 | Colorectum | AD | Alzheimer disease | 174/2092 | 384/8465 | 1.82e-19 | 9.26e-18 | 5.91e-18 | 174 |
| hsa04932 | Colorectum | AD | Non-alcoholic fatty liver disease | 90/2092 | 155/8465 | 4.83e-19 | 1.80e-17 | 1.15e-17 | 90 |
| hsa05014 | Colorectum | AD | Amyotrophic lateral sclerosis | 164/2092 | 364/8465 | 4.28e-18 | 1.27e-16 | 8.09e-17 | 164 |
| hsa05022 | Colorectum | AD | Pathways of neurodegeneration - multiple diseases | 201/2092 | 476/8465 | 4.54e-18 | 1.27e-16 | 8.09e-17 | 201 |
| hsa05171 | Colorectum | AD | Coronavirus disease - COVID-19 | 113/2092 | 232/8465 | 9.90e-16 | 2.55e-14 | 1.63e-14 | 113 |
| hsa05131 | Colorectum | AD | Shigellosis | 109/2092 | 247/8465 | 1.09e-11 | 2.44e-10 | 1.55e-10 | 109 |
| hsa05132 | Colorectum | AD | Salmonella infection | 102/2092 | 249/8465 | 7.65e-09 | 1.28e-07 | 8.17e-08 | 102 |
| hsa05417 | Colorectum | AD | Lipid and atherosclerosis | 73/2092 | 215/8465 | 1.31e-03 | 8.27e-03 | 5.27e-03 | 73 |
| hsa05170 | Colorectum | AD | Human immunodeficiency virus 1 infection | 72/2092 | 212/8465 | 1.40e-03 | 8.46e-03 | 5.39e-03 | 72 |
| hsa05163 | Colorectum | AD | Human cytomegalovirus infection | 75/2092 | 225/8465 | 2.00e-03 | 1.10e-02 | 7.01e-03 | 75 |
| hsa05160 | Colorectum | AD | Hepatitis C | 54/2092 | 157/8465 | 3.87e-03 | 1.96e-02 | 1.25e-02 | 54 |
| hsa05166 | Colorectum | AD | Human T-cell leukemia virus 1 infection | 72/2092 | 222/8465 | 5.24e-03 | 2.44e-02 | 1.55e-02 | 72 |
| hsa050101 | Colorectum | AD | Alzheimer disease | 174/2092 | 384/8465 | 1.82e-19 | 9.26e-18 | 5.91e-18 | 174 |
| hsa049321 | Colorectum | AD | Non-alcoholic fatty liver disease | 90/2092 | 155/8465 | 4.83e-19 | 1.80e-17 | 1.15e-17 | 90 |
| hsa050141 | Colorectum | AD | Amyotrophic lateral sclerosis | 164/2092 | 364/8465 | 4.28e-18 | 1.27e-16 | 8.09e-17 | 164 |
| hsa050221 | Colorectum | AD | Pathways of neurodegeneration - multiple diseases | 201/2092 | 476/8465 | 4.54e-18 | 1.27e-16 | 8.09e-17 | 201 |
| hsa051711 | Colorectum | AD | Coronavirus disease - COVID-19 | 113/2092 | 232/8465 | 9.90e-16 | 2.55e-14 | 1.63e-14 | 113 |
| hsa051311 | Colorectum | AD | Shigellosis | 109/2092 | 247/8465 | 1.09e-11 | 2.44e-10 | 1.55e-10 | 109 |
| hsa051321 | Colorectum | AD | Salmonella infection | 102/2092 | 249/8465 | 7.65e-09 | 1.28e-07 | 8.17e-08 | 102 |
| hsa054171 | Colorectum | AD | Lipid and atherosclerosis | 73/2092 | 215/8465 | 1.31e-03 | 8.27e-03 | 5.27e-03 | 73 |
| Page: 1 2 3 4 5 6 7 8 9 10 11 12 13 14 15 16 17 18 19 20 21 22 23 24 25 26 27 28 29 30 |
Top |
Cell-cell communication analysis |
| Identification of potential cell-cell interactions between two cell types and their ligand-receptor pairs for different disease states |
| Ligand | Receptor | LRpair | Pathway | Tissue | Disease Stage |
| TNF | TNFRSF1A | TNF_TNFRSF1A | TNF | Breast | ADJ |
| TNF | TNFRSF1A | TNF_TNFRSF1A | TNF | Breast | DCIS |
| TNF | TNFRSF1A | TNF_TNFRSF1A | TNF | Breast | Healthy |
| LTA | TNFRSF1A | LTA_TNFRSF1A | LT | Cervix | ADJ |
| TNF | TNFRSF1A | TNF_TNFRSF1A | TNF | Cervix | CC |
| TNF | TNFRSF1A | TNF_TNFRSF1A | TNF | Cervix | Healthy |
| TNF | TNFRSF1A | TNF_TNFRSF1A | TNF | Cervix | Precancer |
| TNF | TNFRSF1A | TNF_TNFRSF1A | TNF | Endometrium | ADJ |
| TNF | TNFRSF1A | TNF_TNFRSF1A | TNF | Endometrium | AEH |
| TNF | TNFRSF1A | TNF_TNFRSF1A | TNF | Endometrium | EEC |
| TNF | TNFRSF1A | TNF_TNFRSF1A | TNF | Endometrium | Healthy |
| LTA | TNFRSF1A | LTA_TNFRSF1A | LT | Esophagus | ESCC |
| TNF | TNFRSF1A | TNF_TNFRSF1A | TNF | GC | ADJ |
| TNF | TNFRSF1A | TNF_TNFRSF1A | TNF | HNSCC | ADJ |
| TNF | TNFRSF1A | TNF_TNFRSF1A | TNF | HNSCC | OSCC |
| TNF | TNFRSF1A | TNF_TNFRSF1A | TNF | HNSCC | Precancer |
| TNF | TNFRSF1A | TNF_TNFRSF1A | TNF | Liver | Healthy |
| TNF | TNFRSF1A | TNF_TNFRSF1A | TNF | Liver | Precancer |
| TNF | TNFRSF1A | TNF_TNFRSF1A | TNF | Lung | AAH |
| TNF | TNFRSF1A | TNF_TNFRSF1A | TNF | Lung | ADJ |
| Page: 1 |
Top |
Single-cell gene regulatory network inference analysis |
| Find out the significant the regulons (TFs) and the target genes of each regulon across cell types for different disease states |
| TF | Cell Type | Tissue | Disease Stage | Target Gene | RSS | Regulon Activity |
| ∗The dot plots of a searched regulon are shown for all cell subpopulations in each disease state of each tissue based on the regulon specific score inferred using pySCENIC and by calculating the average expression. |
| Page: 1 |
Top |
Somatic mutation of malignant transformation related genes |
| Annotation of somatic variants for genes involved in malignant transformation |
| Hugo Symbol | Variant Class | Variant Classification | dbSNP RS | HGVSc | HGVSp | HGVSp Short | SWISSPROT | BIOTYPE | SIFT | PolyPhen | Tumor Sample Barcode | Tissue | Histology | Sex | Age | Stage | Therapy Types | Drugs | Outcome |
| TNFRSF1A | SNV | Missense_Mutation | rs199961053 | c.167N>T | p.Ser56Leu | p.S56L | P19438 | protein_coding | deleterious(0) | possibly_damaging(0.591) | TCGA-AN-A046-01 | Breast | breast invasive carcinoma | Female | >=65 | I/II | Unknown | Unknown | SD |
| TNFRSF1A | SNV | Missense_Mutation | novel | c.829N>G | p.Pro277Ala | p.P277A | P19438 | protein_coding | tolerated(0.24) | benign(0) | TCGA-BH-A0B6-01 | Breast | breast invasive carcinoma | Female | <65 | I/II | Unknown | Unknown | SD |
| TNFRSF1A | SNV | Missense_Mutation | rs104895245 | c.265N>C | p.Phe89Leu | p.F89L | P19438 | protein_coding | deleterious(0.01) | possibly_damaging(0.898) | TCGA-BH-A1FN-01 | Breast | breast invasive carcinoma | Female | <65 | I/II | Unknown | Unknown | PD |
| TNFRSF1A | SNV | Missense_Mutation | c.74C>T | p.Ser25Leu | p.S25L | P19438 | protein_coding | tolerated(0.36) | benign(0.003) | TCGA-C8-A274-01 | Breast | breast invasive carcinoma | Female | <65 | I/II | Hormone Therapy | tamoxiphen | SD | |
| TNFRSF1A | SNV | Missense_Mutation | novel | c.977N>T | p.Ala326Val | p.A326V | P19438 | protein_coding | tolerated(0.5) | benign(0.028) | TCGA-2W-A8YY-01 | Cervix | cervical & endocervical cancer | Female | <65 | I/II | Chemotherapy | cisplatin | CR |
| TNFRSF1A | SNV | Missense_Mutation | c.364N>T | p.Asp122Tyr | p.D122Y | P19438 | protein_coding | deleterious(0) | probably_damaging(0.998) | TCGA-2W-A8YY-01 | Cervix | cervical & endocervical cancer | Female | <65 | I/II | Chemotherapy | cisplatin | CR | |
| TNFRSF1A | SNV | Missense_Mutation | rs201794033 | c.928N>T | p.Pro310Ser | p.P310S | P19438 | protein_coding | tolerated(0.13) | possibly_damaging(0.902) | TCGA-C5-A2LX-01 | Cervix | cervical & endocervical cancer | Female | <65 | I/II | Chemotherapy | cisplatin | SD |
| TNFRSF1A | SNV | Missense_Mutation | rs768168665 | c.1267N>T | p.Arg423Cys | p.R423C | P19438 | protein_coding | tolerated(0.15) | benign(0.153) | TCGA-5M-AAT6-01 | Colorectum | colon adenocarcinoma | Female | <65 | III/IV | Unknown | Unknown | PD |
| TNFRSF1A | SNV | Missense_Mutation | c.47N>C | p.Leu16Pro | p.L16P | P19438 | protein_coding | tolerated(0.14) | benign(0.026) | TCGA-AA-A022-01 | Colorectum | colon adenocarcinoma | Female | >=65 | I/II | Unknown | Unknown | SD | |
| TNFRSF1A | SNV | Missense_Mutation | rs199961053 | c.167N>T | p.Ser56Leu | p.S56L | P19438 | protein_coding | deleterious(0) | possibly_damaging(0.591) | TCGA-AZ-4315-01 | Colorectum | colon adenocarcinoma | Male | <65 | I/II | Unknown | Unknown | SD |
| Page: 1 2 3 4 5 |
Top |
Related drugs of malignant transformation related genes |
| Identification of chemicals and drugs interact with genes involved in malignant transfromation |
| (DGIdb 4.0) |
| Entrez ID | Symbol | Category | Interaction Types | Drug Claim Name | Drug Name | PMIDs |
| 7132 | TNFRSF1A | CELL SURFACE, DRUGGABLE GENOME | UVB | 9754576 | ||
| 7132 | TNFRSF1A | CELL SURFACE, DRUGGABLE GENOME | CYCLOPHOSPHAMIDE | CYCLOPHOSPHAMIDE | 9894568 | |
| 7132 | TNFRSF1A | CELL SURFACE, DRUGGABLE GENOME | infliximab | INFLIXIMAB | 22480748 | |
| 7132 | TNFRSF1A | CELL SURFACE, DRUGGABLE GENOME | Tumor necrosis factor alpha (TNF-alpha) inhibitors | 22480748,24776844,25311255 | ||
| 7132 | TNFRSF1A | CELL SURFACE, DRUGGABLE GENOME | 178101767 | |||
| 7132 | TNFRSF1A | CELL SURFACE, DRUGGABLE GENOME | 178101757 | |||
| 7132 | TNFRSF1A | CELL SURFACE, DRUGGABLE GENOME | adalimumab | ADALIMUMAB | 22480748 | |
| 7132 | TNFRSF1A | CELL SURFACE, DRUGGABLE GENOME | 178101766 | |||
| 7132 | TNFRSF1A | CELL SURFACE, DRUGGABLE GENOME | etanercept | ETANERCEPT | 22480748 | |
| 7132 | TNFRSF1A | CELL SURFACE, DRUGGABLE GENOME | CYT-6091 |
| Page: 1 |

Copyright 2023-Present -The University of Texas Health Science Center at Houston |