
|
|||||
|
 | |
| |
| |
| |
| |
| |
|
Gene: TNFRSF19 |
Gene summary for TNFRSF19 |
| Gene information | Species | Human | Gene symbol | TNFRSF19 | Gene ID | 55504 |
| Gene name | TNF receptor superfamily member 19 | |
| Gene Alias | TAJ | |
| Cytomap | 13q12.12 | |
| Gene Type | protein-coding | GO ID | GO:0000165 | UniProtAcc | Q9NS68 |
Top |
Malignant transformation analysis |
| Identification of the aberrant gene expression in precancerous and cancerous lesions by comparing the gene expression of stem-like cells in diseased tissues with normal stem cells |
| Entrez ID | Symbol | Replicates | Species | Organ | Tissue | Adj P-value | Log2FC | Malignancy |
| 55504 | TNFRSF19 | LZE7T | Human | Esophagus | ESCC | 6.60e-04 | 3.15e-01 | 0.0667 |
| 55504 | TNFRSF19 | P2T-E | Human | Esophagus | ESCC | 1.90e-43 | 7.89e-01 | 0.1177 |
| 55504 | TNFRSF19 | P4T-E | Human | Esophagus | ESCC | 1.75e-08 | 3.80e-01 | 0.1323 |
| 55504 | TNFRSF19 | P8T-E | Human | Esophagus | ESCC | 4.14e-14 | 4.27e-01 | 0.0889 |
| 55504 | TNFRSF19 | P10T-E | Human | Esophagus | ESCC | 1.18e-10 | 1.32e-01 | 0.116 |
| 55504 | TNFRSF19 | P11T-E | Human | Esophagus | ESCC | 1.09e-03 | 3.84e-01 | 0.1426 |
| 55504 | TNFRSF19 | P15T-E | Human | Esophagus | ESCC | 1.99e-02 | 1.78e-01 | 0.1149 |
| 55504 | TNFRSF19 | P16T-E | Human | Esophagus | ESCC | 1.91e-36 | 6.36e-01 | 0.1153 |
| 55504 | TNFRSF19 | P26T-E | Human | Esophagus | ESCC | 5.96e-07 | 2.22e-01 | 0.1276 |
| 55504 | TNFRSF19 | P27T-E | Human | Esophagus | ESCC | 1.66e-09 | 2.53e-01 | 0.1055 |
| 55504 | TNFRSF19 | P32T-E | Human | Esophagus | ESCC | 3.03e-02 | 1.08e-01 | 0.1666 |
| 55504 | TNFRSF19 | P40T-E | Human | Esophagus | ESCC | 1.48e-02 | 1.54e-01 | 0.109 |
| 55504 | TNFRSF19 | P42T-E | Human | Esophagus | ESCC | 6.47e-03 | 1.90e-01 | 0.1175 |
| 55504 | TNFRSF19 | P49T-E | Human | Esophagus | ESCC | 1.70e-08 | 9.12e-01 | 0.1768 |
| 55504 | TNFRSF19 | P56T-E | Human | Esophagus | ESCC | 2.65e-06 | 1.52e+00 | 0.1613 |
| 55504 | TNFRSF19 | P57T-E | Human | Esophagus | ESCC | 1.45e-07 | 2.85e-01 | 0.0926 |
| 55504 | TNFRSF19 | P65T-E | Human | Esophagus | ESCC | 1.17e-02 | 5.82e-03 | 0.0978 |
| 55504 | TNFRSF19 | P76T-E | Human | Esophagus | ESCC | 1.88e-27 | 6.83e-01 | 0.1207 |
| 55504 | TNFRSF19 | P83T-E | Human | Esophagus | ESCC | 4.68e-15 | 5.63e-01 | 0.1738 |
| 55504 | TNFRSF19 | P107T-E | Human | Esophagus | ESCC | 2.67e-09 | 5.29e-02 | 0.171 |
| Page: 1 2 |
| Tissue | Expression Dynamics | Abbreviation |
| Esophagus |  | ESCC: Esophageal squamous cell carcinoma |
| HGIN: High-grade intraepithelial neoplasias | ||
| LGIN: Low-grade intraepithelial neoplasias | ||
| Liver |  | HCC: Hepatocellular carcinoma |
| NAFLD: Non-alcoholic fatty liver disease | ||
| Skin | 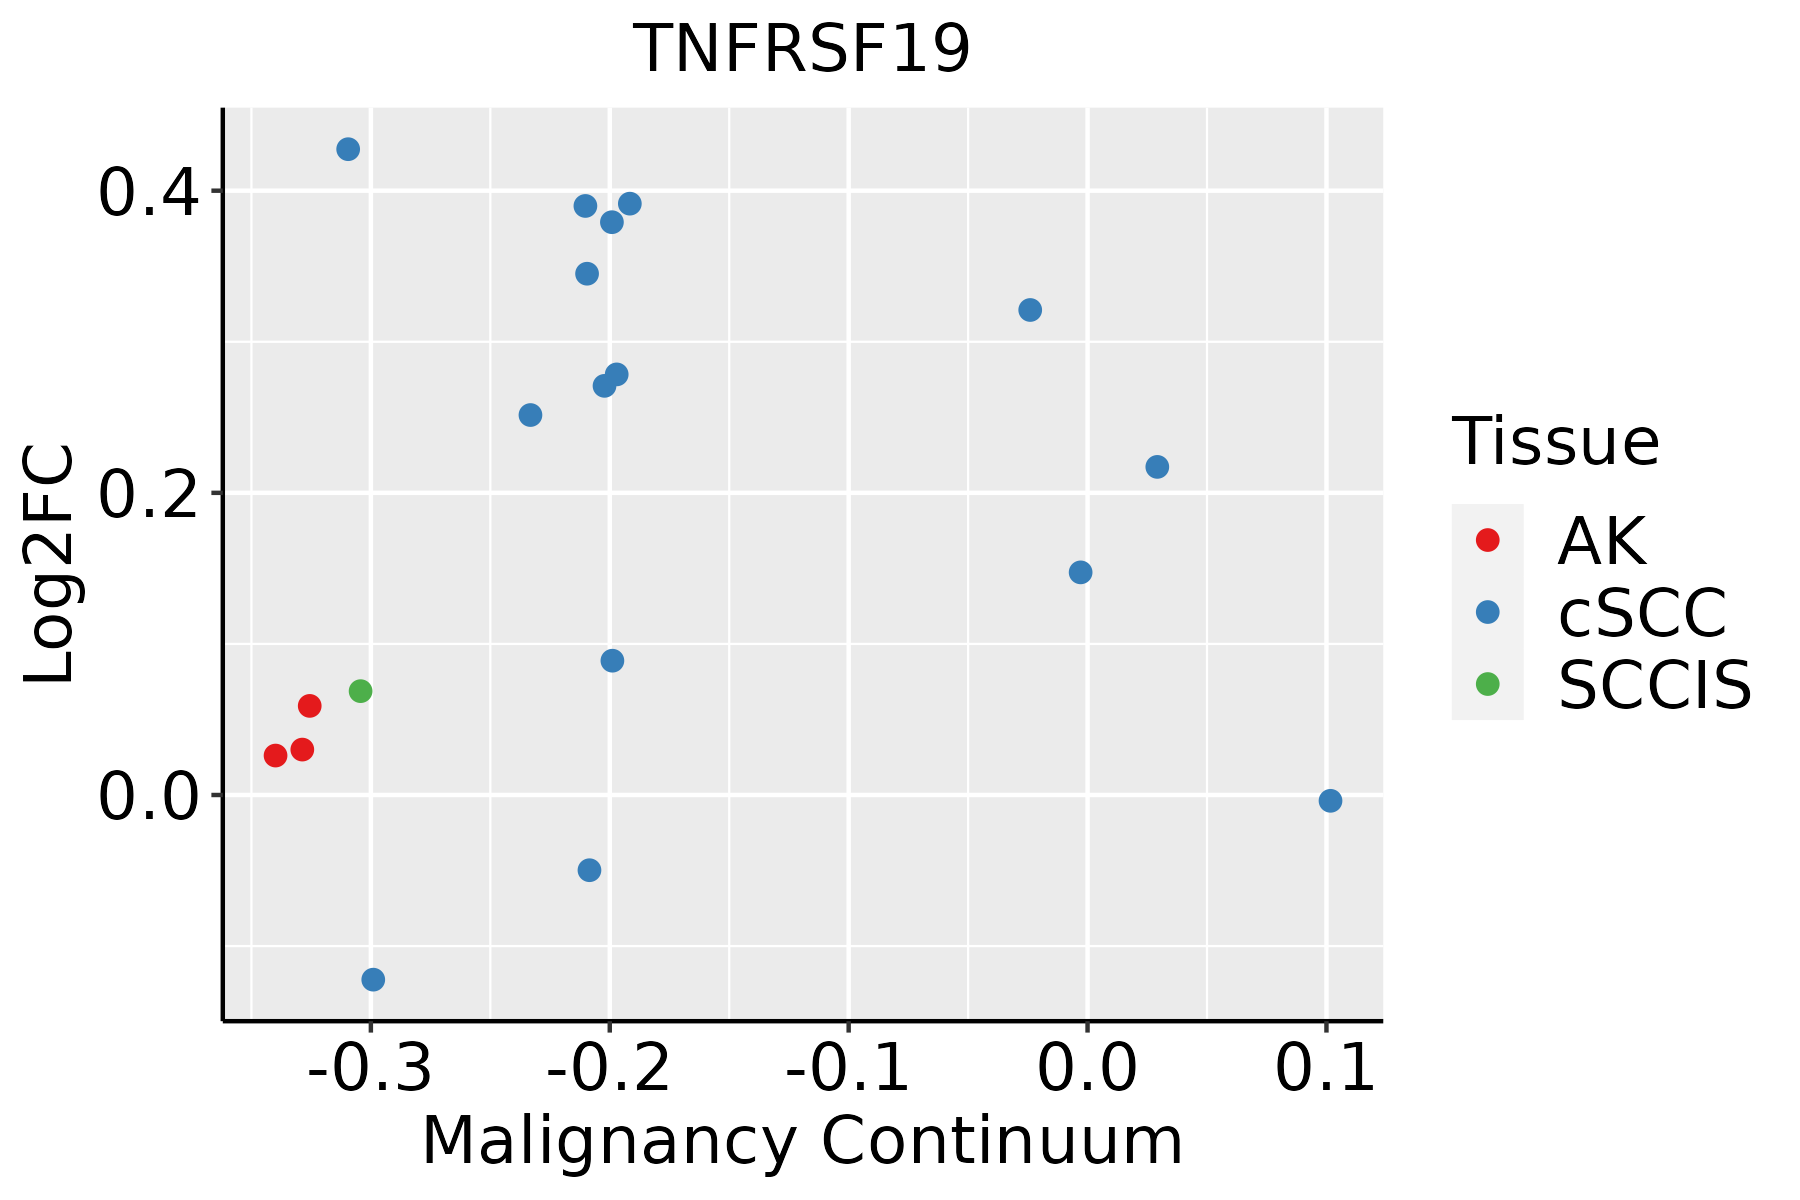 | AK: Actinic keratosis |
| cSCC: Cutaneous squamous cell carcinoma | ||
| SCCIS:squamous cell carcinoma in situ | ||
| Thyroid |  | ATC: Anaplastic thyroid cancer |
| HT: Hashimoto's thyroiditis | ||
| PTC: Papillary thyroid cancer |
| ∗log2FC in expression of this searched gene in stem-like cells from each diseased tissue sample relative to stem-like cells in normal samples in each tissue plotted against the malignancy continuum. Samples are colored based on if they are from different disease stage. |
Top |
Malignant transformation related pathway analysis |
| Find out the enriched GO biological processes and KEGG pathways involved in transition from healthy to precancer to cancer |
| Tissue | Disease Stage | Enriched GO biological Processes |
| Colorectum | AD |  |
| Colorectum | SER |  |
| Colorectum | MSS |  |
| Colorectum | MSI-H |  |
| Colorectum | FAP |  |
| ∗Top 15 enriched GO BP terms are showed in the bar plot of each disease state in each tissue. Each row represents a significant GO biological process which is colored according to the -log10(p.adjust). |
| Page: 1 2 3 4 5 6 7 8 9 |
| GO ID | Tissue | Disease Stage | Description | Gene Ratio | Bg Ratio | pvalue | p.adjust | Count |
| GO:004312318 | Esophagus | ESCC | positive regulation of I-kappaB kinase/NF-kappaB signaling | 132/8552 | 186/18723 | 2.07e-12 | 8.58e-11 | 132 |
| GO:0043122110 | Esophagus | ESCC | regulation of I-kappaB kinase/NF-kappaB signaling | 167/8552 | 249/18723 | 6.11e-12 | 2.32e-10 | 167 |
| GO:000724919 | Esophagus | ESCC | I-kappaB kinase/NF-kappaB signaling | 183/8552 | 281/18723 | 3.02e-11 | 1.01e-09 | 183 |
| GO:00435888 | Esophagus | ESCC | skin development | 163/8552 | 263/18723 | 6.48e-08 | 1.14e-06 | 163 |
| GO:003109818 | Esophagus | ESCC | stress-activated protein kinase signaling cascade | 154/8552 | 247/18723 | 8.53e-08 | 1.44e-06 | 154 |
| GO:000854410 | Esophagus | ESCC | epidermis development | 193/8552 | 324/18723 | 2.87e-07 | 4.19e-06 | 193 |
| GO:005140318 | Esophagus | ESCC | stress-activated MAPK cascade | 147/8552 | 239/18723 | 5.43e-07 | 7.18e-06 | 147 |
| GO:003320914 | Esophagus | ESCC | tumor necrosis factor-mediated signaling pathway | 67/8552 | 99/18723 | 7.87e-06 | 7.72e-05 | 67 |
| GO:007030217 | Esophagus | ESCC | regulation of stress-activated protein kinase signaling cascade | 119/8552 | 195/18723 | 1.07e-05 | 1.01e-04 | 119 |
| GO:003461220 | Esophagus | ESCC | response to tumor necrosis factor | 149/8552 | 253/18723 | 1.47e-05 | 1.33e-04 | 149 |
| GO:003287217 | Esophagus | ESCC | regulation of stress-activated MAPK cascade | 116/8552 | 192/18723 | 2.63e-05 | 2.21e-04 | 116 |
| GO:00072549 | Esophagus | ESCC | JNK cascade | 102/8552 | 167/18723 | 4.22e-05 | 3.39e-04 | 102 |
| GO:007135620 | Esophagus | ESCC | cellular response to tumor necrosis factor | 132/8552 | 229/18723 | 1.69e-04 | 1.11e-03 | 132 |
| GO:00463289 | Esophagus | ESCC | regulation of JNK cascade | 80/8552 | 133/18723 | 5.35e-04 | 2.95e-03 | 80 |
| GO:00224043 | Esophagus | ESCC | molting cycle process | 53/8552 | 84/18723 | 9.62e-04 | 4.88e-03 | 53 |
| GO:00224053 | Esophagus | ESCC | hair cycle process | 53/8552 | 84/18723 | 9.62e-04 | 4.88e-03 | 53 |
| GO:0001942 | Esophagus | ESCC | hair follicle development | 51/8552 | 81/18723 | 1.27e-03 | 6.14e-03 | 51 |
| GO:0098773 | Esophagus | ESCC | skin epidermis development | 53/8552 | 85/18723 | 1.43e-03 | 6.77e-03 | 53 |
| GO:00423033 | Esophagus | ESCC | molting cycle | 64/8552 | 107/18723 | 2.24e-03 | 9.85e-03 | 64 |
| GO:00426333 | Esophagus | ESCC | hair cycle | 64/8552 | 107/18723 | 2.24e-03 | 9.85e-03 | 64 |
| Page: 1 2 3 4 |
| Pathway ID | Tissue | Disease Stage | Description | Gene Ratio | Bg Ratio | pvalue | p.adjust | qvalue | Count |
| Page: 1 |
Top |
Cell-cell communication analysis |
| Identification of potential cell-cell interactions between two cell types and their ligand-receptor pairs for different disease states |
| Ligand | Receptor | LRpair | Pathway | Tissue | Disease Stage |
| Page: 1 |
Top |
Single-cell gene regulatory network inference analysis |
| Find out the significant the regulons (TFs) and the target genes of each regulon across cell types for different disease states |
| TF | Cell Type | Tissue | Disease Stage | Target Gene | RSS | Regulon Activity |
| ∗The dot plots of a searched regulon are shown for all cell subpopulations in each disease state of each tissue based on the regulon specific score inferred using pySCENIC and by calculating the average expression. |
| Page: 1 |
Top |
Somatic mutation of malignant transformation related genes |
| Annotation of somatic variants for genes involved in malignant transformation |
| Hugo Symbol | Variant Class | Variant Classification | dbSNP RS | HGVSc | HGVSp | HGVSp Short | SWISSPROT | BIOTYPE | SIFT | PolyPhen | Tumor Sample Barcode | Tissue | Histology | Sex | Age | Stage | Therapy Types | Drugs | Outcome |
| TNFRSF19 | SNV | Missense_Mutation | c.1196N>T | p.Asp399Val | p.D399V | Q9NS68 | protein_coding | deleterious_low_confidence(0.04) | benign(0.021) | TCGA-AN-A0AR-01 | Breast | breast invasive carcinoma | Female | <65 | I/II | Unknown | Unknown | SD | |
| TNFRSF19 | SNV | Missense_Mutation | c.979N>A | p.Pro327Thr | p.P327T | Q9NS68 | protein_coding | deleterious_low_confidence(0) | benign(0.306) | TCGA-EW-A1P0-01 | Breast | breast invasive carcinoma | Female | <65 | I/II | Hormone Therapy | arimidex | PD | |
| TNFRSF19 | SNV | Missense_Mutation | c.418N>T | p.Asp140Tyr | p.D140Y | Q9NS68 | protein_coding | deleterious(0) | probably_damaging(0.98) | TCGA-AA-3811-01 | Colorectum | colon adenocarcinoma | Female | >=65 | III/IV | Unknown | Unknown | PD | |
| TNFRSF19 | SNV | Missense_Mutation | rs115520634 | c.1034C>T | p.Thr345Met | p.T345M | Q9NS68 | protein_coding | deleterious_low_confidence(0.01) | possibly_damaging(0.736) | TCGA-AA-3864-01 | Colorectum | colon adenocarcinoma | Male | >=65 | I/II | Unknown | Unknown | SD |
| TNFRSF19 | SNV | Missense_Mutation | c.299N>A | p.Arg100His | p.R100H | Q9NS68 | protein_coding | deleterious(0.02) | probably_damaging(0.993) | TCGA-AA-A00N-01 | Colorectum | colon adenocarcinoma | Male | >=65 | I/II | Unknown | Unknown | PD | |
| TNFRSF19 | SNV | Missense_Mutation | c.871N>G | p.Thr291Ala | p.T291A | Q9NS68 | protein_coding | tolerated_low_confidence(0.9) | benign(0) | TCGA-AA-A01R-01 | Colorectum | colon adenocarcinoma | Male | <65 | III/IV | Chemotherapy | 5-fluorouracil | PD | |
| TNFRSF19 | SNV | Missense_Mutation | c.854N>T | p.Ala285Val | p.A285V | Q9NS68 | protein_coding | tolerated_low_confidence(1) | benign(0) | TCGA-AD-6964-01 | Colorectum | colon adenocarcinoma | Male | <65 | III/IV | Chemotherapy | folfox | PD | |
| TNFRSF19 | SNV | Missense_Mutation | novel | c.591N>G | p.Phe197Leu | p.F197L | Q9NS68 | protein_coding | tolerated(0.18) | benign(0.166) | TCGA-CA-6717-01 | Colorectum | colon adenocarcinoma | Male | <65 | I/II | Chemotherapy | oxaliplatin | CR |
| TNFRSF19 | SNV | Missense_Mutation | rs767042376 | c.1033N>G | p.Thr345Ala | p.T345A | Q9NS68 | protein_coding | tolerated_low_confidence(0.91) | benign(0.001) | TCGA-CK-4951-01 | Colorectum | colon adenocarcinoma | Female | >=65 | I/II | Unknown | Unknown | PD |
| TNFRSF19 | SNV | Missense_Mutation | c.271C>T | p.Pro91Ser | p.P91S | Q9NS68 | protein_coding | tolerated(0.08) | benign(0.297) | TCGA-CK-6746-01 | Colorectum | colon adenocarcinoma | Female | >=65 | I/II | Unknown | Unknown | SD |
| Page: 1 2 3 4 5 6 |
Top |
Related drugs of malignant transformation related genes |
| Identification of chemicals and drugs interact with genes involved in malignant transfromation |
| (DGIdb 4.0) |
| Entrez ID | Symbol | Category | Interaction Types | Drug Claim Name | Drug Name | PMIDs |
| Page: 1 |

Copyright 2023-Present -The University of Texas Health Science Center at Houston |