
|
|||||
|
 | |
| |
| |
| |
| |
| |
|
Gene: TNFRSF18 |
Gene summary for TNFRSF18 |
| Gene information | Species | Human | Gene symbol | TNFRSF18 | Gene ID | 8784 |
| Gene name | TNF receptor superfamily member 18 | |
| Gene Alias | AITR | |
| Cytomap | 1p36.33 | |
| Gene Type | protein-coding | GO ID | GO:0001932 | UniProtAcc | Q9Y5U5 |
Top |
Malignant transformation analysis |
| Identification of the aberrant gene expression in precancerous and cancerous lesions by comparing the gene expression of stem-like cells in diseased tissues with normal stem cells |
| Entrez ID | Symbol | Replicates | Species | Organ | Tissue | Adj P-value | Log2FC | Malignancy |
| 8784 | TNFRSF18 | LZE2T | Human | Esophagus | ESCC | 3.10e-10 | 8.20e-01 | 0.082 |
| 8784 | TNFRSF18 | LZE4T | Human | Esophagus | ESCC | 5.08e-37 | 1.13e+00 | 0.0811 |
| 8784 | TNFRSF18 | LZE7T | Human | Esophagus | ESCC | 9.74e-18 | 9.86e-01 | 0.0667 |
| 8784 | TNFRSF18 | LZE8T | Human | Esophagus | ESCC | 6.63e-05 | 2.92e-01 | 0.067 |
| 8784 | TNFRSF18 | LZE20T | Human | Esophagus | ESCC | 2.65e-13 | 5.25e-01 | 0.0662 |
| 8784 | TNFRSF18 | LZE21D1 | Human | Esophagus | HGIN | 5.86e-03 | 8.36e-01 | 0.0632 |
| 8784 | TNFRSF18 | LZE22T | Human | Esophagus | ESCC | 1.50e-08 | 5.73e-01 | 0.068 |
| 8784 | TNFRSF18 | LZE24T | Human | Esophagus | ESCC | 1.59e-05 | 2.69e-01 | 0.0596 |
| 8784 | TNFRSF18 | LZE21T | Human | Esophagus | ESCC | 4.48e-09 | 7.88e-01 | 0.0655 |
| 8784 | TNFRSF18 | P1T-E | Human | Esophagus | ESCC | 1.27e-06 | 4.75e-01 | 0.0875 |
| 8784 | TNFRSF18 | P2T-E | Human | Esophagus | ESCC | 1.47e-55 | 8.54e-01 | 0.1177 |
| 8784 | TNFRSF18 | P4T-E | Human | Esophagus | ESCC | 2.24e-45 | 1.16e+00 | 0.1323 |
| 8784 | TNFRSF18 | P5T-E | Human | Esophagus | ESCC | 2.90e-24 | 4.60e-01 | 0.1327 |
| 8784 | TNFRSF18 | P8T-E | Human | Esophagus | ESCC | 8.96e-21 | 4.18e-01 | 0.0889 |
| 8784 | TNFRSF18 | P9T-E | Human | Esophagus | ESCC | 5.89e-44 | 1.01e+00 | 0.1131 |
| 8784 | TNFRSF18 | P10T-E | Human | Esophagus | ESCC | 3.69e-22 | 3.98e-01 | 0.116 |
| 8784 | TNFRSF18 | P12T-E | Human | Esophagus | ESCC | 4.06e-38 | 7.21e-01 | 0.1122 |
| 8784 | TNFRSF18 | P15T-E | Human | Esophagus | ESCC | 8.42e-60 | 1.51e+00 | 0.1149 |
| 8784 | TNFRSF18 | P16T-E | Human | Esophagus | ESCC | 2.68e-16 | 2.45e-01 | 0.1153 |
| 8784 | TNFRSF18 | P20T-E | Human | Esophagus | ESCC | 4.16e-63 | 1.54e+00 | 0.1124 |
| Page: 1 2 3 4 5 |
| Tissue | Expression Dynamics | Abbreviation |
| Esophagus | 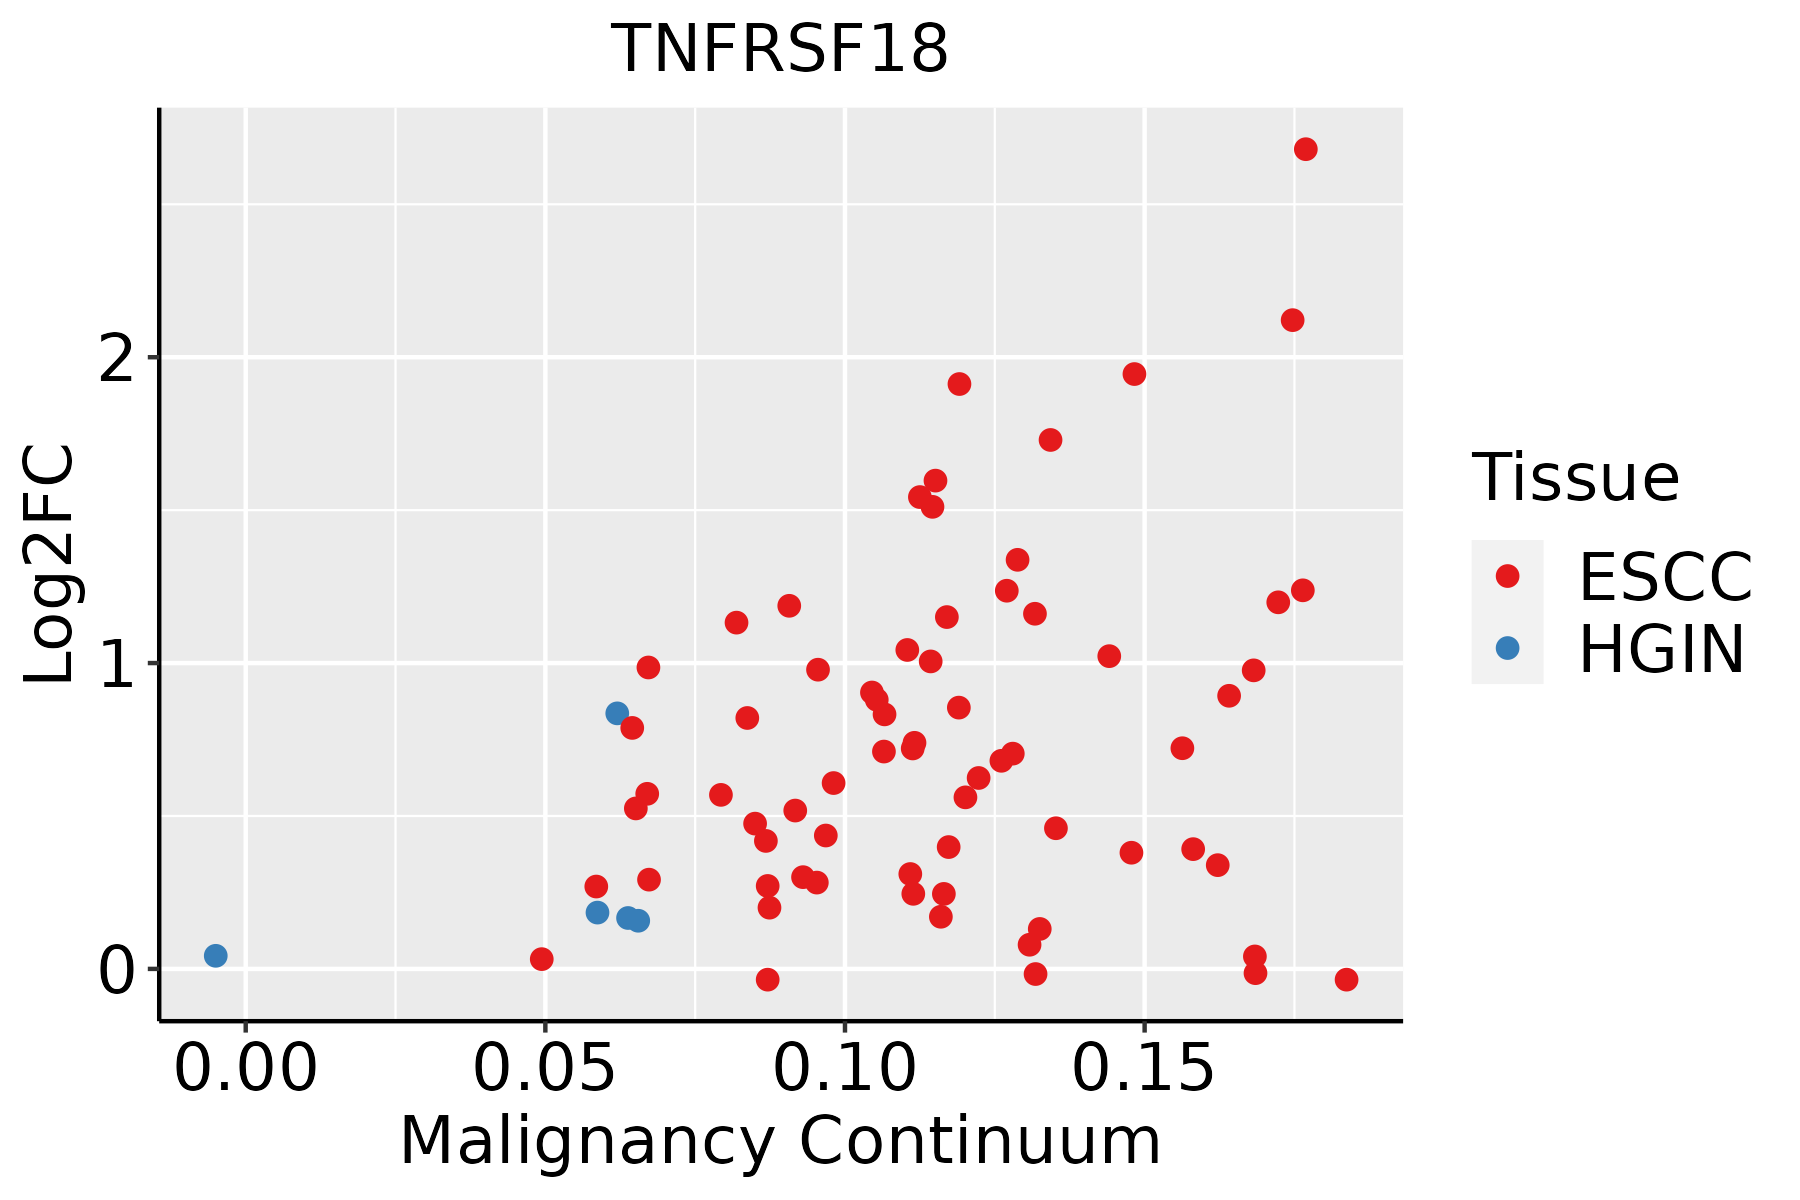 | ESCC: Esophageal squamous cell carcinoma |
| HGIN: High-grade intraepithelial neoplasias | ||
| LGIN: Low-grade intraepithelial neoplasias | ||
| Oral Cavity | 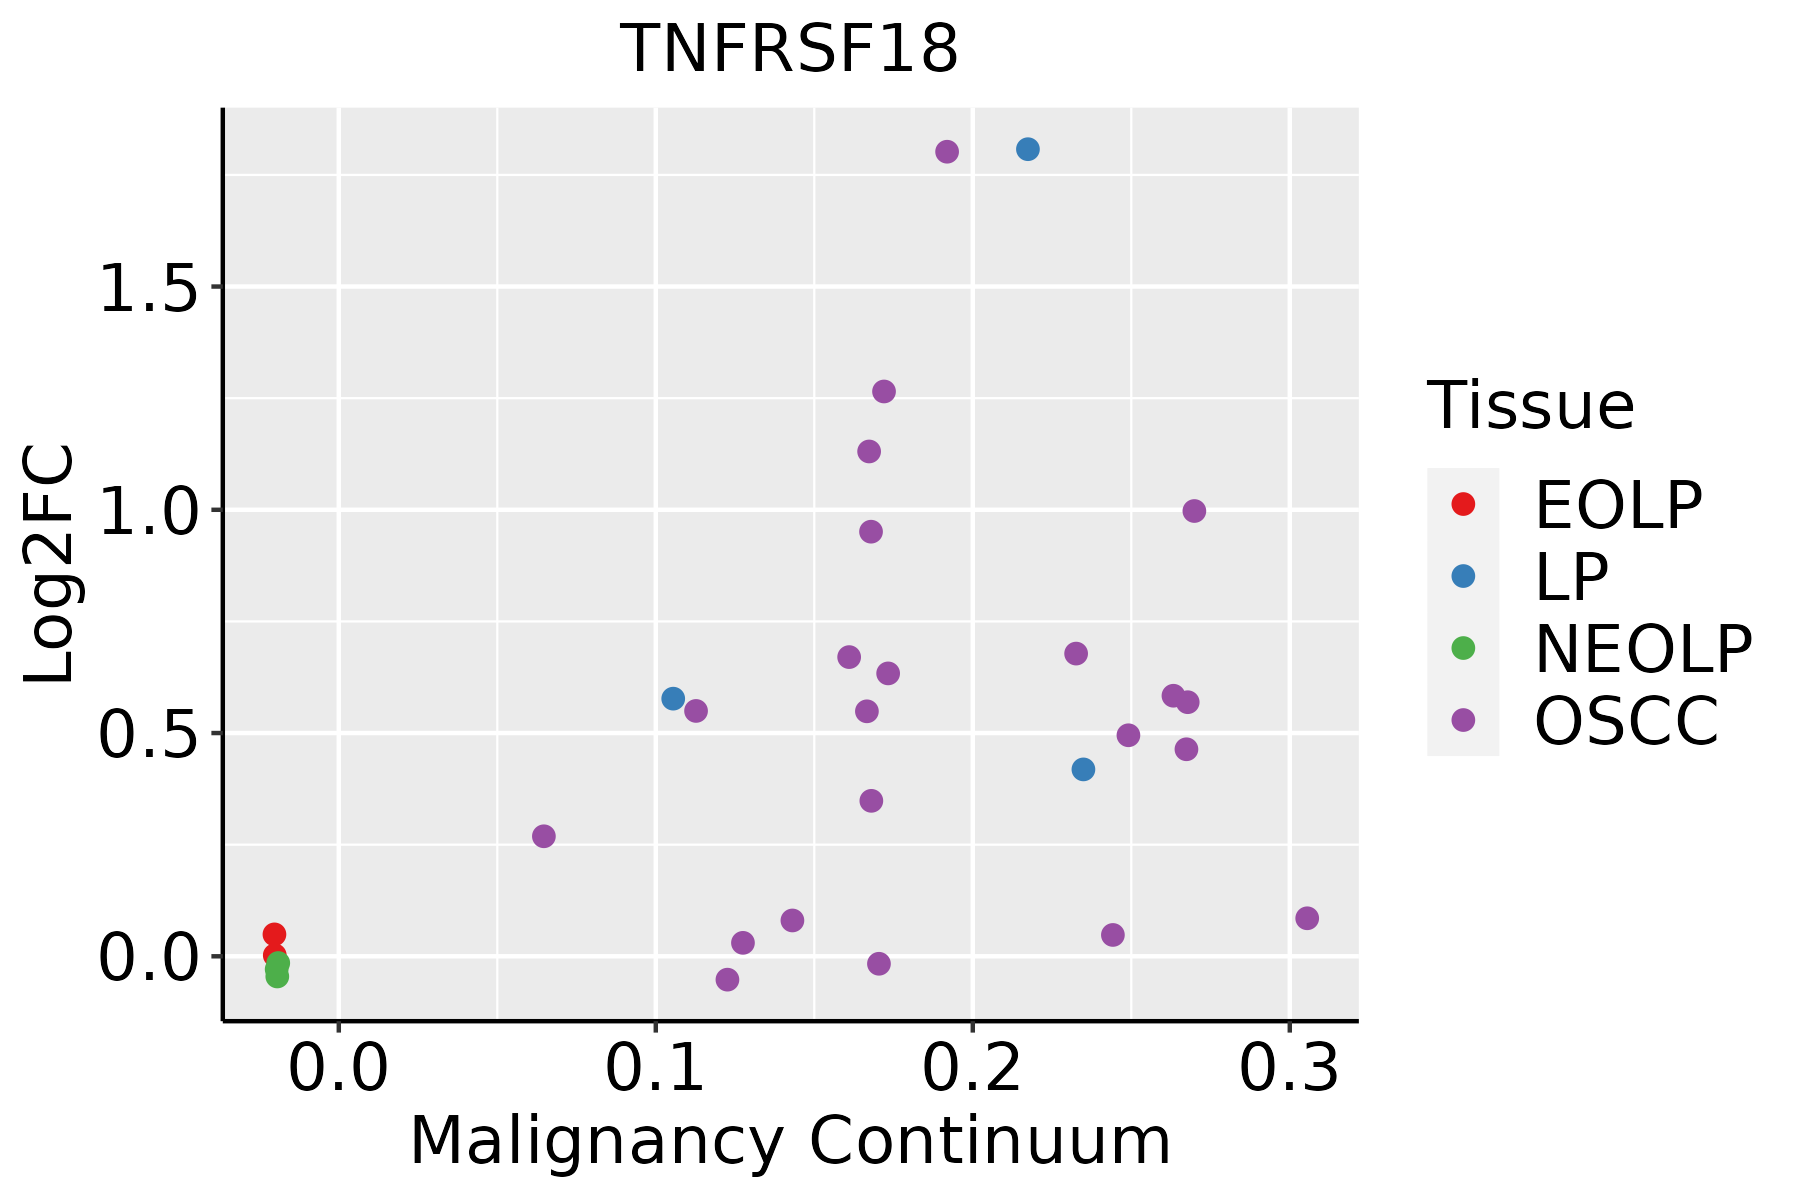 | EOLP: Erosive Oral lichen planus |
| LP: leukoplakia | ||
| NEOLP: Non-erosive oral lichen planus | ||
| OSCC: Oral squamous cell carcinoma | ||
| Skin | 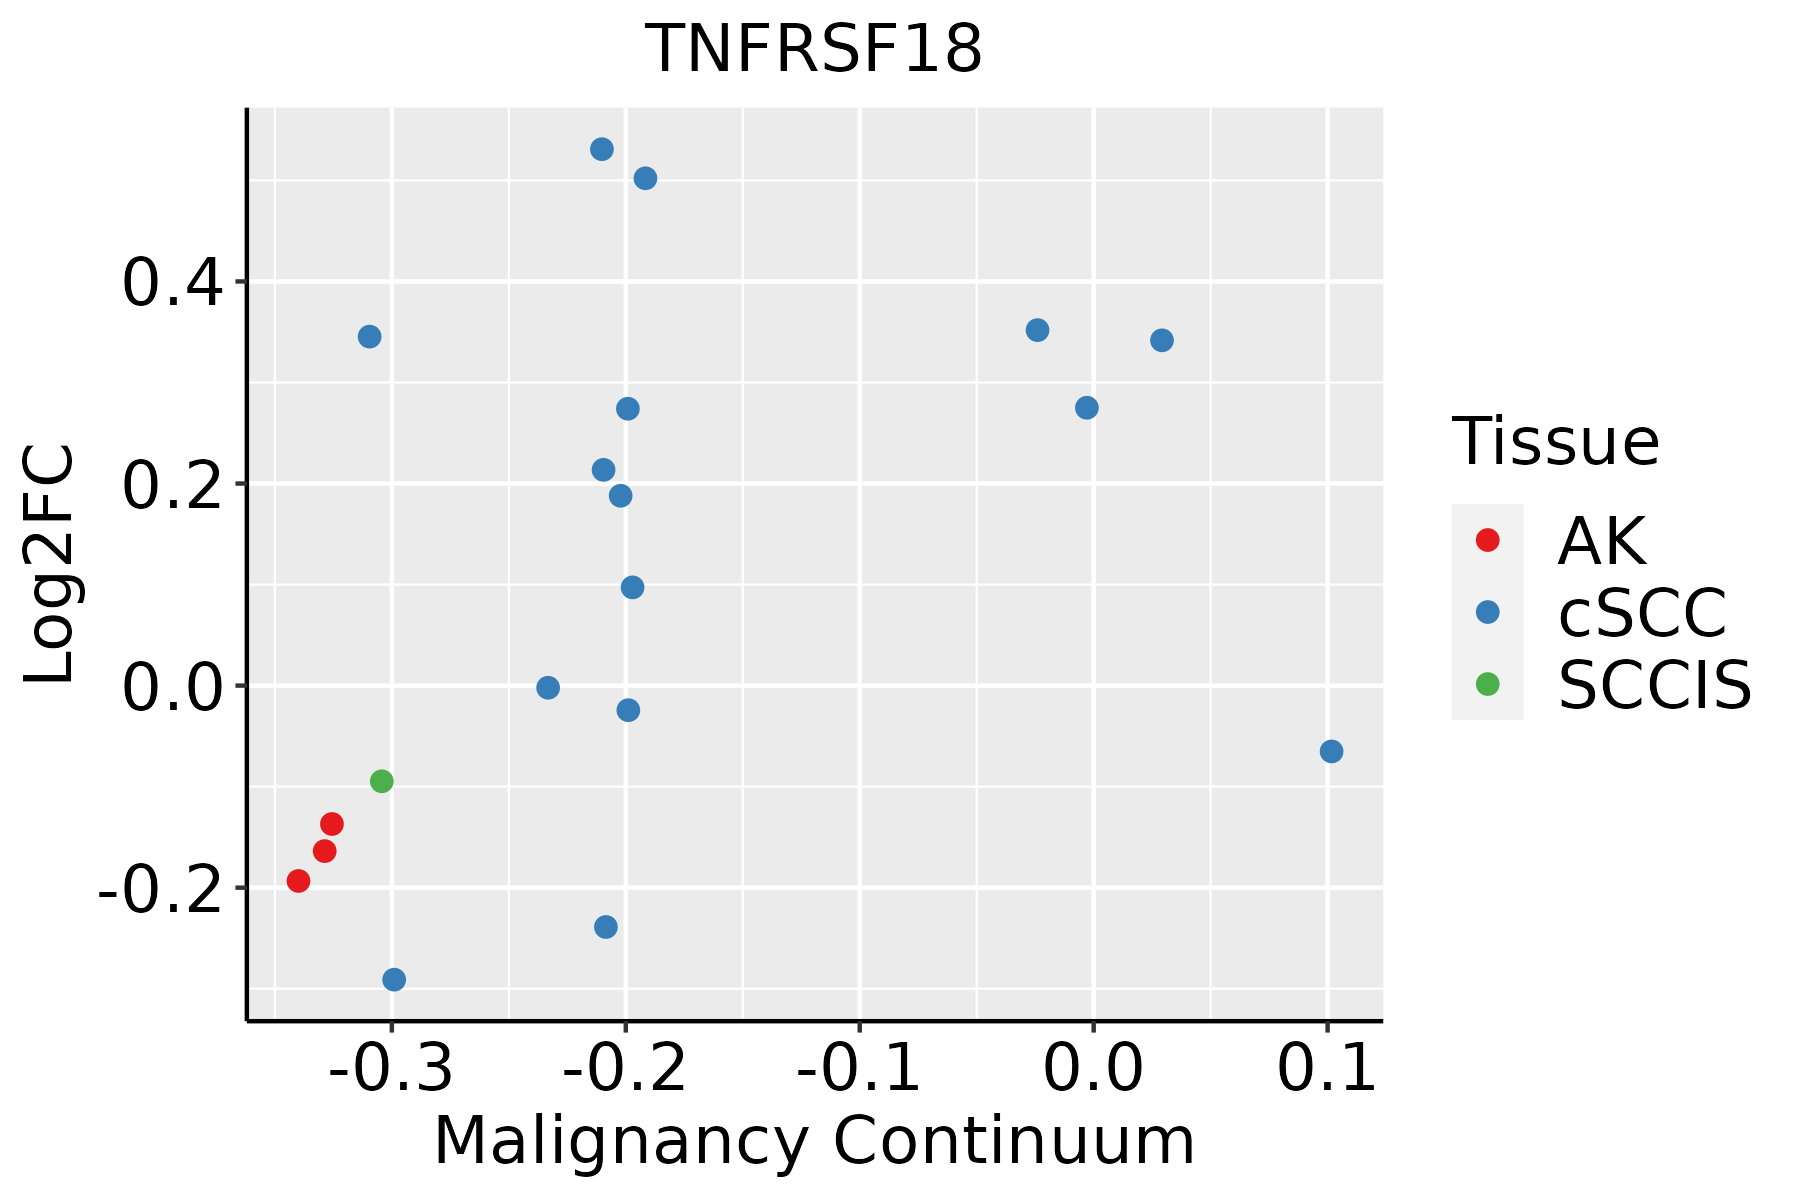 | AK: Actinic keratosis |
| cSCC: Cutaneous squamous cell carcinoma | ||
| SCCIS:squamous cell carcinoma in situ |
| ∗log2FC in expression of this searched gene in stem-like cells from each diseased tissue sample relative to stem-like cells in normal samples in each tissue plotted against the malignancy continuum. Samples are colored based on if they are from different disease stage. |
Top |
Malignant transformation related pathway analysis |
| Find out the enriched GO biological processes and KEGG pathways involved in transition from healthy to precancer to cancer |
| Tissue | Disease Stage | Enriched GO biological Processes |
| Colorectum | AD |  |
| Colorectum | SER |  |
| Colorectum | MSS |  |
| Colorectum | MSI-H |  |
| Colorectum | FAP |  |
| ∗Top 15 enriched GO BP terms are showed in the bar plot of each disease state in each tissue. Each row represents a significant GO biological process which is colored according to the -log10(p.adjust). |
| Page: 1 2 3 4 5 6 7 8 9 |
| GO ID | Tissue | Disease Stage | Description | Gene Ratio | Bg Ratio | pvalue | p.adjust | Count |
| GO:003320910 | Esophagus | HGIN | tumor necrosis factor-mediated signaling pathway | 26/2587 | 99/18723 | 7.45e-04 | 9.90e-03 | 26 |
| GO:004578527 | Esophagus | ESCC | positive regulation of cell adhesion | 255/8552 | 437/18723 | 5.07e-08 | 9.11e-07 | 255 |
| GO:003320914 | Esophagus | ESCC | tumor necrosis factor-mediated signaling pathway | 67/8552 | 99/18723 | 7.87e-06 | 7.72e-05 | 67 |
| GO:003461220 | Esophagus | ESCC | response to tumor necrosis factor | 149/8552 | 253/18723 | 1.47e-05 | 1.33e-04 | 149 |
| GO:007135620 | Esophagus | ESCC | cellular response to tumor necrosis factor | 132/8552 | 229/18723 | 1.69e-04 | 1.11e-03 | 132 |
| GO:00182124 | Esophagus | ESCC | peptidyl-tyrosine modification | 202/8552 | 378/18723 | 1.34e-03 | 6.39e-03 | 202 |
| GO:00181084 | Esophagus | ESCC | peptidyl-tyrosine phosphorylation | 200/8552 | 375/18723 | 1.60e-03 | 7.45e-03 | 200 |
| GO:00507303 | Esophagus | ESCC | regulation of peptidyl-tyrosine phosphorylation | 144/8552 | 264/18723 | 2.22e-03 | 9.78e-03 | 144 |
| GO:000268515 | Esophagus | ESCC | regulation of leukocyte migration | 114/8552 | 210/18723 | 7.26e-03 | 2.63e-02 | 114 |
| GO:003461218 | Oral cavity | OSCC | response to tumor necrosis factor | 143/7305 | 253/18723 | 1.09e-08 | 2.23e-07 | 143 |
| GO:004578520 | Oral cavity | OSCC | positive regulation of cell adhesion | 225/7305 | 437/18723 | 6.06e-08 | 1.09e-06 | 225 |
| GO:007135618 | Oral cavity | OSCC | cellular response to tumor necrosis factor | 128/7305 | 229/18723 | 1.49e-07 | 2.49e-06 | 128 |
| GO:00332099 | Oral cavity | OSCC | tumor necrosis factor-mediated signaling pathway | 61/7305 | 99/18723 | 4.31e-06 | 4.98e-05 | 61 |
| GO:000268714 | Oral cavity | OSCC | positive regulation of leukocyte migration | 78/7305 | 135/18723 | 7.43e-06 | 8.08e-05 | 78 |
| GO:000268510 | Oral cavity | OSCC | regulation of leukocyte migration | 108/7305 | 210/18723 | 1.63e-04 | 1.13e-03 | 108 |
| GO:00192214 | Oral cavity | OSCC | cytokine-mediated signaling pathway | 222/7305 | 472/18723 | 2.02e-04 | 1.35e-03 | 222 |
| GO:00182123 | Oral cavity | OSCC | peptidyl-tyrosine modification | 180/7305 | 378/18723 | 3.63e-04 | 2.22e-03 | 180 |
| GO:005090010 | Oral cavity | OSCC | leukocyte migration | 176/7305 | 369/18723 | 3.80e-04 | 2.31e-03 | 176 |
| GO:0050730 | Oral cavity | OSCC | regulation of peptidyl-tyrosine phosphorylation | 129/7305 | 264/18723 | 6.70e-04 | 3.75e-03 | 129 |
| GO:00181083 | Oral cavity | OSCC | peptidyl-tyrosine phosphorylation | 177/7305 | 375/18723 | 6.86e-04 | 3.83e-03 | 177 |
| Page: 1 2 |
| Pathway ID | Tissue | Disease Stage | Description | Gene Ratio | Bg Ratio | pvalue | p.adjust | qvalue | Count |
| Page: 1 |
Top |
Cell-cell communication analysis |
| Identification of potential cell-cell interactions between two cell types and their ligand-receptor pairs for different disease states |
| Ligand | Receptor | LRpair | Pathway | Tissue | Disease Stage |
| TNFSF18 | TNFRSF18 | TNFSF18_TNFRSF18 | GITRL | Esophagus | ESCC |
| Page: 1 |
Top |
Single-cell gene regulatory network inference analysis |
| Find out the significant the regulons (TFs) and the target genes of each regulon across cell types for different disease states |
| TF | Cell Type | Tissue | Disease Stage | Target Gene | RSS | Regulon Activity |
| ∗The dot plots of a searched regulon are shown for all cell subpopulations in each disease state of each tissue based on the regulon specific score inferred using pySCENIC and by calculating the average expression. |
| Page: 1 |
Top |
Somatic mutation of malignant transformation related genes |
| Annotation of somatic variants for genes involved in malignant transformation |
| Hugo Symbol | Variant Class | Variant Classification | dbSNP RS | HGVSc | HGVSp | HGVSp Short | SWISSPROT | BIOTYPE | SIFT | PolyPhen | Tumor Sample Barcode | Tissue | Histology | Sex | Age | Stage | Therapy Types | Drugs | Outcome |
| TNFRSF18 | SNV | Missense_Mutation | novel | c.472N>A | p.Asp158Asn | p.D158N | Q9Y5U5 | protein_coding | tolerated_low_confidence(0.09) | benign(0.021) | TCGA-A5-A2K5-01 | Endometrium | uterine corpus endometrioid carcinoma | Female | >=65 | I/II | Unknown | Unknown | SD |
| TNFRSF18 | SNV | Missense_Mutation | novel | c.596N>T | p.Ala199Val | p.A199V | Q9Y5U5 | protein_coding | deleterious_low_confidence(0.01) | benign(0.114) | TCGA-AP-A1DV-01 | Endometrium | uterine corpus endometrioid carcinoma | Female | <65 | I/II | Unknown | Unknown | SD |
| TNFRSF18 | SNV | Missense_Mutation | rs200799216 | c.677N>T | p.Ser226Leu | p.S226L | Q9Y5U5 | protein_coding | deleterious_low_confidence(0) | benign(0.045) | TCGA-B5-A1MR-01 | Endometrium | uterine corpus endometrioid carcinoma | Female | >=65 | III/IV | Unknown | Unknown | SD |
| TNFRSF18 | SNV | Missense_Mutation | rs768224024 | c.746N>A | p.Gly249Asp | p.G249D | Q9Y5U5 | protein_coding | deleterious_low_confidence(0.01) | benign(0.279) | TCGA-DF-A2KU-01 | Endometrium | uterine corpus endometrioid carcinoma | Female | Unknown | I/II | Unknown | Unknown | SD |
| TNFRSF18 | SNV | Missense_Mutation | rs767425028 | c.340N>A | p.Asp114Asn | p.D114N | Q9Y5U5 | protein_coding | deleterious_low_confidence(0.03) | benign(0.217) | TCGA-DF-A2KU-01 | Endometrium | uterine corpus endometrioid carcinoma | Female | Unknown | I/II | Unknown | Unknown | SD |
| TNFRSF18 | SNV | Missense_Mutation | c.395N>A | p.Thr132Lys | p.T132K | Q9Y5U5 | protein_coding | deleterious_low_confidence(0) | benign(0.242) | TCGA-FV-A4ZQ-01 | Liver | liver hepatocellular carcinoma | Male | <65 | I/II | Unknown | Unknown | SD | |
| TNFRSF18 | SNV | Missense_Mutation | rs531486834 | c.373N>A | p.Glu125Lys | p.E125K | Q9Y5U5 | protein_coding | deleterious_low_confidence(0.03) | benign(0.127) | TCGA-44-6776-01 | Lung | lung adenocarcinoma | Female | <65 | I/II | Unknown | Unknown | SD |
| TNFRSF18 | SNV | Missense_Mutation | novel | c.238N>A | p.His80Asn | p.H80N | Q9Y5U5 | protein_coding | deleterious_low_confidence(0.01) | probably_damaging(0.996) | TCGA-CV-6937-01 | Oral cavity | head & neck squamous cell carcinoma | Male | >=65 | I/II | Unknown | Unknown | SD |
| TNFRSF18 | deletion | Frame_Shift_Del | novel | c.415_428delCGCCGTCGACCGAA | p.Arg139AspfsTer29 | p.R139Dfs*29 | Q9Y5U5 | protein_coding | TCGA-DQ-5629-01 | Oral cavity | head & neck squamous cell carcinoma | Male | <65 | I/II | Chemotherapy | carboplatin | SD | ||
| TNFRSF18 | SNV | Missense_Mutation | novel | c.514G>A | p.Glu172Lys | p.E172K | Q9Y5U5 | protein_coding | deleterious_low_confidence(0) | probably_damaging(0.996) | TCGA-HU-8244-01 | Stomach | stomach adenocarcinoma | Female | >=65 | I/II | Unknown | Unknown | SD |
| Page: 1 |
Top |
Related drugs of malignant transformation related genes |
| Identification of chemicals and drugs interact with genes involved in malignant transfromation |
| (DGIdb 4.0) |
| Entrez ID | Symbol | Category | Interaction Types | Drug Claim Name | Drug Name | PMIDs |
| 8784 | TNFRSF18 | EXTERNAL SIDE OF PLASMA MEMBRANE, DRUGGABLE GENOME | 178101765 | |||
| 8784 | TNFRSF18 | EXTERNAL SIDE OF PLASMA MEMBRANE, DRUGGABLE GENOME | TRX518 | |||
| 8784 | TNFRSF18 | EXTERNAL SIDE OF PLASMA MEMBRANE, DRUGGABLE GENOME | INCAGN1876 | |||
| 8784 | TNFRSF18 | EXTERNAL SIDE OF PLASMA MEMBRANE, DRUGGABLE GENOME | TRX-518 | TRX-518 | ||
| 8784 | TNFRSF18 | EXTERNAL SIDE OF PLASMA MEMBRANE, DRUGGABLE GENOME | MK-4166 |
| Page: 1 |

Copyright 2023-Present -The University of Texas Health Science Center at Houston |