
|
|||||
|
 | |
| |
| |
| |
| |
| |
|
Gene: TNFRSF11B |
Gene summary for TNFRSF11B |
| Gene information | Species | Human | Gene symbol | TNFRSF11B | Gene ID | 4982 |
| Gene name | TNF receptor superfamily member 11b | |
| Gene Alias | OCIF | |
| Cytomap | 8q24.12 | |
| Gene Type | protein-coding | GO ID | GO:0001501 | UniProtAcc | O00300 |
Top |
Malignant transformation analysis |
| Identification of the aberrant gene expression in precancerous and cancerous lesions by comparing the gene expression of stem-like cells in diseased tissues with normal stem cells |
| Entrez ID | Symbol | Replicates | Species | Organ | Tissue | Adj P-value | Log2FC | Malignancy |
| 4982 | TNFRSF11B | LZE24T | Human | Esophagus | ESCC | 1.18e-06 | 4.12e-01 | 0.0596 |
| 4982 | TNFRSF11B | P12T-E | Human | Esophagus | ESCC | 1.41e-02 | 1.34e-01 | 0.1122 |
| 4982 | TNFRSF11B | P16T-E | Human | Esophagus | ESCC | 5.06e-31 | 1.45e+00 | 0.1153 |
| 4982 | TNFRSF11B | P56T-E | Human | Esophagus | ESCC | 6.75e-08 | 1.38e+00 | 0.1613 |
| 4982 | TNFRSF11B | P57T-E | Human | Esophagus | ESCC | 3.89e-12 | 9.83e-01 | 0.0926 |
| 4982 | TNFRSF11B | P74T-E | Human | Esophagus | ESCC | 5.61e-03 | 1.14e-01 | 0.1479 |
| 4982 | TNFRSF11B | P76T-E | Human | Esophagus | ESCC | 6.14e-15 | 5.71e-01 | 0.1207 |
| 4982 | TNFRSF11B | HCC1_Meng | Human | Liver | HCC | 2.25e-57 | 1.28e-01 | 0.0246 |
| 4982 | TNFRSF11B | HCC2_Meng | Human | Liver | HCC | 4.89e-04 | 1.35e-01 | 0.0107 |
| 4982 | TNFRSF11B | HCC2 | Human | Liver | HCC | 9.99e-03 | 5.91e-01 | 0.5341 |
| 4982 | TNFRSF11B | S027 | Human | Liver | HCC | 2.41e-05 | 1.12e+00 | 0.2446 |
| 4982 | TNFRSF11B | S028 | Human | Liver | HCC | 9.93e-19 | 8.69e-01 | 0.2503 |
| 4982 | TNFRSF11B | S029 | Human | Liver | HCC | 1.56e-13 | 6.05e-01 | 0.2581 |
| 4982 | TNFRSF11B | Adj_PTCwithHT_6 | Human | Thyroid | HT | 1.13e-11 | -4.16e-01 | 0.02 |
| 4982 | TNFRSF11B | PTCwithHT_6 | Human | Thyroid | HT | 9.15e-09 | -3.89e-01 | 0.02 |
| 4982 | TNFRSF11B | PTCwithHT_8 | Human | Thyroid | HT | 1.43e-09 | -3.95e-01 | 0.0351 |
| 4982 | TNFRSF11B | PTCwithoutHT_2 | Human | Thyroid | PTC | 1.13e-11 | -4.16e-01 | 0.0419 |
| 4982 | TNFRSF11B | male-WTA | Human | Thyroid | PTC | 4.92e-24 | -2.11e-01 | 0.1037 |
| 4982 | TNFRSF11B | PTC01 | Human | Thyroid | PTC | 1.01e-15 | -3.60e-01 | 0.1899 |
| 4982 | TNFRSF11B | PTC06 | Human | Thyroid | PTC | 1.67e-03 | -1.19e-01 | 0.2057 |
| Page: 1 2 |
| Tissue | Expression Dynamics | Abbreviation |
| Esophagus |  | ESCC: Esophageal squamous cell carcinoma |
| HGIN: High-grade intraepithelial neoplasias | ||
| LGIN: Low-grade intraepithelial neoplasias | ||
| Liver |  | HCC: Hepatocellular carcinoma |
| NAFLD: Non-alcoholic fatty liver disease | ||
| Thyroid | 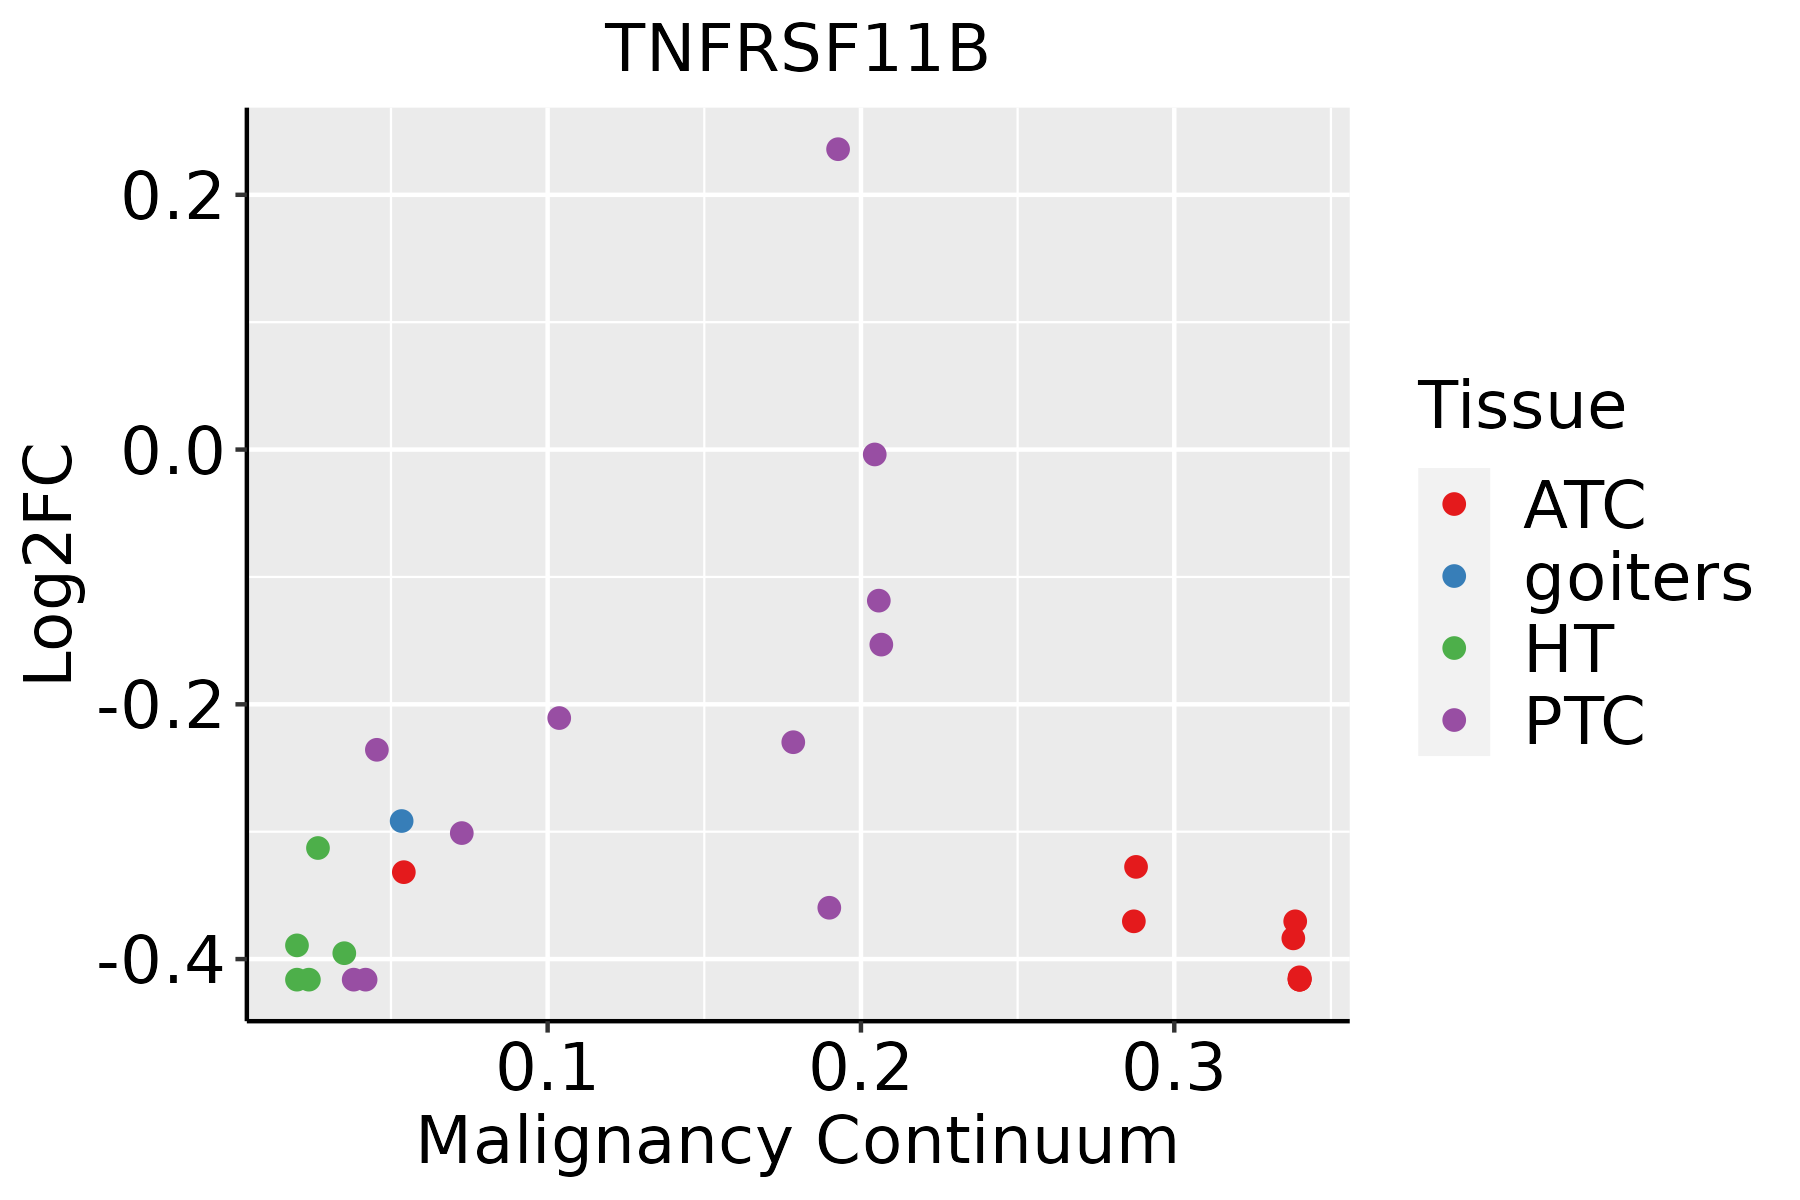 | ATC: Anaplastic thyroid cancer |
| HT: Hashimoto's thyroiditis | ||
| PTC: Papillary thyroid cancer |
| ∗log2FC in expression of this searched gene in stem-like cells from each diseased tissue sample relative to stem-like cells in normal samples in each tissue plotted against the malignancy continuum. Samples are colored based on if they are from different disease stage. |
Top |
Malignant transformation related pathway analysis |
| Find out the enriched GO biological processes and KEGG pathways involved in transition from healthy to precancer to cancer |
| Tissue | Disease Stage | Enriched GO biological Processes |
| Colorectum | AD |  |
| Colorectum | SER |  |
| Colorectum | MSS |  |
| Colorectum | MSI-H |  |
| Colorectum | FAP |  |
| ∗Top 15 enriched GO BP terms are showed in the bar plot of each disease state in each tissue. Each row represents a significant GO biological process which is colored according to the -log10(p.adjust). |
| Page: 1 2 3 4 5 6 7 8 9 |
| GO ID | Tissue | Disease Stage | Description | Gene Ratio | Bg Ratio | pvalue | p.adjust | Count |
| GO:0031667111 | Esophagus | ESCC | response to nutrient levels | 289/8552 | 474/18723 | 9.25e-12 | 3.47e-10 | 289 |
| GO:004668514 | Esophagus | ESCC | response to arsenic-containing substance | 30/8552 | 33/18723 | 5.73e-08 | 1.02e-06 | 30 |
| GO:000758410 | Esophagus | ESCC | response to nutrient | 114/8552 | 174/18723 | 9.43e-08 | 1.56e-06 | 114 |
| GO:000941020 | Esophagus | ESCC | response to xenobiotic stimulus | 253/8552 | 462/18723 | 4.55e-05 | 3.58e-04 | 253 |
| GO:001003827 | Esophagus | ESCC | response to metal ion | 208/8552 | 373/18723 | 5.02e-05 | 3.90e-04 | 208 |
| GO:00301984 | Esophagus | ESCC | extracellular matrix organization | 171/8552 | 301/18723 | 6.08e-05 | 4.67e-04 | 171 |
| GO:00430624 | Esophagus | ESCC | extracellular structure organization | 171/8552 | 302/18723 | 7.73e-05 | 5.76e-04 | 171 |
| GO:00452294 | Esophagus | ESCC | external encapsulating structure organization | 172/8552 | 304/18723 | 7.80e-05 | 5.80e-04 | 172 |
| GO:20000274 | Esophagus | ESCC | regulation of animal organ morphogenesis | 71/8552 | 125/18723 | 7.97e-03 | 2.84e-02 | 71 |
| GO:00436275 | Esophagus | ESCC | response to estrogen | 45/8552 | 75/18723 | 8.75e-03 | 3.08e-02 | 45 |
| GO:003166722 | Liver | HCC | response to nutrient levels | 276/7958 | 474/18723 | 2.30e-12 | 1.08e-10 | 276 |
| GO:000758421 | Liver | HCC | response to nutrient | 111/7958 | 174/18723 | 1.10e-08 | 2.73e-07 | 111 |
| GO:001003822 | Liver | HCC | response to metal ion | 208/7958 | 373/18723 | 1.35e-07 | 2.56e-06 | 208 |
| GO:000941022 | Liver | HCC | response to xenobiotic stimulus | 248/7958 | 462/18723 | 6.47e-07 | 1.02e-05 | 248 |
| GO:004668511 | Liver | HCC | response to arsenic-containing substance | 28/7958 | 33/18723 | 6.57e-07 | 1.03e-05 | 28 |
| GO:00436271 | Liver | HCC | response to estrogen | 44/7958 | 75/18723 | 3.44e-03 | 1.55e-02 | 44 |
| GO:001003830 | Thyroid | HT | response to metal ion | 50/1272 | 373/18723 | 3.12e-06 | 1.08e-04 | 50 |
| GO:006024917 | Thyroid | HT | anatomical structure homeostasis | 42/1272 | 314/18723 | 1.98e-05 | 4.60e-04 | 42 |
| GO:003166729 | Thyroid | HT | response to nutrient levels | 56/1272 | 474/18723 | 3.66e-05 | 7.57e-04 | 56 |
| GO:000189418 | Thyroid | HT | tissue homeostasis | 36/1272 | 268/18723 | 6.90e-05 | 1.26e-03 | 36 |
| Page: 1 2 |
| Pathway ID | Tissue | Disease Stage | Description | Gene Ratio | Bg Ratio | pvalue | p.adjust | qvalue | Count |
| Page: 1 |
Top |
Cell-cell communication analysis |
| Identification of potential cell-cell interactions between two cell types and their ligand-receptor pairs for different disease states |
| Ligand | Receptor | LRpair | Pathway | Tissue | Disease Stage |
| Page: 1 |
Top |
Single-cell gene regulatory network inference analysis |
| Find out the significant the regulons (TFs) and the target genes of each regulon across cell types for different disease states |
| TF | Cell Type | Tissue | Disease Stage | Target Gene | RSS | Regulon Activity |
| ∗The dot plots of a searched regulon are shown for all cell subpopulations in each disease state of each tissue based on the regulon specific score inferred using pySCENIC and by calculating the average expression. |
| Page: 1 |
Top |
Somatic mutation of malignant transformation related genes |
| Annotation of somatic variants for genes involved in malignant transformation |
| Hugo Symbol | Variant Class | Variant Classification | dbSNP RS | HGVSc | HGVSp | HGVSp Short | SWISSPROT | BIOTYPE | SIFT | PolyPhen | Tumor Sample Barcode | Tissue | Histology | Sex | Age | Stage | Therapy Types | Drugs | Outcome |
| TNFRSF11B | SNV | Missense_Mutation | c.953C>G | p.Ala318Gly | p.A318G | O00300 | protein_coding | deleterious(0.05) | benign(0.037) | TCGA-AR-A24L-01 | Breast | breast invasive carcinoma | Female | <65 | I/II | Hormone Therapy | tamoxiphen | PD | |
| TNFRSF11B | SNV | Missense_Mutation | rs760601102 | c.1042G>A | p.Ala348Thr | p.A348T | O00300 | protein_coding | tolerated(0.06) | benign(0.155) | TCGA-D8-A1JU-01 | Breast | breast invasive carcinoma | Female | <65 | I/II | Hormone Therapy | tamoxiphen | SD |
| TNFRSF11B | SNV | Missense_Mutation | c.568N>A | p.Glu190Lys | p.E190K | O00300 | protein_coding | tolerated(0.78) | benign(0.024) | TCGA-E2-A1IN-01 | Breast | breast invasive carcinoma | Female | <65 | I/II | Hormone Therapy | arimidex | SD | |
| TNFRSF11B | insertion | Frame_Shift_Ins | novel | c.844_845insTTTTATTAGAA | p.Gln282LeufsTer21 | p.Q282Lfs*21 | O00300 | protein_coding | TCGA-A2-A0CM-01 | Breast | breast invasive carcinoma | Female | <65 | I/II | Chemotherapy | adriamycin | PD | ||
| TNFRSF11B | insertion | Nonsense_Mutation | novel | c.861_862insTACTAAATATGGGAATGTCTAACTTAAATA | p.His287_Ala288insTyrTerIleTrpGluCysLeuThrTerIle | p.H287_A288insY*IWECLT*I | O00300 | protein_coding | TCGA-AN-A03X-01 | Breast | breast invasive carcinoma | Female | >=65 | I/II | Unknown | Unknown | SD | ||
| TNFRSF11B | insertion | Frame_Shift_Ins | novel | c.649_650insTTAAATTTAAAAAAGAAGAAGAAGAAGAAGAA | p.Pro217LeufsTer19 | p.P217Lfs*19 | O00300 | protein_coding | TCGA-B6-A0RE-01 | Breast | breast invasive carcinoma | Female | <65 | I/II | Unknown | Unknown | SD | ||
| TNFRSF11B | deletion | Frame_Shift_Del | novel | c.943delA | p.Thr315GlnfsTer2 | p.T315Qfs*2 | O00300 | protein_coding | TCGA-EW-A2FV-01 | Breast | breast invasive carcinoma | Female | <65 | III/IV | Chemotherapy | docetaxel | SD | ||
| TNFRSF11B | SNV | Missense_Mutation | c.1107N>G | p.Ile369Met | p.I369M | O00300 | protein_coding | tolerated(0.07) | benign(0.009) | TCGA-IR-A3LH-01 | Cervix | cervical & endocervical cancer | Female | <65 | I/II | Chemotherapy | cisplatin | CR | |
| TNFRSF11B | SNV | Missense_Mutation | novel | c.894N>C | p.Leu298Phe | p.L298F | O00300 | protein_coding | deleterious(0.01) | probably_damaging(0.999) | TCGA-MA-AA3Y-01 | Cervix | cervical & endocervical cancer | Female | <65 | I/II | Unknown | Unknown | SD |
| TNFRSF11B | SNV | Missense_Mutation | rs371566584 | c.256N>A | p.Val86Met | p.V86M | O00300 | protein_coding | deleterious(0.02) | benign(0.19) | TCGA-ZJ-AAXB-01 | Cervix | cervical & endocervical cancer | Female | <65 | I/II | Unknown | Unknown | SD |
| Page: 1 2 3 4 5 6 7 |
Top |
Related drugs of malignant transformation related genes |
| Identification of chemicals and drugs interact with genes involved in malignant transfromation |
| (DGIdb 4.0) |
| Entrez ID | Symbol | Category | Interaction Types | Drug Claim Name | Drug Name | PMIDs |
| 4982 | TNFRSF11B | DRUGGABLE GENOME | EPINEPHRINE | EPINEPHRINE | 11239501 | |
| 4982 | TNFRSF11B | DRUGGABLE GENOME | HORMONES | 10469275,10702390 | ||
| 4982 | TNFRSF11B | DRUGGABLE GENOME | anastrozole | ANASTROZOLE | ||
| 4982 | TNFRSF11B | DRUGGABLE GENOME | RISEDRONATE | RISEDRONIC ACID | 15777635 | |
| 4982 | TNFRSF11B | DRUGGABLE GENOME | TESTOSTERONE | TESTOSTERONE | 11932280 | |
| 4982 | TNFRSF11B | DRUGGABLE GENOME | TRAIL | 11912131,12915677 | ||
| 4982 | TNFRSF11B | DRUGGABLE GENOME | letrozole | LETROZOLE |
| Page: 1 |

Copyright 2023-Present -The University of Texas Health Science Center at Houston |