
|
|||||
|
 | |
| |
| |
| |
| |
| |
|
Gene: TNFRSF10D |
Gene summary for TNFRSF10D |
| Gene information | Species | Human | Gene symbol | TNFRSF10D | Gene ID | 8793 |
| Gene name | TNF receptor superfamily member 10d | |
| Gene Alias | CD264 | |
| Cytomap | 8p21.3 | |
| Gene Type | protein-coding | GO ID | GO:0006915 | UniProtAcc | Q9UBN6 |
Top |
Malignant transformation analysis |
| Identification of the aberrant gene expression in precancerous and cancerous lesions by comparing the gene expression of stem-like cells in diseased tissues with normal stem cells |
| Entrez ID | Symbol | Replicates | Species | Organ | Tissue | Adj P-value | Log2FC | Malignancy |
| 8793 | TNFRSF10D | AEH-subject1 | Human | Endometrium | AEH | 2.25e-44 | 9.55e-01 | -0.3059 |
| 8793 | TNFRSF10D | AEH-subject2 | Human | Endometrium | AEH | 9.08e-12 | 4.56e-01 | -0.2525 |
| 8793 | TNFRSF10D | AEH-subject3 | Human | Endometrium | AEH | 1.15e-15 | 5.17e-01 | -0.2576 |
| 8793 | TNFRSF10D | AEH-subject4 | Human | Endometrium | AEH | 1.38e-03 | 2.38e-01 | -0.2657 |
| 8793 | TNFRSF10D | EEC-subject1 | Human | Endometrium | EEC | 2.44e-07 | 2.29e-01 | -0.2682 |
| 8793 | TNFRSF10D | EEC-subject2 | Human | Endometrium | EEC | 1.03e-18 | 5.37e-01 | -0.2607 |
| 8793 | TNFRSF10D | TD9 | Human | Lung | IAC | 8.92e-03 | 6.57e-01 | 0.088 |
| 8793 | TNFRSF10D | RNA-P17T-P17T-8 | Human | Lung | IAC | 3.92e-04 | 5.71e-01 | 0.3329 |
| 8793 | TNFRSF10D | RNA-P3T-P3T-1 | Human | Lung | IAC | 1.79e-04 | 5.39e-01 | 0.1829 |
| 8793 | TNFRSF10D | RNA-P3T-P3T-2 | Human | Lung | IAC | 2.05e-02 | 4.50e-01 | 0.1835 |
| 8793 | TNFRSF10D | RNA-P3T-P3T-4 | Human | Lung | IAC | 1.14e-04 | 5.47e-01 | 0.1859 |
| 8793 | TNFRSF10D | RNA-P6T2-P6T2-1 | Human | Lung | IAC | 4.80e-02 | 2.33e-01 | -0.0166 |
| 8793 | TNFRSF10D | RNA-P6T2-P6T2-2 | Human | Lung | IAC | 5.58e-06 | 3.32e-01 | -0.0132 |
| 8793 | TNFRSF10D | RNA-P6T2-P6T2-3 | Human | Lung | IAC | 2.25e-02 | 1.95e-01 | -0.013 |
| 8793 | TNFRSF10D | RNA-P6T2-P6T2-4 | Human | Lung | IAC | 2.41e-04 | 2.90e-01 | -0.0121 |
| 8793 | TNFRSF10D | Pat01-B | Human | Stomach | GC | 1.21e-03 | 2.16e-01 | 0.5754 |
| 8793 | TNFRSF10D | Pat02-B | Human | Stomach | GC | 5.80e-05 | 9.89e-02 | 0.0368 |
| 8793 | TNFRSF10D | Pat04-B | Human | Stomach | GC | 3.73e-07 | 2.08e-01 | -0.1483 |
| 8793 | TNFRSF10D | Pat05-B | Human | Stomach | GC | 1.00e-04 | 2.14e-01 | -0.0353 |
| 8793 | TNFRSF10D | Pat06-B | Human | Stomach | GC | 9.98e-06 | 1.07e-01 | -0.1961 |
| Page: 1 2 |
| Tissue | Expression Dynamics | Abbreviation |
| Endometrium | 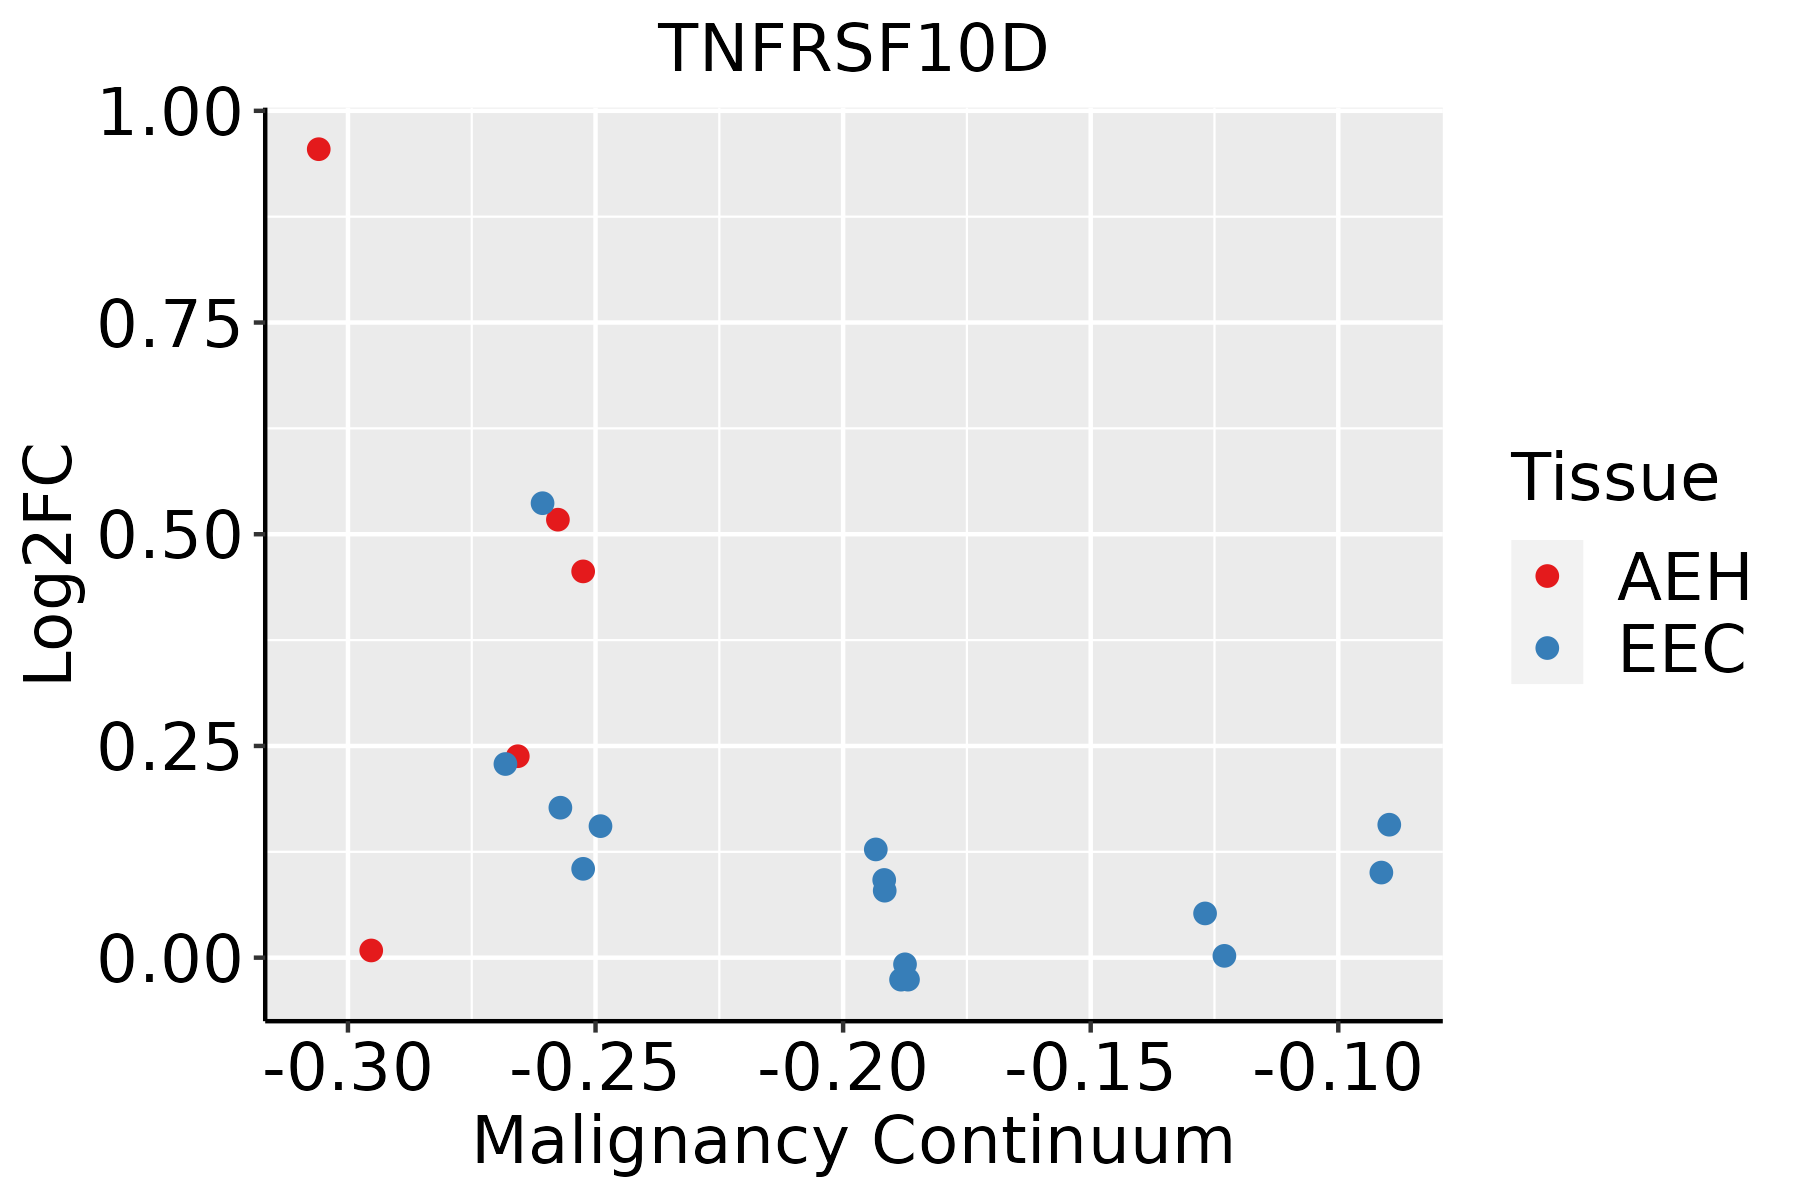 | AEH: Atypical endometrial hyperplasia |
| EEC: Endometrioid Cancer | ||
| GC | 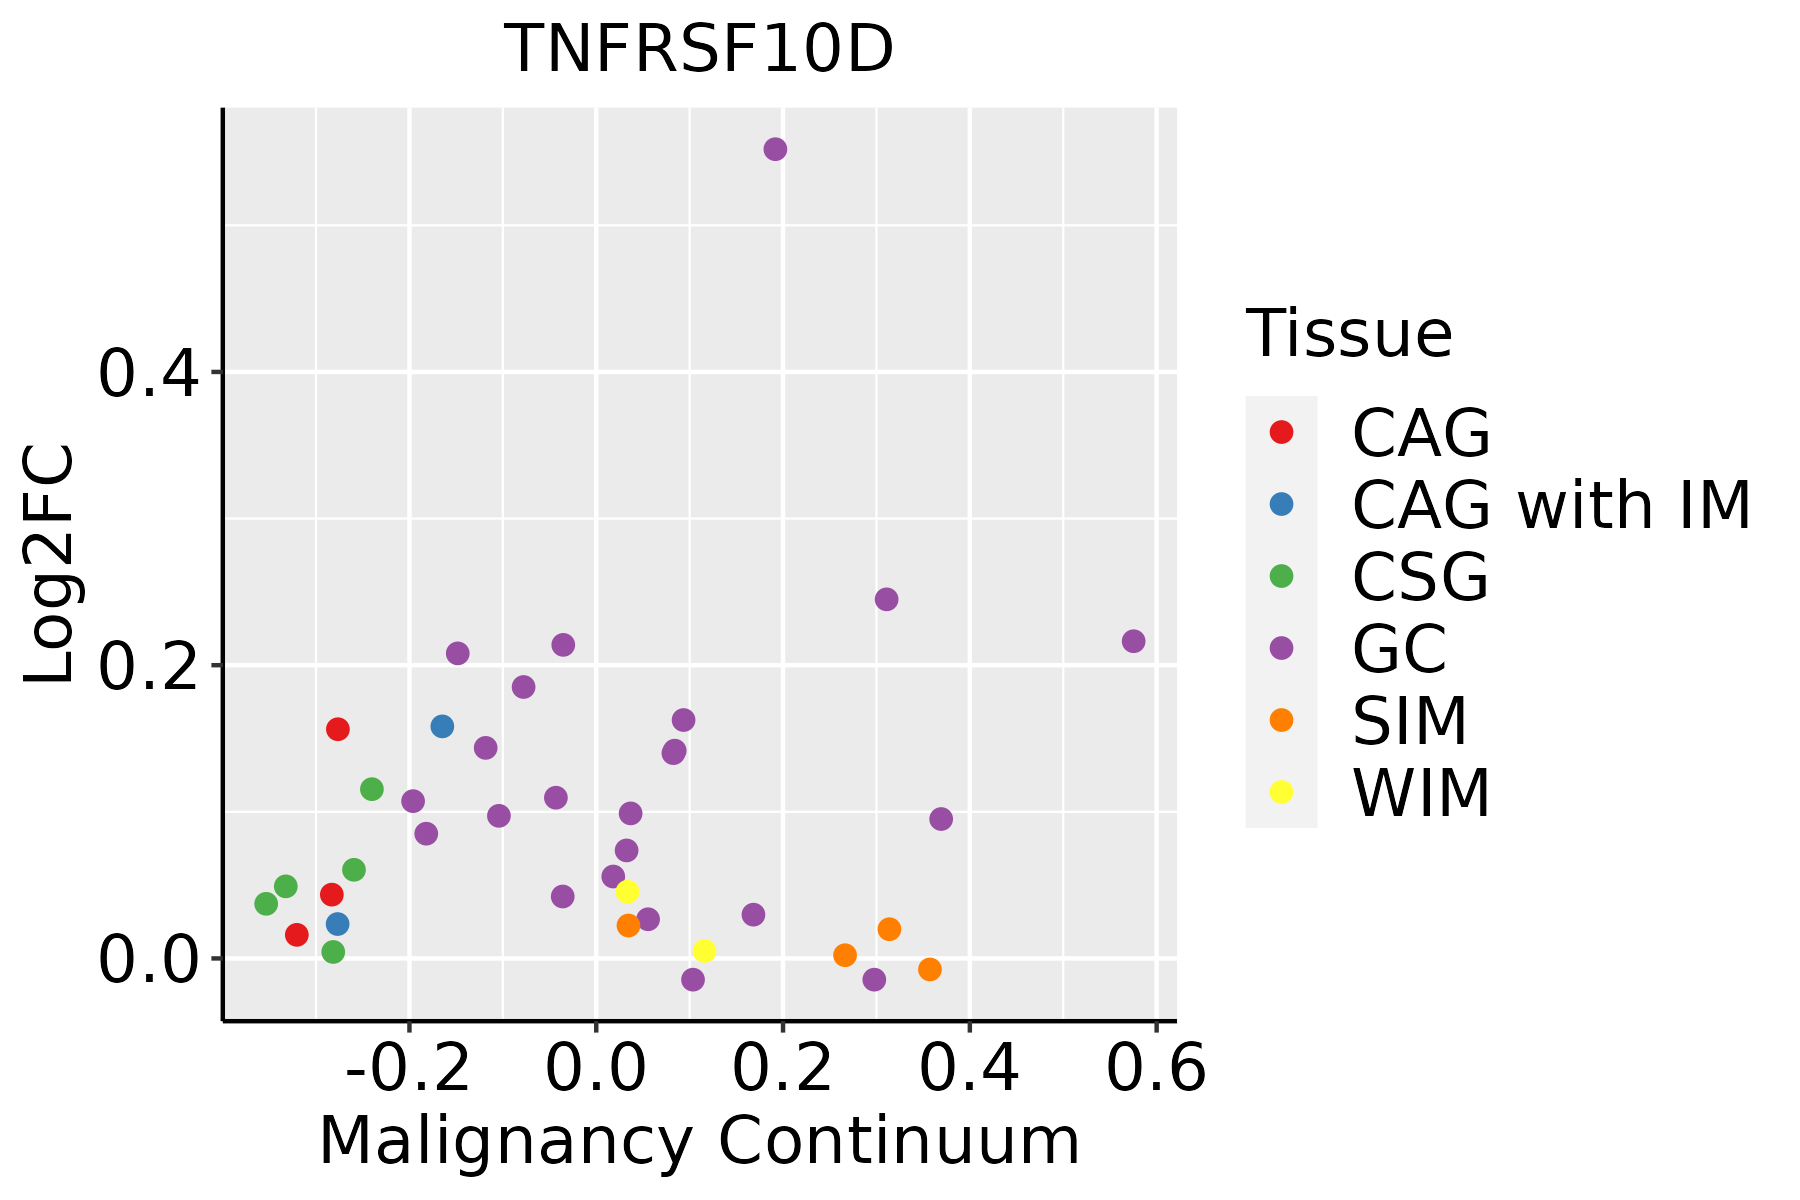 | CAG: Chronic atrophic gastritis |
| CAG with IM: Chronic atrophic gastritis with intestinal metaplasia | ||
| CSG: Chronic superficial gastritis | ||
| GC: Gastric cancer | ||
| SIM: Severe intestinal metaplasia | ||
| WIM: Wild intestinal metaplasia | ||
| Lung | 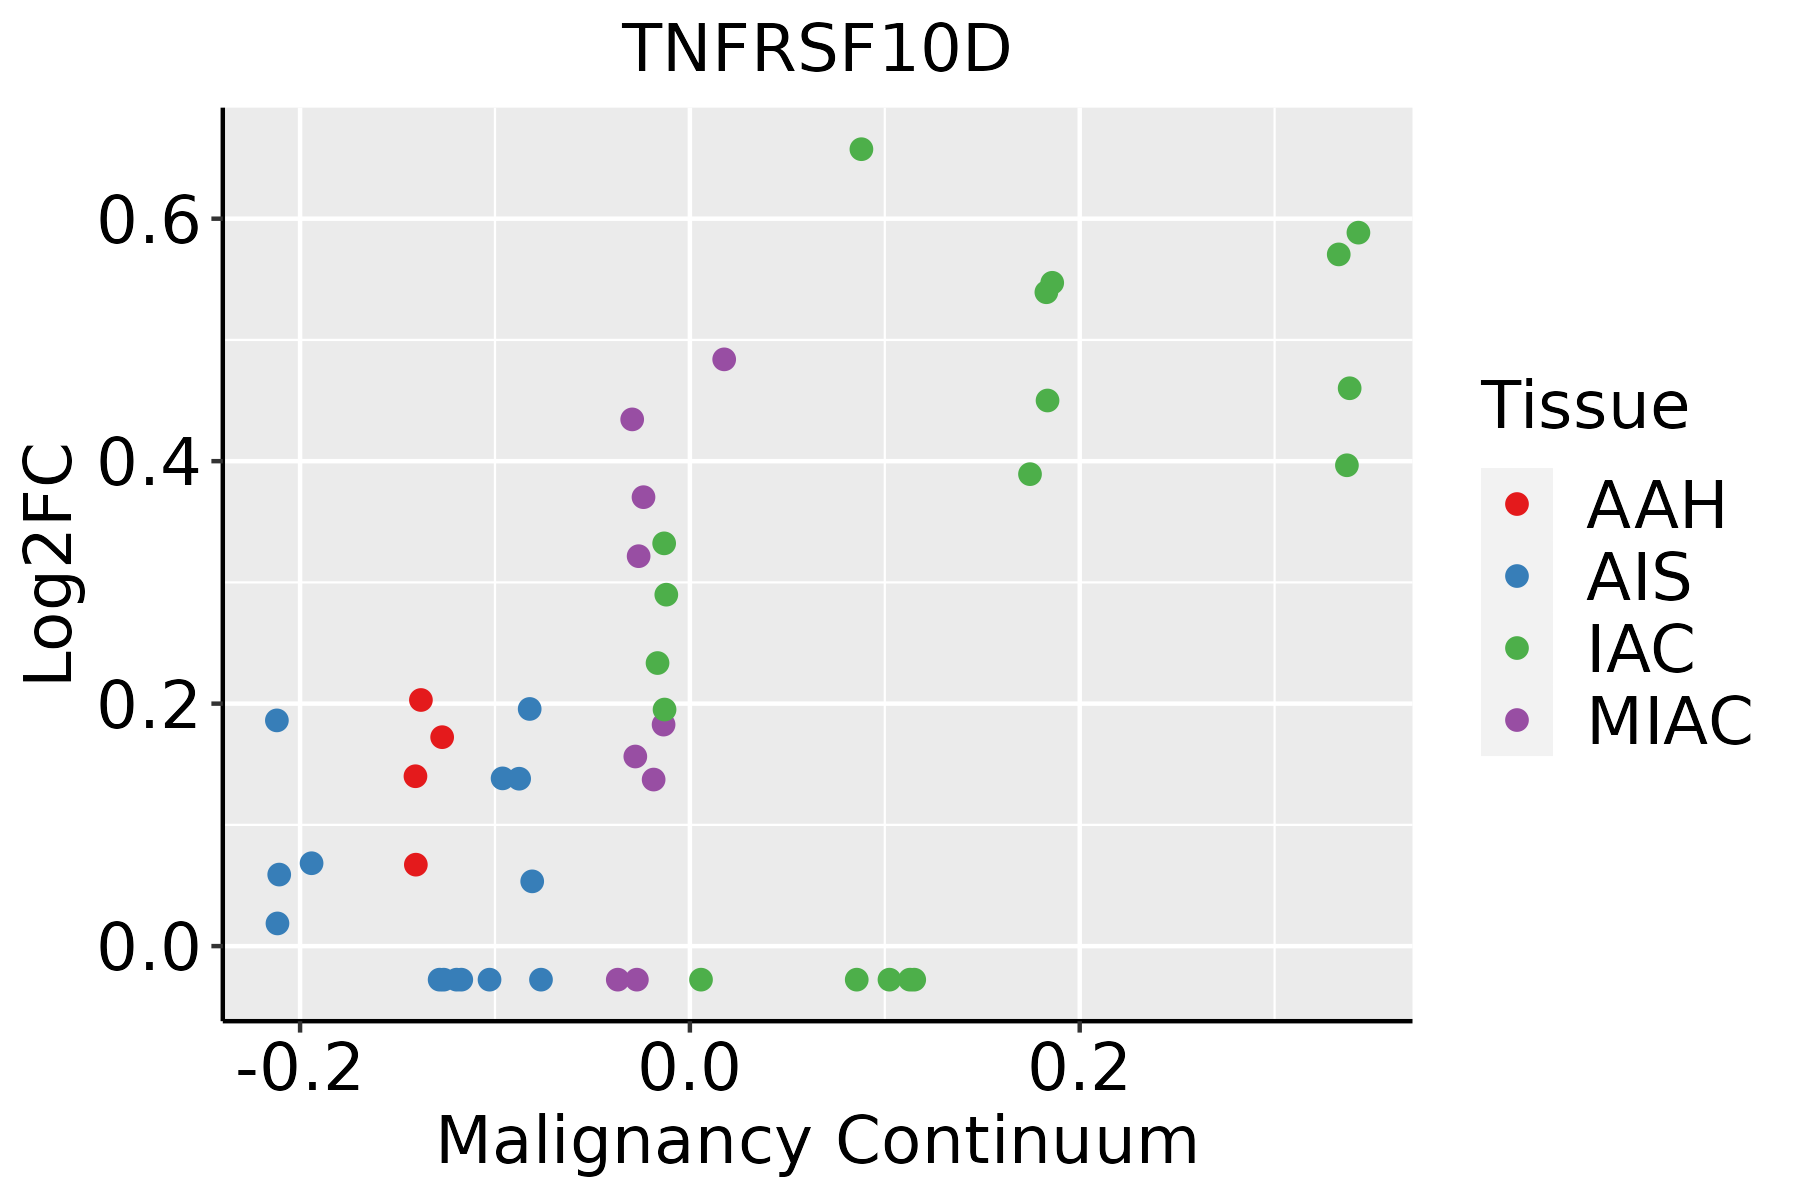 | AAH: Atypical adenomatous hyperplasia |
| AIS: Adenocarcinoma in situ | ||
| IAC: Invasive lung adenocarcinoma | ||
| MIA: Minimally invasive adenocarcinoma |
| ∗log2FC in expression of this searched gene in stem-like cells from each diseased tissue sample relative to stem-like cells in normal samples in each tissue plotted against the malignancy continuum. Samples are colored based on if they are from different disease stage. |
Top |
Malignant transformation related pathway analysis |
| Find out the enriched GO biological processes and KEGG pathways involved in transition from healthy to precancer to cancer |
| Tissue | Disease Stage | Enriched GO biological Processes |
| Colorectum | AD |  |
| Colorectum | SER |  |
| Colorectum | MSS |  |
| Colorectum | MSI-H |  |
| Colorectum | FAP |  |
| ∗Top 15 enriched GO BP terms are showed in the bar plot of each disease state in each tissue. Each row represents a significant GO biological process which is colored according to the -log10(p.adjust). |
| Page: 1 2 3 4 5 6 7 8 9 |
| GO ID | Tissue | Disease Stage | Description | Gene Ratio | Bg Ratio | pvalue | p.adjust | Count |
| Page: 1 |
| Pathway ID | Tissue | Disease Stage | Description | Gene Ratio | Bg Ratio | pvalue | p.adjust | qvalue | Count |
| Page: 1 |
Top |
Cell-cell communication analysis |
| Identification of potential cell-cell interactions between two cell types and their ligand-receptor pairs for different disease states |
| Ligand | Receptor | LRpair | Pathway | Tissue | Disease Stage |
| Page: 1 |
Top |
Single-cell gene regulatory network inference analysis |
| Find out the significant the regulons (TFs) and the target genes of each regulon across cell types for different disease states |
| TF | Cell Type | Tissue | Disease Stage | Target Gene | RSS | Regulon Activity |
| ∗The dot plots of a searched regulon are shown for all cell subpopulations in each disease state of each tissue based on the regulon specific score inferred using pySCENIC and by calculating the average expression. |
| Page: 1 |
Top |
Somatic mutation of malignant transformation related genes |
| Annotation of somatic variants for genes involved in malignant transformation |
| Hugo Symbol | Variant Class | Variant Classification | dbSNP RS | HGVSc | HGVSp | HGVSp Short | SWISSPROT | BIOTYPE | SIFT | PolyPhen | Tumor Sample Barcode | Tissue | Histology | Sex | Age | Stage | Therapy Types | Drugs | Outcome |
| TNFRSF10D | SNV | Missense_Mutation | novel | c.767N>A | p.Arg256Lys | p.R256K | Q9UBN6 | protein_coding | tolerated(0.31) | possibly_damaging(0.826) | TCGA-5L-AAT1-01 | Breast | breast invasive carcinoma | Female | <65 | III/IV | Hormone Therapy | letrozol | SD |
| TNFRSF10D | SNV | Missense_Mutation | c.968N>A | p.Ala323Asp | p.A323D | Q9UBN6 | protein_coding | tolerated(0.37) | possibly_damaging(0.9) | TCGA-2W-A8YY-01 | Cervix | cervical & endocervical cancer | Female | <65 | I/II | Chemotherapy | cisplatin | CR | |
| TNFRSF10D | SNV | Missense_Mutation | c.31G>A | p.Ala11Thr | p.A11T | Q9UBN6 | protein_coding | tolerated(0.19) | benign(0.021) | TCGA-AD-6895-01 | Colorectum | colon adenocarcinoma | Male | >=65 | III/IV | Unknown | Unknown | SD | |
| TNFRSF10D | SNV | Missense_Mutation | rs373138944 | c.1148N>T | p.Thr383Met | p.T383M | Q9UBN6 | protein_coding | deleterious_low_confidence(0) | possibly_damaging(0.832) | TCGA-AZ-6601-01 | Colorectum | colon adenocarcinoma | Male | >=65 | I/II | Unknown | Unknown | PD |
| TNFRSF10D | SNV | Missense_Mutation | c.541N>G | p.Lys181Glu | p.K181E | Q9UBN6 | protein_coding | tolerated(0.74) | benign(0.09) | TCGA-CK-5916-01 | Colorectum | colon adenocarcinoma | Female | >=65 | I/II | Unknown | Unknown | PD | |
| TNFRSF10D | SNV | Missense_Mutation | novel | c.1156C>A | p.Leu386Met | p.L386M | Q9UBN6 | protein_coding | deleterious_low_confidence(0) | probably_damaging(0.998) | TCGA-A5-A0G2-01 | Endometrium | uterine corpus endometrioid carcinoma | Female | <65 | III/IV | Unknown | Unknown | SD |
| TNFRSF10D | SNV | Missense_Mutation | novel | c.506T>C | p.Val169Ala | p.V169A | Q9UBN6 | protein_coding | tolerated(0.69) | benign(0.308) | TCGA-A5-A0G2-01 | Endometrium | uterine corpus endometrioid carcinoma | Female | <65 | III/IV | Unknown | Unknown | SD |
| TNFRSF10D | SNV | Missense_Mutation | novel | c.183G>T | p.Gln61His | p.Q61H | Q9UBN6 | protein_coding | tolerated(0.05) | possibly_damaging(0.799) | TCGA-A5-A0G2-01 | Endometrium | uterine corpus endometrioid carcinoma | Female | <65 | III/IV | Unknown | Unknown | SD |
| TNFRSF10D | SNV | Missense_Mutation | rs148918013 | c.947G>A | p.Arg316His | p.R316H | Q9UBN6 | protein_coding | tolerated(0.81) | benign(0.003) | TCGA-A5-A1OF-01 | Endometrium | uterine corpus endometrioid carcinoma | Female | <65 | I/II | Unknown | Unknown | SD |
| TNFRSF10D | SNV | Missense_Mutation | c.818N>G | p.Asp273Gly | p.D273G | Q9UBN6 | protein_coding | deleterious(0.05) | probably_damaging(0.967) | TCGA-AP-A056-01 | Endometrium | uterine corpus endometrioid carcinoma | Female | <65 | I/II | Unknown | Unknown | SD |
| Page: 1 2 3 |
Top |
Related drugs of malignant transformation related genes |
| Identification of chemicals and drugs interact with genes involved in malignant transfromation |
| (DGIdb 4.0) |
| Entrez ID | Symbol | Category | Interaction Types | Drug Claim Name | Drug Name | PMIDs |
| Page: 1 |

Copyright 2023-Present -The University of Texas Health Science Center at Houston |