| Tissue | Expression Dynamics | Abbreviation |
| Cervix |  | CC: Cervix cancer |
| HSIL_HPV: HPV-infected high-grade squamous intraepithelial lesions |
| N_HPV: HPV-infected normal cervix |
| Endometrium | 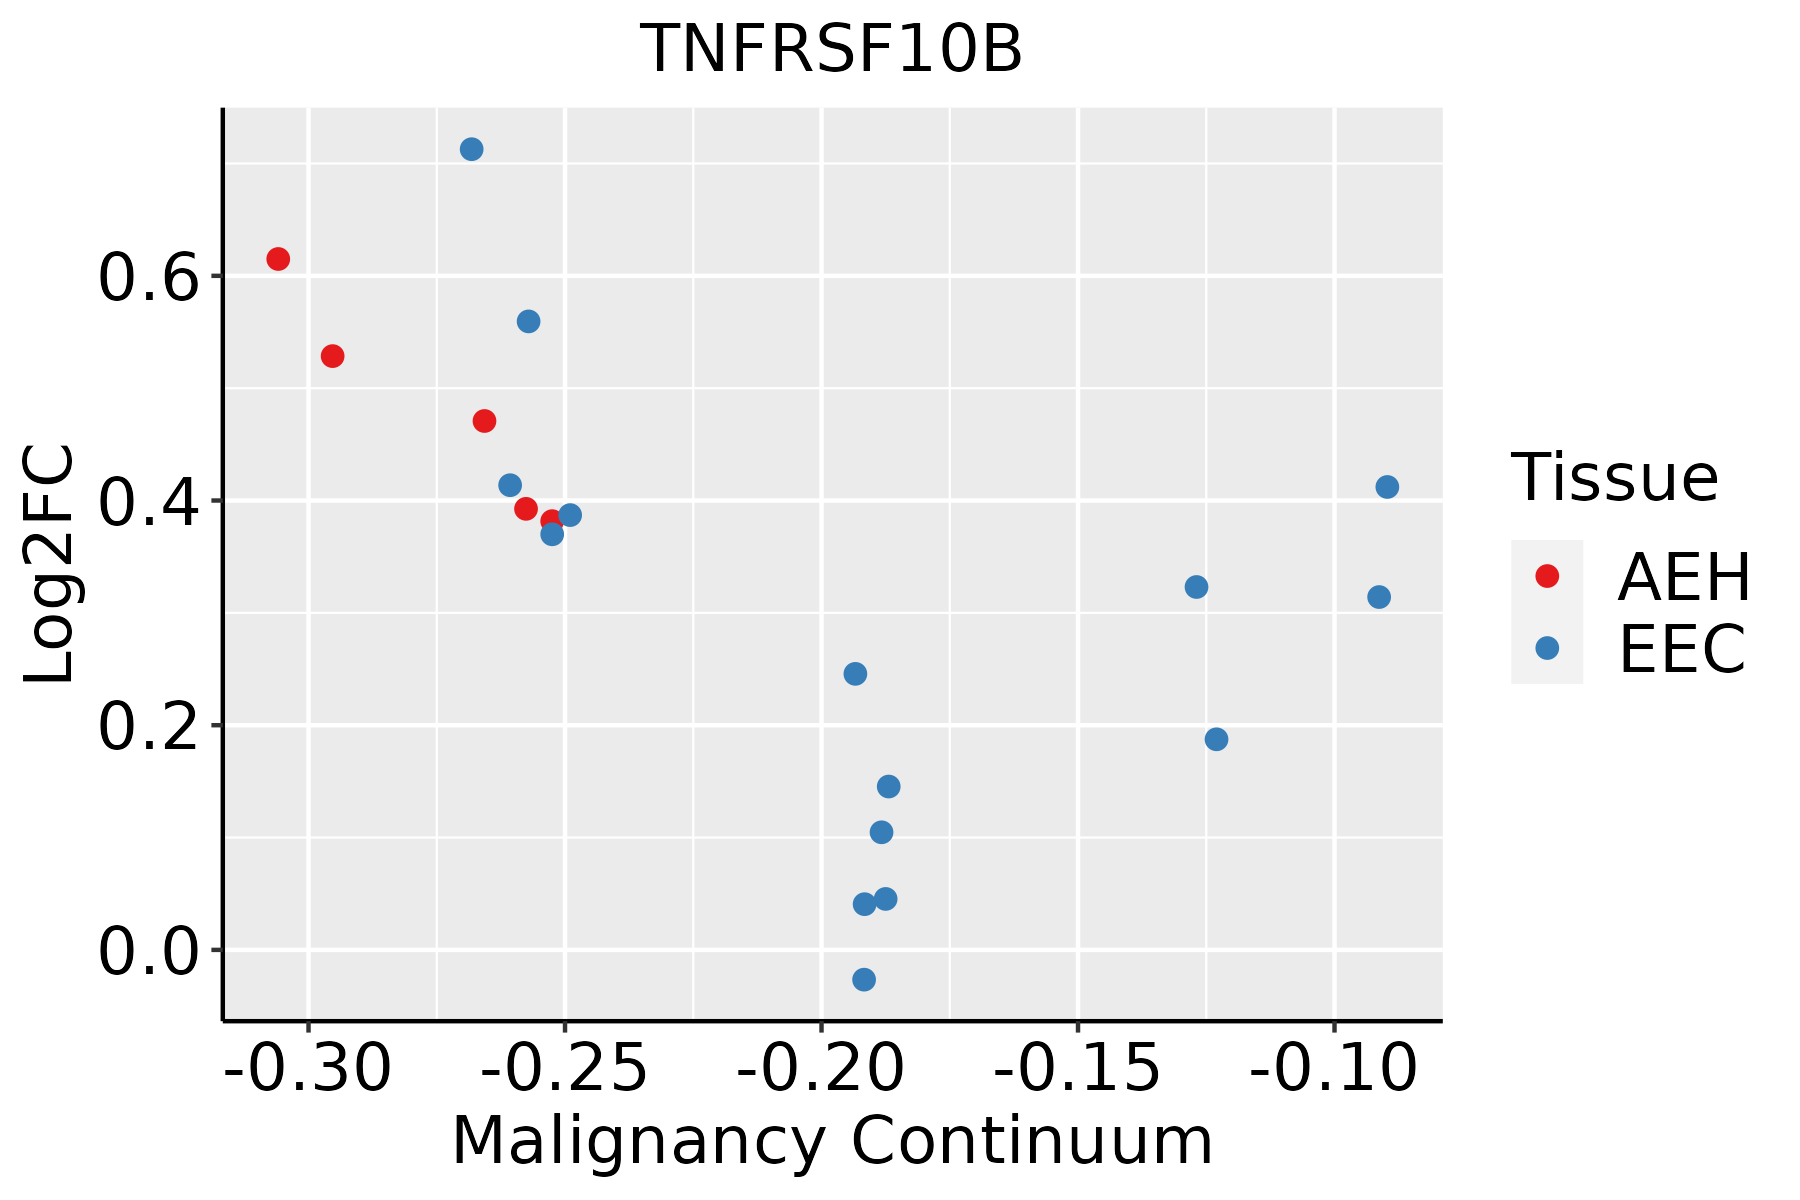 | AEH: Atypical endometrial hyperplasia |
| EEC: Endometrioid Cancer |
| Esophagus | 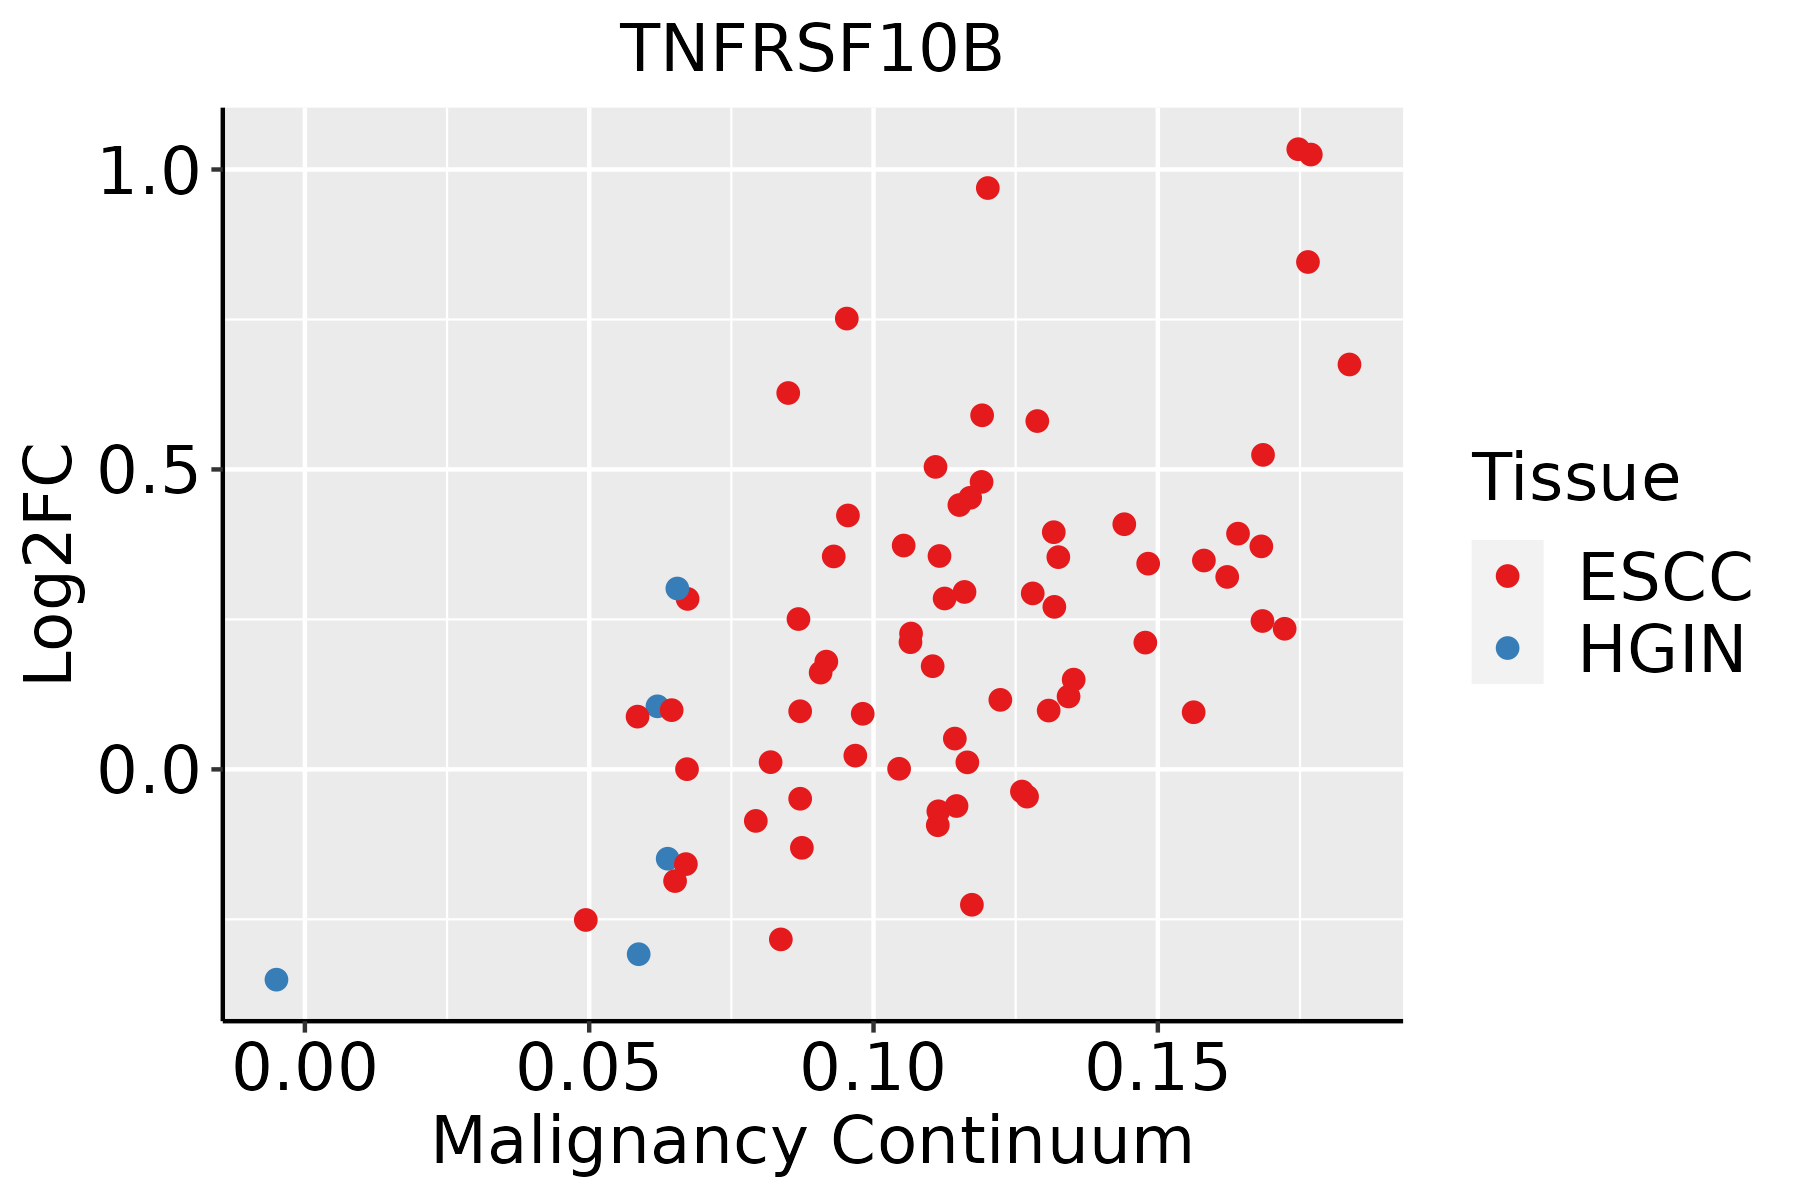 | ESCC: Esophageal squamous cell carcinoma |
| HGIN: High-grade intraepithelial neoplasias |
| LGIN: Low-grade intraepithelial neoplasias |
| Liver |  | HCC: Hepatocellular carcinoma |
| NAFLD: Non-alcoholic fatty liver disease |
| Lung | 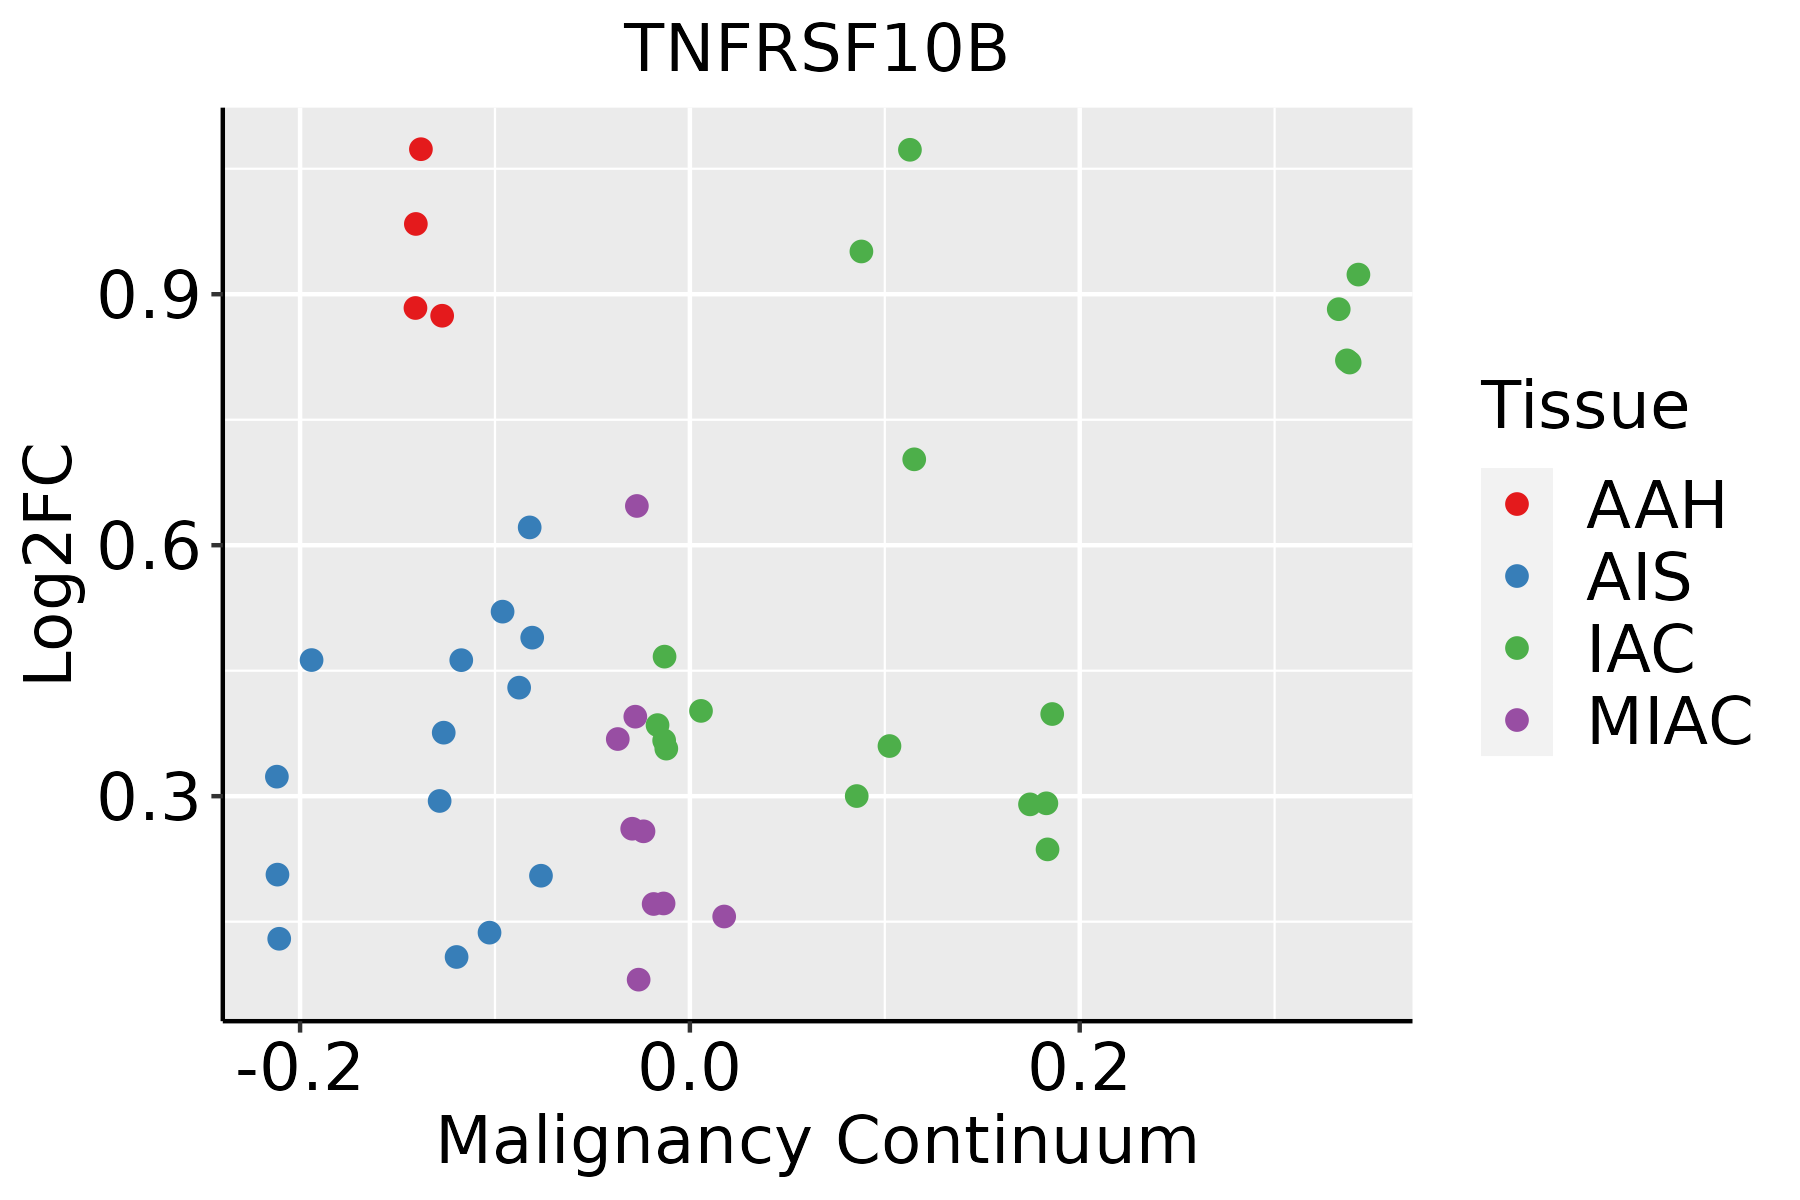 | AAH: Atypical adenomatous hyperplasia |
| AIS: Adenocarcinoma in situ |
| IAC: Invasive lung adenocarcinoma |
| MIA: Minimally invasive adenocarcinoma |
| Oral Cavity | 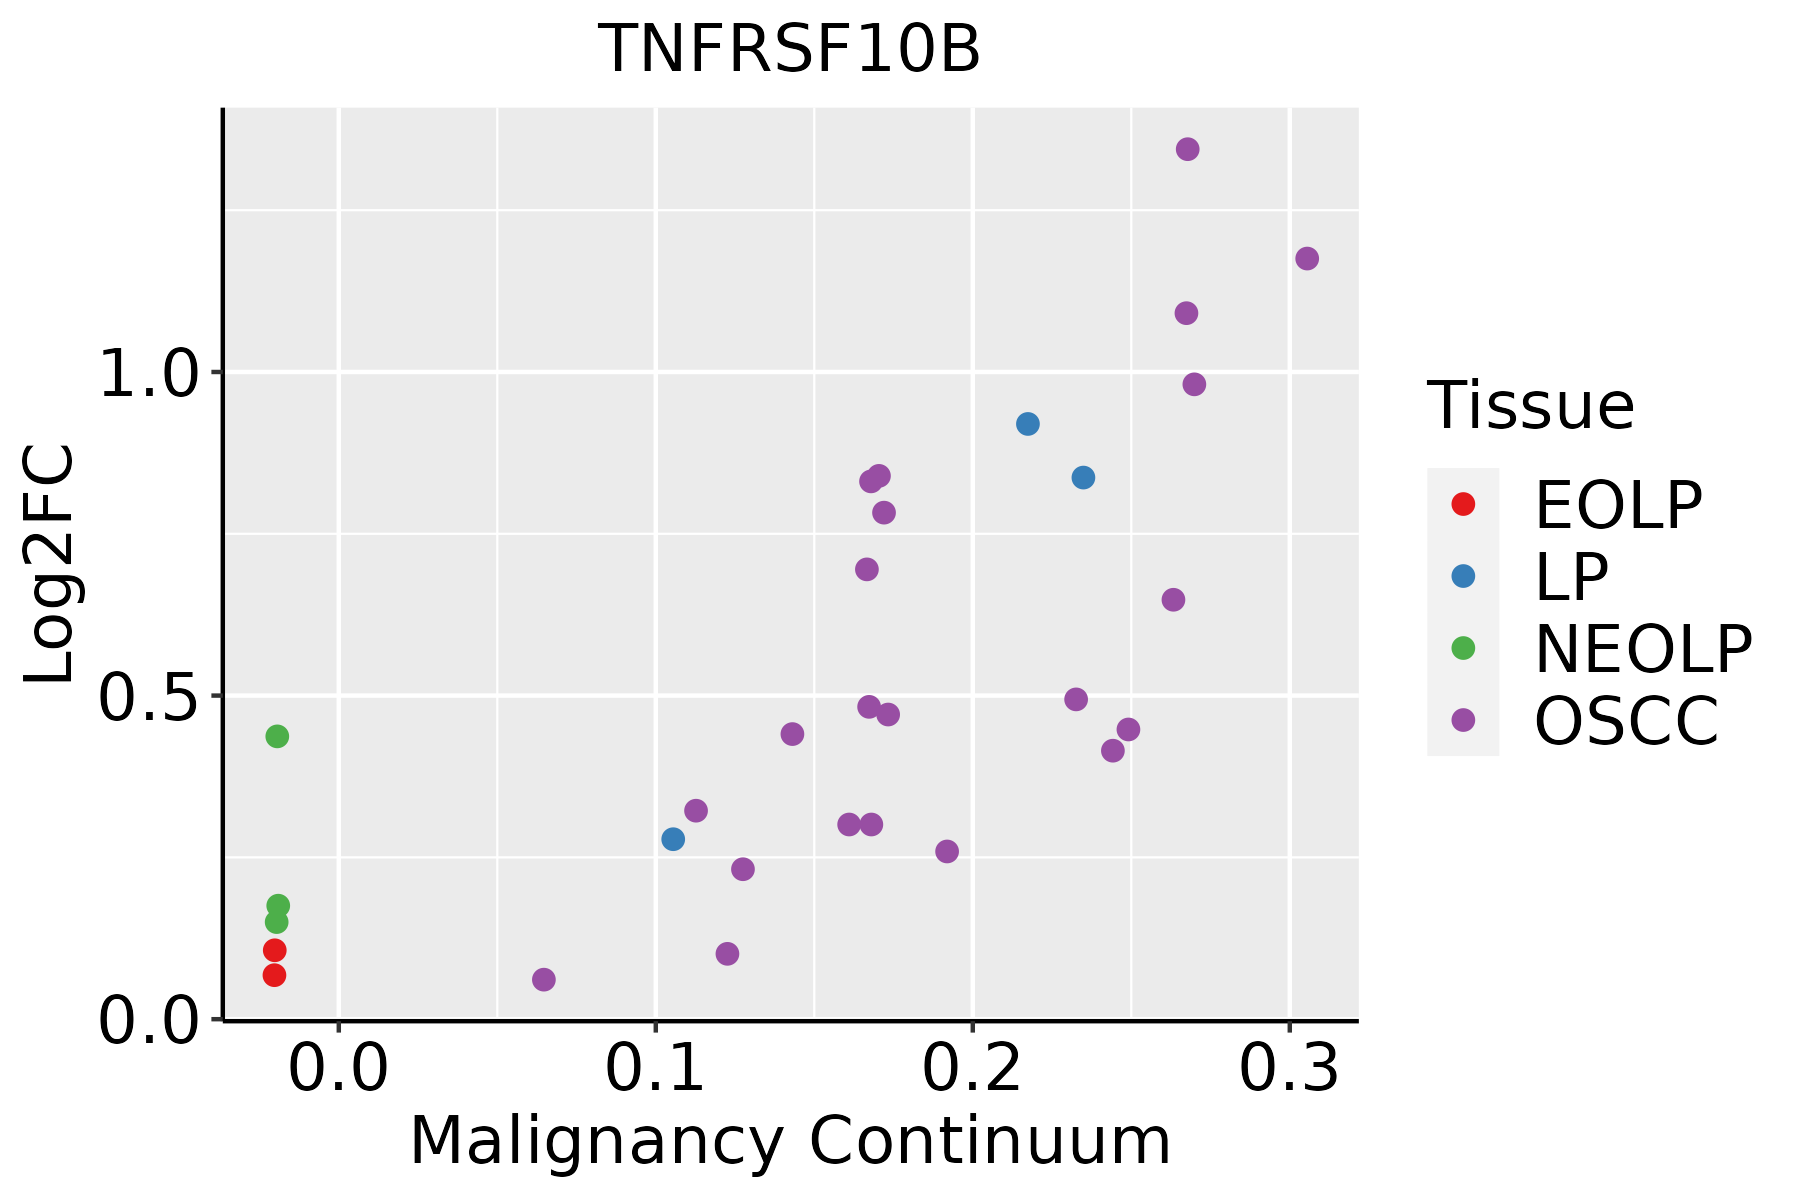 | EOLP: Erosive Oral lichen planus |
| LP: leukoplakia |
| NEOLP: Non-erosive oral lichen planus |
| OSCC: Oral squamous cell carcinoma |
| Prostate |  | BPH: Benign Prostatic Hyperplasia |
| Thyroid |  | ATC: Anaplastic thyroid cancer |
| HT: Hashimoto's thyroiditis |
| PTC: Papillary thyroid cancer |
| GO ID | Tissue | Disease Stage | Description | Gene Ratio | Bg Ratio | pvalue | p.adjust | Count |
| GO:009719310 | Cervix | CC | intrinsic apoptotic signaling pathway | 85/2311 | 288/18723 | 4.56e-15 | 6.46e-12 | 85 |
| GO:007149610 | Cervix | CC | cellular response to external stimulus | 78/2311 | 320/18723 | 1.82e-09 | 1.98e-07 | 78 |
| GO:003367410 | Cervix | CC | positive regulation of kinase activity | 101/2311 | 467/18723 | 8.66e-09 | 7.22e-07 | 101 |
| GO:00458608 | Cervix | CC | positive regulation of protein kinase activity | 85/2311 | 386/18723 | 5.61e-08 | 3.29e-06 | 85 |
| GO:009719110 | Cervix | CC | extrinsic apoptotic signaling pathway | 52/2311 | 219/18723 | 2.06e-06 | 6.34e-05 | 52 |
| GO:003497610 | Cervix | CC | response to endoplasmic reticulum stress | 57/2311 | 256/18723 | 5.81e-06 | 1.42e-04 | 57 |
| GO:00712148 | Cervix | CC | cellular response to abiotic stimulus | 69/2311 | 331/18723 | 7.36e-06 | 1.73e-04 | 69 |
| GO:01040048 | Cervix | CC | cellular response to environmental stimulus | 69/2311 | 331/18723 | 7.36e-06 | 1.73e-04 | 69 |
| GO:00700599 | Cervix | CC | intrinsic apoptotic signaling pathway in response to endoplasmic reticulum stress | 21/2311 | 63/18723 | 1.18e-05 | 2.51e-04 | 21 |
| GO:00096127 | Cervix | CC | response to mechanical stimulus | 48/2311 | 216/18723 | 3.23e-05 | 5.29e-04 | 48 |
| GO:00431228 | Cervix | CC | regulation of I-kappaB kinase/NF-kappaB signaling | 53/2311 | 249/18723 | 4.50e-05 | 6.87e-04 | 53 |
| GO:00712602 | Cervix | CC | cellular response to mechanical stimulus | 23/2311 | 81/18723 | 8.34e-05 | 1.12e-03 | 23 |
| GO:00072497 | Cervix | CC | I-kappaB kinase/NF-kappaB signaling | 56/2311 | 281/18723 | 1.81e-04 | 2.12e-03 | 56 |
| GO:00431237 | Cervix | CC | positive regulation of I-kappaB kinase/NF-kappaB signaling | 37/2311 | 186/18723 | 2.15e-03 | 1.55e-02 | 37 |
| GO:00086259 | Cervix | CC | extrinsic apoptotic signaling pathway via death domain receptors | 19/2311 | 82/18723 | 4.57e-03 | 2.77e-02 | 19 |
| GO:009719316 | Endometrium | AEH | intrinsic apoptotic signaling pathway | 75/2100 | 288/18723 | 1.46e-12 | 2.83e-10 | 75 |
| GO:003497616 | Endometrium | AEH | response to endoplasmic reticulum stress | 62/2100 | 256/18723 | 2.88e-09 | 2.13e-07 | 62 |
| GO:009719116 | Endometrium | AEH | extrinsic apoptotic signaling pathway | 49/2100 | 219/18723 | 1.58e-06 | 4.94e-05 | 49 |
| GO:00431229 | Endometrium | AEH | regulation of I-kappaB kinase/NF-kappaB signaling | 52/2100 | 249/18723 | 6.58e-06 | 1.59e-04 | 52 |
| GO:00431238 | Endometrium | AEH | positive regulation of I-kappaB kinase/NF-kappaB signaling | 41/2100 | 186/18723 | 1.59e-05 | 3.32e-04 | 41 |
| Pathway ID | Tissue | Disease Stage | Description | Gene Ratio | Bg Ratio | pvalue | p.adjust | qvalue | Count |
| hsa0513020 | Cervix | CC | Pathogenic Escherichia coli infection | 63/1267 | 197/8465 | 9.28e-10 | 2.00e-08 | 1.19e-08 | 63 |
| hsa0513220 | Cervix | CC | Salmonella infection | 74/1267 | 249/8465 | 1.33e-09 | 2.54e-08 | 1.50e-08 | 74 |
| hsa0541720 | Cervix | CC | Lipid and atherosclerosis | 65/1267 | 215/8465 | 6.47e-09 | 1.10e-07 | 6.52e-08 | 65 |
| hsa0516414 | Cervix | CC | Influenza A | 43/1267 | 171/8465 | 3.03e-04 | 1.64e-03 | 9.68e-04 | 43 |
| hsa042109 | Cervix | CC | Apoptosis | 36/1267 | 136/8465 | 3.21e-04 | 1.68e-03 | 9.91e-04 | 36 |
| hsa05130110 | Cervix | CC | Pathogenic Escherichia coli infection | 63/1267 | 197/8465 | 9.28e-10 | 2.00e-08 | 1.19e-08 | 63 |
| hsa05132110 | Cervix | CC | Salmonella infection | 74/1267 | 249/8465 | 1.33e-09 | 2.54e-08 | 1.50e-08 | 74 |
| hsa05417110 | Cervix | CC | Lipid and atherosclerosis | 65/1267 | 215/8465 | 6.47e-09 | 1.10e-07 | 6.52e-08 | 65 |
| hsa0516415 | Cervix | CC | Influenza A | 43/1267 | 171/8465 | 3.03e-04 | 1.64e-03 | 9.68e-04 | 43 |
| hsa0421014 | Cervix | CC | Apoptosis | 36/1267 | 136/8465 | 3.21e-04 | 1.68e-03 | 9.91e-04 | 36 |
| hsa0513226 | Endometrium | AEH | Salmonella infection | 71/1197 | 249/8465 | 1.69e-09 | 3.44e-08 | 2.52e-08 | 71 |
| hsa0513026 | Endometrium | AEH | Pathogenic Escherichia coli infection | 50/1197 | 197/8465 | 1.72e-05 | 1.86e-04 | 1.36e-04 | 50 |
| hsa0541726 | Endometrium | AEH | Lipid and atherosclerosis | 47/1197 | 215/8465 | 1.24e-03 | 7.62e-03 | 5.58e-03 | 47 |
| hsa0421010 | Endometrium | AEH | Apoptosis | 30/1197 | 136/8465 | 7.72e-03 | 4.05e-02 | 2.96e-02 | 30 |
| hsa05132112 | Endometrium | AEH | Salmonella infection | 71/1197 | 249/8465 | 1.69e-09 | 3.44e-08 | 2.52e-08 | 71 |
| hsa05130112 | Endometrium | AEH | Pathogenic Escherichia coli infection | 50/1197 | 197/8465 | 1.72e-05 | 1.86e-04 | 1.36e-04 | 50 |
| hsa05417111 | Endometrium | AEH | Lipid and atherosclerosis | 47/1197 | 215/8465 | 1.24e-03 | 7.62e-03 | 5.58e-03 | 47 |
| hsa0421015 | Endometrium | AEH | Apoptosis | 30/1197 | 136/8465 | 7.72e-03 | 4.05e-02 | 2.96e-02 | 30 |
| hsa0513227 | Endometrium | EEC | Salmonella infection | 71/1237 | 249/8465 | 7.11e-09 | 1.30e-07 | 9.69e-08 | 71 |
| hsa0513027 | Endometrium | EEC | Pathogenic Escherichia coli infection | 51/1237 | 197/8465 | 1.98e-05 | 2.28e-04 | 1.70e-04 | 51 |
| Hugo Symbol | Variant Class | Variant Classification | dbSNP RS | HGVSc | HGVSp | HGVSp Short | SWISSPROT | BIOTYPE | SIFT | PolyPhen | Tumor Sample Barcode | Tissue | Histology | Sex | Age | Stage | Therapy Types | Drugs | Outcome |
| TNFRSF10B | SNV | Missense_Mutation | novel | c.1284N>A | p.Phe428Leu | p.F428L | O14763 | protein_coding | deleterious(0.01) | benign(0.125) | TCGA-AN-A046-01 | Breast | breast invasive carcinoma | Female | >=65 | I/II | Unknown | Unknown | SD |
| TNFRSF10B | SNV | Missense_Mutation | novel | c.1030G>T | p.Asp344Tyr | p.D344Y | O14763 | protein_coding | tolerated(0.12) | benign(0.001) | TCGA-AR-A2LR-01 | Breast | breast invasive carcinoma | Female | <65 | I/II | Chemotherapy | adriamycin | SD |
| TNFRSF10B | insertion | Frame_Shift_Ins | novel | c.858_859insACTAGCCTGGCCAACATGGTGAAACCCTGTCT | p.Gln287ThrfsTer63 | p.Q287Tfs*63 | O14763 | protein_coding | | | TCGA-A7-A0CG-01 | Breast | breast invasive carcinoma | Female | >=65 | I/II | Unknown | Unknown | SD |
| TNFRSF10B | insertion | In_Frame_Ins | novel | c.955_956insTCGTCCCGAGATCTGGGCAGCATTGCTCGGTCTTTG | p.Arg319delinsIleValProArgSerGlyGlnHisCysSerValPheGly | p.R319delinsIVPRSGQHCSVFG | O14763 | protein_coding | | | TCGA-A8-A08H-01 | Breast | breast invasive carcinoma | Female | >=65 | I/II | Unknown | Unknown | SD |
| TNFRSF10B | SNV | Missense_Mutation | rs748928192 | c.826N>A | p.Val276Met | p.V276M | O14763 | protein_coding | tolerated(0.26) | benign(0.006) | TCGA-2W-A8YY-01 | Cervix | cervical & endocervical cancer | Female | <65 | I/II | Chemotherapy | cisplatin | CR |
| TNFRSF10B | SNV | Missense_Mutation | novel | c.187N>T | p.Pro63Ser | p.P63S | O14763 | protein_coding | tolerated(0.29) | benign(0.264) | TCGA-2W-A8YY-01 | Cervix | cervical & endocervical cancer | Female | <65 | I/II | Chemotherapy | cisplatin | CR |
| TNFRSF10B | SNV | Missense_Mutation | | c.864N>C | p.Glu288Asp | p.E288D | O14763 | protein_coding | tolerated(0.22) | possibly_damaging(0.76) | TCGA-FU-A3HZ-01 | Cervix | cervical & endocervical cancer | Female | <65 | I/II | Chemotherapy | cisplatin | CR |
| TNFRSF10B | SNV | Missense_Mutation | rs529765232 | c.344N>A | p.Arg115His | p.R115H | O14763 | protein_coding | tolerated(0.16) | possibly_damaging(0.87) | TCGA-AA-3949-01 | Colorectum | colon adenocarcinoma | Female | >=65 | III/IV | Unknown | Unknown | SD |
| TNFRSF10B | SNV | Missense_Mutation | | c.791G>A | p.Arg264Gln | p.R264Q | O14763 | protein_coding | tolerated(0.6) | benign(0.003) | TCGA-AA-A010-01 | Colorectum | colon adenocarcinoma | Female | <65 | I/II | Chemotherapy | folinic | CR |
| TNFRSF10B | SNV | Missense_Mutation | | c.1189N>A | p.Ala397Thr | p.A397T | O14763 | protein_coding | tolerated(0.06) | probably_damaging(0.996) | TCGA-CK-4951-01 | Colorectum | colon adenocarcinoma | Female | >=65 | I/II | Unknown | Unknown | PD |
| Entrez ID | Symbol | Category | Interaction Types | Drug Claim Name | Drug Name | PMIDs |
| 8795 | TNFRSF10B | DRUGGABLE GENOME, CELL SURFACE | agonist | CHEMBL2107846 | DULANERMIN | |
| 8795 | TNFRSF10B | DRUGGABLE GENOME, CELL SURFACE | antibody | APOMAB | APOMAB | |
| 8795 | TNFRSF10B | DRUGGABLE GENOME, CELL SURFACE | | LUTEOLIN | LUTEOLIN | 21265555 |
| 8795 | TNFRSF10B | DRUGGABLE GENOME, CELL SURFACE | | HGS-TR2J | | |
| 8795 | TNFRSF10B | DRUGGABLE GENOME, CELL SURFACE | | Conatumumab | CONATUMUMAB | |
| 8795 | TNFRSF10B | DRUGGABLE GENOME, CELL SURFACE | antibody | 318164853 | TIGATUZUMAB | |
| 8795 | TNFRSF10B | DRUGGABLE GENOME, CELL SURFACE | antibody | DULANERMIN | DULANERMIN | |
| 8795 | TNFRSF10B | DRUGGABLE GENOME, CELL SURFACE | | Anti-DR5 cells | | |
| 8795 | TNFRSF10B | DRUGGABLE GENOME, CELL SURFACE | antibody | DULANERMIN | DULANERMIN | |
| 8795 | TNFRSF10B | DRUGGABLE GENOME, CELL SURFACE | | LEXATUMUMAB | LEXATUMUMAB | |


