
|
|||||
|
 | |
| |
| |
| |
| |
| |
|
Gene: TNFRSF10A |
Gene summary for TNFRSF10A |
| Gene information | Species | Human | Gene symbol | TNFRSF10A | Gene ID | 8797 |
| Gene name | TNF receptor superfamily member 10a | |
| Gene Alias | APO2 | |
| Cytomap | 8p21.3 | |
| Gene Type | protein-coding | GO ID | GO:0001932 | UniProtAcc | O00220 |
Top |
Malignant transformation analysis |
| Identification of the aberrant gene expression in precancerous and cancerous lesions by comparing the gene expression of stem-like cells in diseased tissues with normal stem cells |
| Entrez ID | Symbol | Replicates | Species | Organ | Tissue | Adj P-value | Log2FC | Malignancy |
| 8797 | TNFRSF10A | LZE4T | Human | Esophagus | ESCC | 6.50e-05 | 5.15e-03 | 0.0811 |
| 8797 | TNFRSF10A | LZE8T | Human | Esophagus | ESCC | 6.60e-05 | 2.22e-02 | 0.067 |
| 8797 | TNFRSF10A | LZE24T | Human | Esophagus | ESCC | 1.80e-06 | 1.62e-01 | 0.0596 |
| 8797 | TNFRSF10A | P2T-E | Human | Esophagus | ESCC | 8.61e-27 | 6.02e-01 | 0.1177 |
| 8797 | TNFRSF10A | P4T-E | Human | Esophagus | ESCC | 5.67e-13 | 2.76e-01 | 0.1323 |
| 8797 | TNFRSF10A | P5T-E | Human | Esophagus | ESCC | 6.92e-06 | 2.35e-02 | 0.1327 |
| 8797 | TNFRSF10A | P8T-E | Human | Esophagus | ESCC | 2.05e-10 | 8.55e-02 | 0.0889 |
| 8797 | TNFRSF10A | P9T-E | Human | Esophagus | ESCC | 3.14e-04 | 3.46e-02 | 0.1131 |
| 8797 | TNFRSF10A | P11T-E | Human | Esophagus | ESCC | 2.35e-03 | -2.05e-02 | 0.1426 |
| 8797 | TNFRSF10A | P12T-E | Human | Esophagus | ESCC | 1.15e-07 | -6.97e-03 | 0.1122 |
| 8797 | TNFRSF10A | P15T-E | Human | Esophagus | ESCC | 5.33e-04 | 1.33e-02 | 0.1149 |
| 8797 | TNFRSF10A | P16T-E | Human | Esophagus | ESCC | 1.98e-03 | 1.13e-01 | 0.1153 |
| 8797 | TNFRSF10A | P17T-E | Human | Esophagus | ESCC | 1.64e-03 | 3.42e-01 | 0.1278 |
| 8797 | TNFRSF10A | P20T-E | Human | Esophagus | ESCC | 3.13e-15 | 4.08e-01 | 0.1124 |
| 8797 | TNFRSF10A | P21T-E | Human | Esophagus | ESCC | 2.20e-18 | 3.85e-01 | 0.1617 |
| 8797 | TNFRSF10A | P22T-E | Human | Esophagus | ESCC | 1.34e-07 | -4.37e-02 | 0.1236 |
| 8797 | TNFRSF10A | P23T-E | Human | Esophagus | ESCC | 4.63e-12 | 2.33e-01 | 0.108 |
| 8797 | TNFRSF10A | P24T-E | Human | Esophagus | ESCC | 8.71e-14 | 3.42e-01 | 0.1287 |
| 8797 | TNFRSF10A | P26T-E | Human | Esophagus | ESCC | 2.98e-05 | 1.28e-01 | 0.1276 |
| 8797 | TNFRSF10A | P27T-E | Human | Esophagus | ESCC | 4.35e-14 | 7.94e-02 | 0.1055 |
| Page: 1 2 3 4 |
| Tissue | Expression Dynamics | Abbreviation |
| Esophagus |  | ESCC: Esophageal squamous cell carcinoma |
| HGIN: High-grade intraepithelial neoplasias | ||
| LGIN: Low-grade intraepithelial neoplasias | ||
| Oral Cavity | 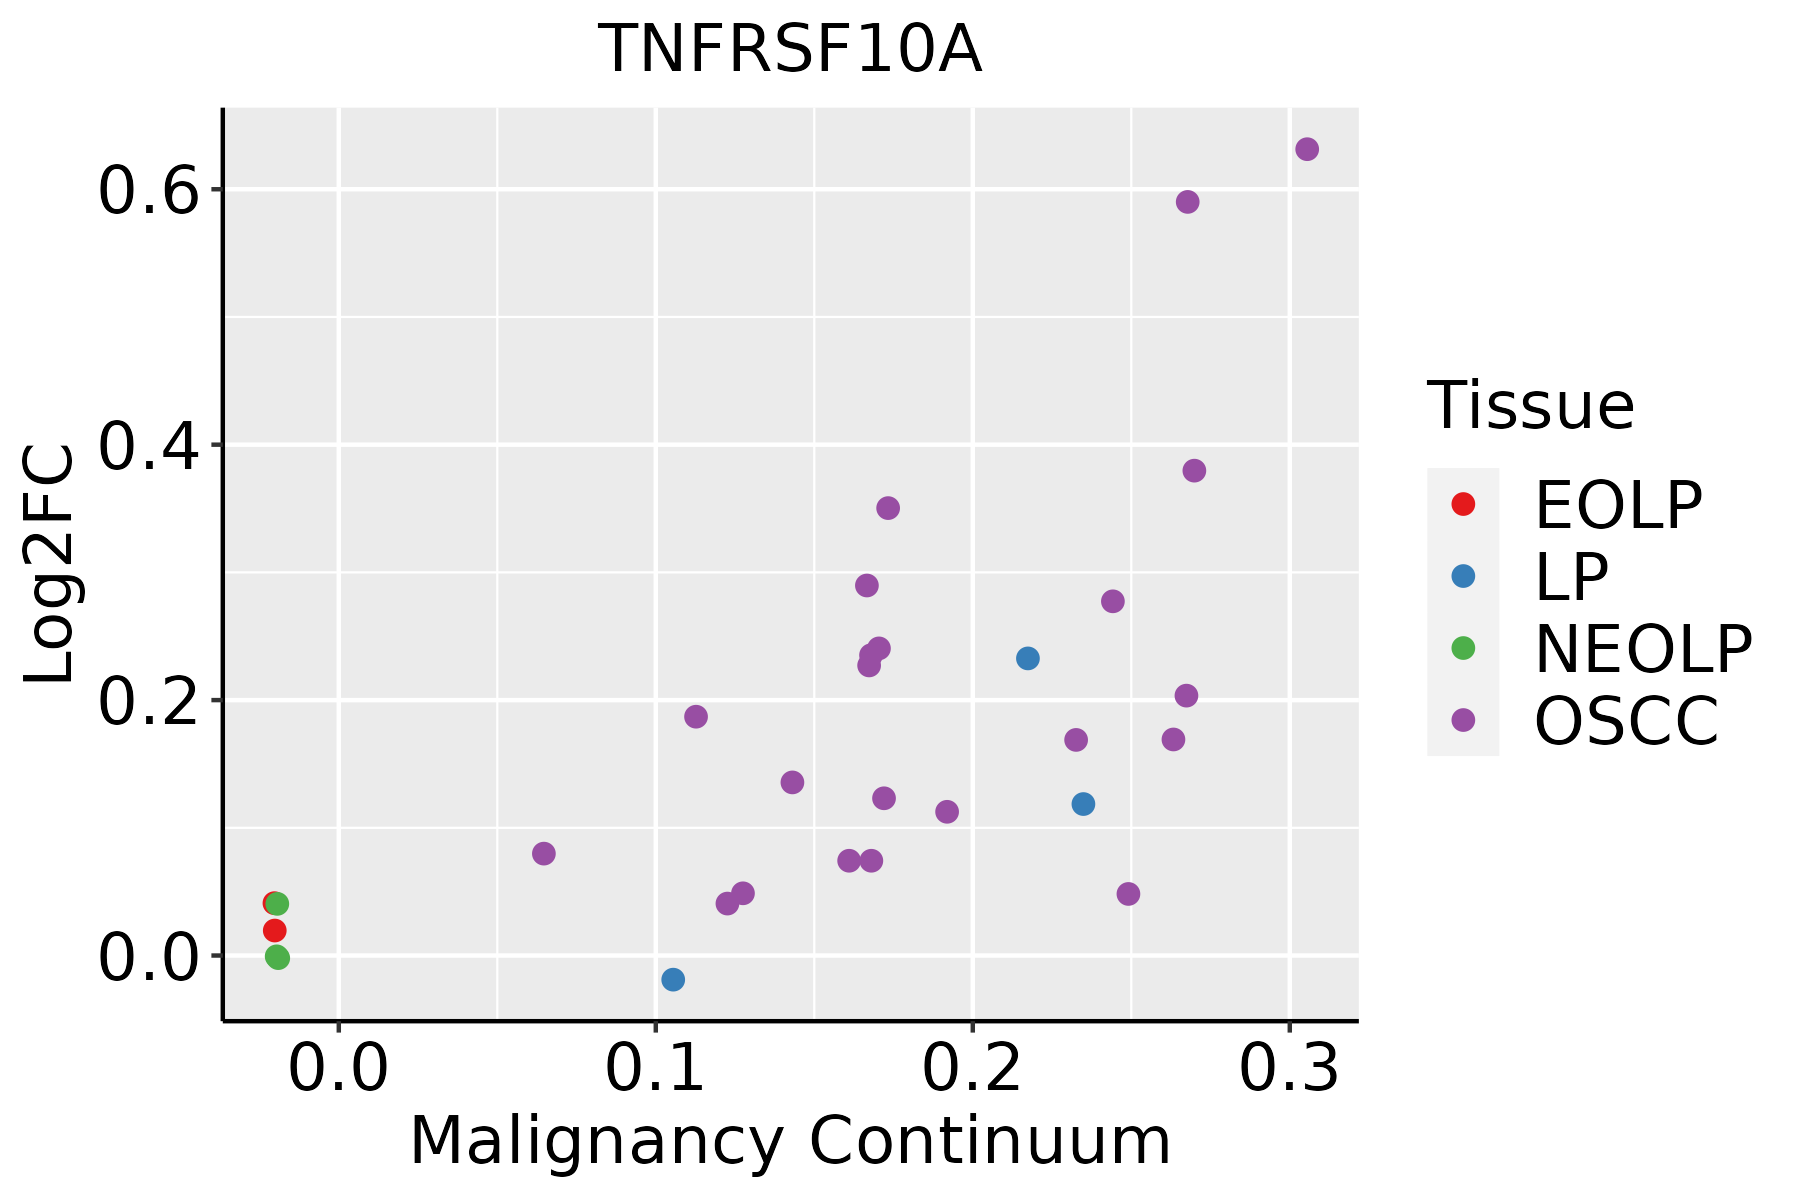 | EOLP: Erosive Oral lichen planus |
| LP: leukoplakia | ||
| NEOLP: Non-erosive oral lichen planus | ||
| OSCC: Oral squamous cell carcinoma |
| ∗log2FC in expression of this searched gene in stem-like cells from each diseased tissue sample relative to stem-like cells in normal samples in each tissue plotted against the malignancy continuum. Samples are colored based on if they are from different disease stage. |
Top |
Malignant transformation related pathway analysis |
| Find out the enriched GO biological processes and KEGG pathways involved in transition from healthy to precancer to cancer |
| Tissue | Disease Stage | Enriched GO biological Processes |
| Colorectum | AD |  |
| Colorectum | SER |  |
| Colorectum | MSS |  |
| Colorectum | MSI-H |  |
| Colorectum | FAP |  |
| ∗Top 15 enriched GO BP terms are showed in the bar plot of each disease state in each tissue. Each row represents a significant GO biological process which is colored according to the -log10(p.adjust). |
| Page: 1 2 3 4 5 6 7 8 9 |
| GO ID | Tissue | Disease Stage | Description | Gene Ratio | Bg Ratio | pvalue | p.adjust | Count |
| GO:0097191111 | Esophagus | ESCC | extrinsic apoptotic signaling pathway | 159/8552 | 219/18723 | 4.12e-16 | 2.94e-14 | 159 |
| GO:0071496111 | Esophagus | ESCC | cellular response to external stimulus | 215/8552 | 320/18723 | 4.29e-15 | 2.43e-13 | 215 |
| GO:007121419 | Esophagus | ESCC | cellular response to abiotic stimulus | 206/8552 | 331/18723 | 7.52e-10 | 1.88e-08 | 206 |
| GO:010400419 | Esophagus | ESCC | cellular response to environmental stimulus | 206/8552 | 331/18723 | 7.52e-10 | 1.88e-08 | 206 |
| GO:000862519 | Esophagus | ESCC | extrinsic apoptotic signaling pathway via death domain receptors | 59/8552 | 82/18723 | 1.23e-06 | 1.52e-05 | 59 |
| GO:004586018 | Esophagus | ESCC | positive regulation of protein kinase activity | 219/8552 | 386/18723 | 6.91e-06 | 6.97e-05 | 219 |
| GO:003367420 | Esophagus | ESCC | positive regulation of kinase activity | 260/8552 | 467/18723 | 7.26e-06 | 7.22e-05 | 260 |
| GO:00712606 | Esophagus | ESCC | cellular response to mechanical stimulus | 54/8552 | 81/18723 | 1.09e-04 | 7.64e-04 | 54 |
| GO:000961216 | Esophagus | ESCC | response to mechanical stimulus | 124/8552 | 216/18723 | 3.30e-04 | 1.94e-03 | 124 |
| GO:00380615 | Esophagus | ESCC | NIK/NF-kappaB signaling | 81/8552 | 143/18723 | 5.33e-03 | 2.00e-02 | 81 |
| GO:009719120 | Oral cavity | OSCC | extrinsic apoptotic signaling pathway | 142/7305 | 219/18723 | 7.34e-15 | 4.55e-13 | 142 |
| GO:007149620 | Oral cavity | OSCC | cellular response to external stimulus | 186/7305 | 320/18723 | 2.56e-12 | 1.05e-10 | 186 |
| GO:007121416 | Oral cavity | OSCC | cellular response to abiotic stimulus | 186/7305 | 331/18723 | 1.38e-10 | 4.10e-09 | 186 |
| GO:010400416 | Oral cavity | OSCC | cellular response to environmental stimulus | 186/7305 | 331/18723 | 1.38e-10 | 4.10e-09 | 186 |
| GO:000862516 | Oral cavity | OSCC | extrinsic apoptotic signaling pathway via death domain receptors | 53/7305 | 82/18723 | 2.30e-06 | 2.92e-05 | 53 |
| GO:00712605 | Oral cavity | OSCC | cellular response to mechanical stimulus | 52/7305 | 81/18723 | 3.86e-06 | 4.55e-05 | 52 |
| GO:004586016 | Oral cavity | OSCC | positive regulation of protein kinase activity | 194/7305 | 386/18723 | 3.90e-06 | 4.59e-05 | 194 |
| GO:003367418 | Oral cavity | OSCC | positive regulation of kinase activity | 228/7305 | 467/18723 | 8.31e-06 | 8.90e-05 | 228 |
| GO:000961210 | Oral cavity | OSCC | response to mechanical stimulus | 115/7305 | 216/18723 | 1.43e-05 | 1.44e-04 | 115 |
| GO:00380614 | Oral cavity | OSCC | NIK/NF-kappaB signaling | 78/7305 | 143/18723 | 1.14e-04 | 8.35e-04 | 78 |
| Page: 1 |
| Pathway ID | Tissue | Disease Stage | Description | Gene Ratio | Bg Ratio | pvalue | p.adjust | qvalue | Count |
| hsa05132211 | Esophagus | ESCC | Salmonella infection | 191/4205 | 249/8465 | 6.51e-19 | 5.45e-17 | 2.79e-17 | 191 |
| hsa0411524 | Esophagus | ESCC | p53 signaling pathway | 65/4205 | 74/8465 | 3.88e-12 | 6.50e-11 | 3.33e-11 | 65 |
| hsa05130211 | Esophagus | ESCC | Pathogenic Escherichia coli infection | 142/4205 | 197/8465 | 8.21e-11 | 1.06e-09 | 5.42e-10 | 142 |
| hsa0421027 | Esophagus | ESCC | Apoptosis | 102/4205 | 136/8465 | 1.05e-09 | 1.21e-08 | 6.21e-09 | 102 |
| hsa0516425 | Esophagus | ESCC | Influenza A | 122/4205 | 171/8465 | 5.01e-09 | 4.79e-08 | 2.45e-08 | 122 |
| hsa05417211 | Esophagus | ESCC | Lipid and atherosclerosis | 143/4205 | 215/8465 | 3.30e-07 | 2.45e-06 | 1.26e-06 | 143 |
| hsa05132310 | Esophagus | ESCC | Salmonella infection | 191/4205 | 249/8465 | 6.51e-19 | 5.45e-17 | 2.79e-17 | 191 |
| hsa0411534 | Esophagus | ESCC | p53 signaling pathway | 65/4205 | 74/8465 | 3.88e-12 | 6.50e-11 | 3.33e-11 | 65 |
| hsa05130310 | Esophagus | ESCC | Pathogenic Escherichia coli infection | 142/4205 | 197/8465 | 8.21e-11 | 1.06e-09 | 5.42e-10 | 142 |
| hsa0421037 | Esophagus | ESCC | Apoptosis | 102/4205 | 136/8465 | 1.05e-09 | 1.21e-08 | 6.21e-09 | 102 |
| hsa0516435 | Esophagus | ESCC | Influenza A | 122/4205 | 171/8465 | 5.01e-09 | 4.79e-08 | 2.45e-08 | 122 |
| hsa05417310 | Esophagus | ESCC | Lipid and atherosclerosis | 143/4205 | 215/8465 | 3.30e-07 | 2.45e-06 | 1.26e-06 | 143 |
| hsa0513230 | Oral cavity | OSCC | Salmonella infection | 174/3704 | 249/8465 | 2.67e-17 | 1.49e-15 | 7.58e-16 | 174 |
| hsa0421018 | Oral cavity | OSCC | Apoptosis | 101/3704 | 136/8465 | 3.34e-13 | 7.00e-12 | 3.56e-12 | 101 |
| hsa0516418 | Oral cavity | OSCC | Influenza A | 116/3704 | 171/8465 | 1.23e-10 | 1.78e-09 | 9.08e-10 | 116 |
| hsa0513030 | Oral cavity | OSCC | Pathogenic Escherichia coli infection | 129/3704 | 197/8465 | 4.32e-10 | 5.17e-09 | 2.63e-09 | 129 |
| hsa041159 | Oral cavity | OSCC | p53 signaling pathway | 57/3704 | 74/8465 | 4.99e-09 | 5.07e-08 | 2.58e-08 | 57 |
| hsa0541730 | Oral cavity | OSCC | Lipid and atherosclerosis | 131/3704 | 215/8465 | 2.20e-07 | 1.45e-06 | 7.37e-07 | 131 |
| hsa05132114 | Oral cavity | OSCC | Salmonella infection | 174/3704 | 249/8465 | 2.67e-17 | 1.49e-15 | 7.58e-16 | 174 |
| hsa0421019 | Oral cavity | OSCC | Apoptosis | 101/3704 | 136/8465 | 3.34e-13 | 7.00e-12 | 3.56e-12 | 101 |
| Page: 1 2 |
Top |
Cell-cell communication analysis |
| Identification of potential cell-cell interactions between two cell types and their ligand-receptor pairs for different disease states |
| Ligand | Receptor | LRpair | Pathway | Tissue | Disease Stage |
| TNFSF10 | TNFRSF10A | TNFSF10_TNFRSF10B | TRAIL | Cervix | CC |
| TNFSF10 | TNFRSF10A | TNFSF10_TNFRSF10B | TRAIL | CRC | MSI-H |
| TNFSF10 | TNFRSF10A | TNFSF10_TNFRSF10B | TRAIL | CRC | MSS |
| TNFSF10 | TNFRSF10A | TNFSF10_TNFRSF10B | TRAIL | Lung | AAH |
| Page: 1 |
Top |
Single-cell gene regulatory network inference analysis |
| Find out the significant the regulons (TFs) and the target genes of each regulon across cell types for different disease states |
| TF | Cell Type | Tissue | Disease Stage | Target Gene | RSS | Regulon Activity |
| ∗The dot plots of a searched regulon are shown for all cell subpopulations in each disease state of each tissue based on the regulon specific score inferred using pySCENIC and by calculating the average expression. |
| Page: 1 |
Top |
Somatic mutation of malignant transformation related genes |
| Annotation of somatic variants for genes involved in malignant transformation |
| Hugo Symbol | Variant Class | Variant Classification | dbSNP RS | HGVSc | HGVSp | HGVSp Short | SWISSPROT | BIOTYPE | SIFT | PolyPhen | Tumor Sample Barcode | Tissue | Histology | Sex | Age | Stage | Therapy Types | Drugs | Outcome |
| TNFRSF10A | SNV | Missense_Mutation | novel | c.214C>A | p.Arg72Ser | p.R72S | O00220 | protein_coding | tolerated(0.06) | benign(0.007) | TCGA-A2-A4RX-01 | Breast | breast invasive carcinoma | Female | >=65 | I/II | Unknown | Unknown | SD |
| TNFRSF10A | insertion | Frame_Shift_Ins | novel | c.1175dupA | p.Asn392LysfsTer2 | p.N392Kfs*2 | O00220 | protein_coding | TCGA-BH-A0EI-01 | Breast | breast invasive carcinoma | Female | <65 | I/II | Unknown | Unknown | SD | ||
| TNFRSF10A | deletion | Frame_Shift_Del | novel | c.811delG | p.Asp271ThrfsTer30 | p.D271Tfs*30 | O00220 | protein_coding | TCGA-EW-A2FV-01 | Breast | breast invasive carcinoma | Female | <65 | III/IV | Chemotherapy | docetaxel | SD | ||
| TNFRSF10A | SNV | Missense_Mutation | novel | c.502N>G | p.Thr168Ala | p.T168A | O00220 | protein_coding | deleterious(0.04) | possibly_damaging(0.897) | TCGA-2W-A8YY-01 | Cervix | cervical & endocervical cancer | Female | <65 | I/II | Chemotherapy | cisplatin | CR |
| TNFRSF10A | SNV | Missense_Mutation | novel | c.503C>A | p.Thr168Lys | p.T168K | O00220 | protein_coding | tolerated(0.16) | probably_damaging(0.926) | TCGA-C5-A905-01 | Cervix | cervical & endocervical cancer | Female | <65 | I/II | Unknown | Unknown | SD |
| TNFRSF10A | SNV | Missense_Mutation | rs777239727 | c.1123G>A | p.Val375Met | p.V375M | O00220 | protein_coding | deleterious(0) | probably_damaging(0.993) | TCGA-EK-A2PK-01 | Cervix | cervical & endocervical cancer | Female | <65 | I/II | Unknown | Unknown | SD |
| TNFRSF10A | SNV | Missense_Mutation | c.1024G>C | p.Glu342Gln | p.E342Q | O00220 | protein_coding | tolerated(0.14) | possibly_damaging(0.541) | TCGA-EK-A2R8-01 | Cervix | cervical & endocervical cancer | Female | <65 | I/II | Unknown | Unknown | SD | |
| TNFRSF10A | SNV | Missense_Mutation | novel | c.20N>C | p.Arg7Thr | p.R7T | O00220 | protein_coding | tolerated_low_confidence(0.28) | benign(0) | TCGA-HM-A4S6-01 | Cervix | cervical & endocervical cancer | Female | <65 | III/IV | Chemotherapy | cisplatin | CR |
| TNFRSF10A | SNV | Missense_Mutation | c.457N>T | p.Gly153Cys | p.G153C | O00220 | protein_coding | deleterious(0) | probably_damaging(0.995) | TCGA-AA-3811-01 | Colorectum | colon adenocarcinoma | Female | >=65 | III/IV | Unknown | Unknown | PD | |
| TNFRSF10A | SNV | Missense_Mutation | c.969N>T | p.Leu323Phe | p.L323F | O00220 | protein_coding | tolerated(0.1) | possibly_damaging(0.643) | TCGA-AA-3870-01 | Colorectum | colon adenocarcinoma | Female | >=65 | III/IV | Chemotherapy | folinic | CR |
| Page: 1 2 3 4 |
Top |
Related drugs of malignant transformation related genes |
| Identification of chemicals and drugs interact with genes involved in malignant transfromation |
| (DGIdb 4.0) |
| Entrez ID | Symbol | Category | Interaction Types | Drug Claim Name | Drug Name | PMIDs |
| 8797 | TNFRSF10A | DRUGGABLE GENOME, CELL SURFACE | Mapatumumab | MAPATUMUMAB | ||
| 8797 | TNFRSF10A | DRUGGABLE GENOME, CELL SURFACE | agonist | CHEMBL2108621 | MAPATUMUMAB | |
| 8797 | TNFRSF10A | DRUGGABLE GENOME, CELL SURFACE | SULINDAC | SULINDAC | 16030090 | |
| 8797 | TNFRSF10A | DRUGGABLE GENOME, CELL SURFACE | H2O2 | 18299966 | ||
| 8797 | TNFRSF10A | DRUGGABLE GENOME, CELL SURFACE | TRAIL | 12642685 | ||
| 8797 | TNFRSF10A | DRUGGABLE GENOME, CELL SURFACE | antibody | MAPATUMUMAB | MAPATUMUMAB | |
| 8797 | TNFRSF10A | DRUGGABLE GENOME, CELL SURFACE | 178101758 | |||
| 8797 | TNFRSF10A | DRUGGABLE GENOME, CELL SURFACE | agonist | CHEMBL2107846 | DULANERMIN | |
| 8797 | TNFRSF10A | DRUGGABLE GENOME, CELL SURFACE | antibody | MAPATUMUMAB | MAPATUMUMAB | |
| 8797 | TNFRSF10A | DRUGGABLE GENOME, CELL SURFACE | MAPATUMUMAB | MAPATUMUMAB |
| Page: 1 2 |

Copyright 2023-Present -The University of Texas Health Science Center at Houston |