
|
|||||
|
 | |
| |
| |
| |
| |
| |
|
Gene: TNFAIP8 |
Gene summary for TNFAIP8 |
| Gene information | Species | Human | Gene symbol | TNFAIP8 | Gene ID | 25816 |
| Gene name | TNF alpha induced protein 8 | |
| Gene Alias | GG2-1 | |
| Cytomap | 5q23.1 | |
| Gene Type | protein-coding | GO ID | GO:0006508 | UniProtAcc | O95379 |
Top |
Malignant transformation analysis |
| Identification of the aberrant gene expression in precancerous and cancerous lesions by comparing the gene expression of stem-like cells in diseased tissues with normal stem cells |
| Entrez ID | Symbol | Replicates | Species | Organ | Tissue | Adj P-value | Log2FC | Malignancy |
| 25816 | TNFAIP8 | LZE4T | Human | Esophagus | ESCC | 2.65e-22 | 6.46e-01 | 0.0811 |
| 25816 | TNFAIP8 | LZE7T | Human | Esophagus | ESCC | 7.31e-09 | 5.96e-01 | 0.0667 |
| 25816 | TNFAIP8 | LZE8T | Human | Esophagus | ESCC | 1.74e-18 | 8.59e-01 | 0.067 |
| 25816 | TNFAIP8 | LZE20T | Human | Esophagus | ESCC | 1.13e-04 | 1.99e-01 | 0.0662 |
| 25816 | TNFAIP8 | LZE24T | Human | Esophagus | ESCC | 1.24e-09 | 1.07e-01 | 0.0596 |
| 25816 | TNFAIP8 | LZE21T | Human | Esophagus | ESCC | 1.52e-08 | 7.95e-01 | 0.0655 |
| 25816 | TNFAIP8 | LZE6T | Human | Esophagus | ESCC | 1.25e-09 | 5.50e-01 | 0.0845 |
| 25816 | TNFAIP8 | P1T-E | Human | Esophagus | ESCC | 1.83e-03 | 5.06e-01 | 0.0875 |
| 25816 | TNFAIP8 | P2T-E | Human | Esophagus | ESCC | 4.13e-08 | 2.36e-01 | 0.1177 |
| 25816 | TNFAIP8 | P4T-E | Human | Esophagus | ESCC | 3.86e-33 | 1.02e+00 | 0.1323 |
| 25816 | TNFAIP8 | P5T-E | Human | Esophagus | ESCC | 1.13e-24 | 5.10e-01 | 0.1327 |
| 25816 | TNFAIP8 | P8T-E | Human | Esophagus | ESCC | 5.27e-10 | 2.72e-01 | 0.0889 |
| 25816 | TNFAIP8 | P9T-E | Human | Esophagus | ESCC | 8.35e-45 | 1.31e+00 | 0.1131 |
| 25816 | TNFAIP8 | P10T-E | Human | Esophagus | ESCC | 1.69e-17 | 2.09e-01 | 0.116 |
| 25816 | TNFAIP8 | P11T-E | Human | Esophagus | ESCC | 1.23e-08 | 4.17e-01 | 0.1426 |
| 25816 | TNFAIP8 | P12T-E | Human | Esophagus | ESCC | 5.53e-33 | 8.69e-01 | 0.1122 |
| 25816 | TNFAIP8 | P15T-E | Human | Esophagus | ESCC | 2.78e-30 | 7.57e-01 | 0.1149 |
| 25816 | TNFAIP8 | P16T-E | Human | Esophagus | ESCC | 1.73e-09 | 1.53e-02 | 0.1153 |
| 25816 | TNFAIP8 | P17T-E | Human | Esophagus | ESCC | 1.74e-06 | 4.07e-01 | 0.1278 |
| 25816 | TNFAIP8 | P19T-E | Human | Esophagus | ESCC | 2.92e-03 | 3.81e-01 | 0.1662 |
| Page: 1 2 3 4 5 6 |
| Tissue | Expression Dynamics | Abbreviation |
| Esophagus |  | ESCC: Esophageal squamous cell carcinoma |
| HGIN: High-grade intraepithelial neoplasias | ||
| LGIN: Low-grade intraepithelial neoplasias | ||
| Oral Cavity | 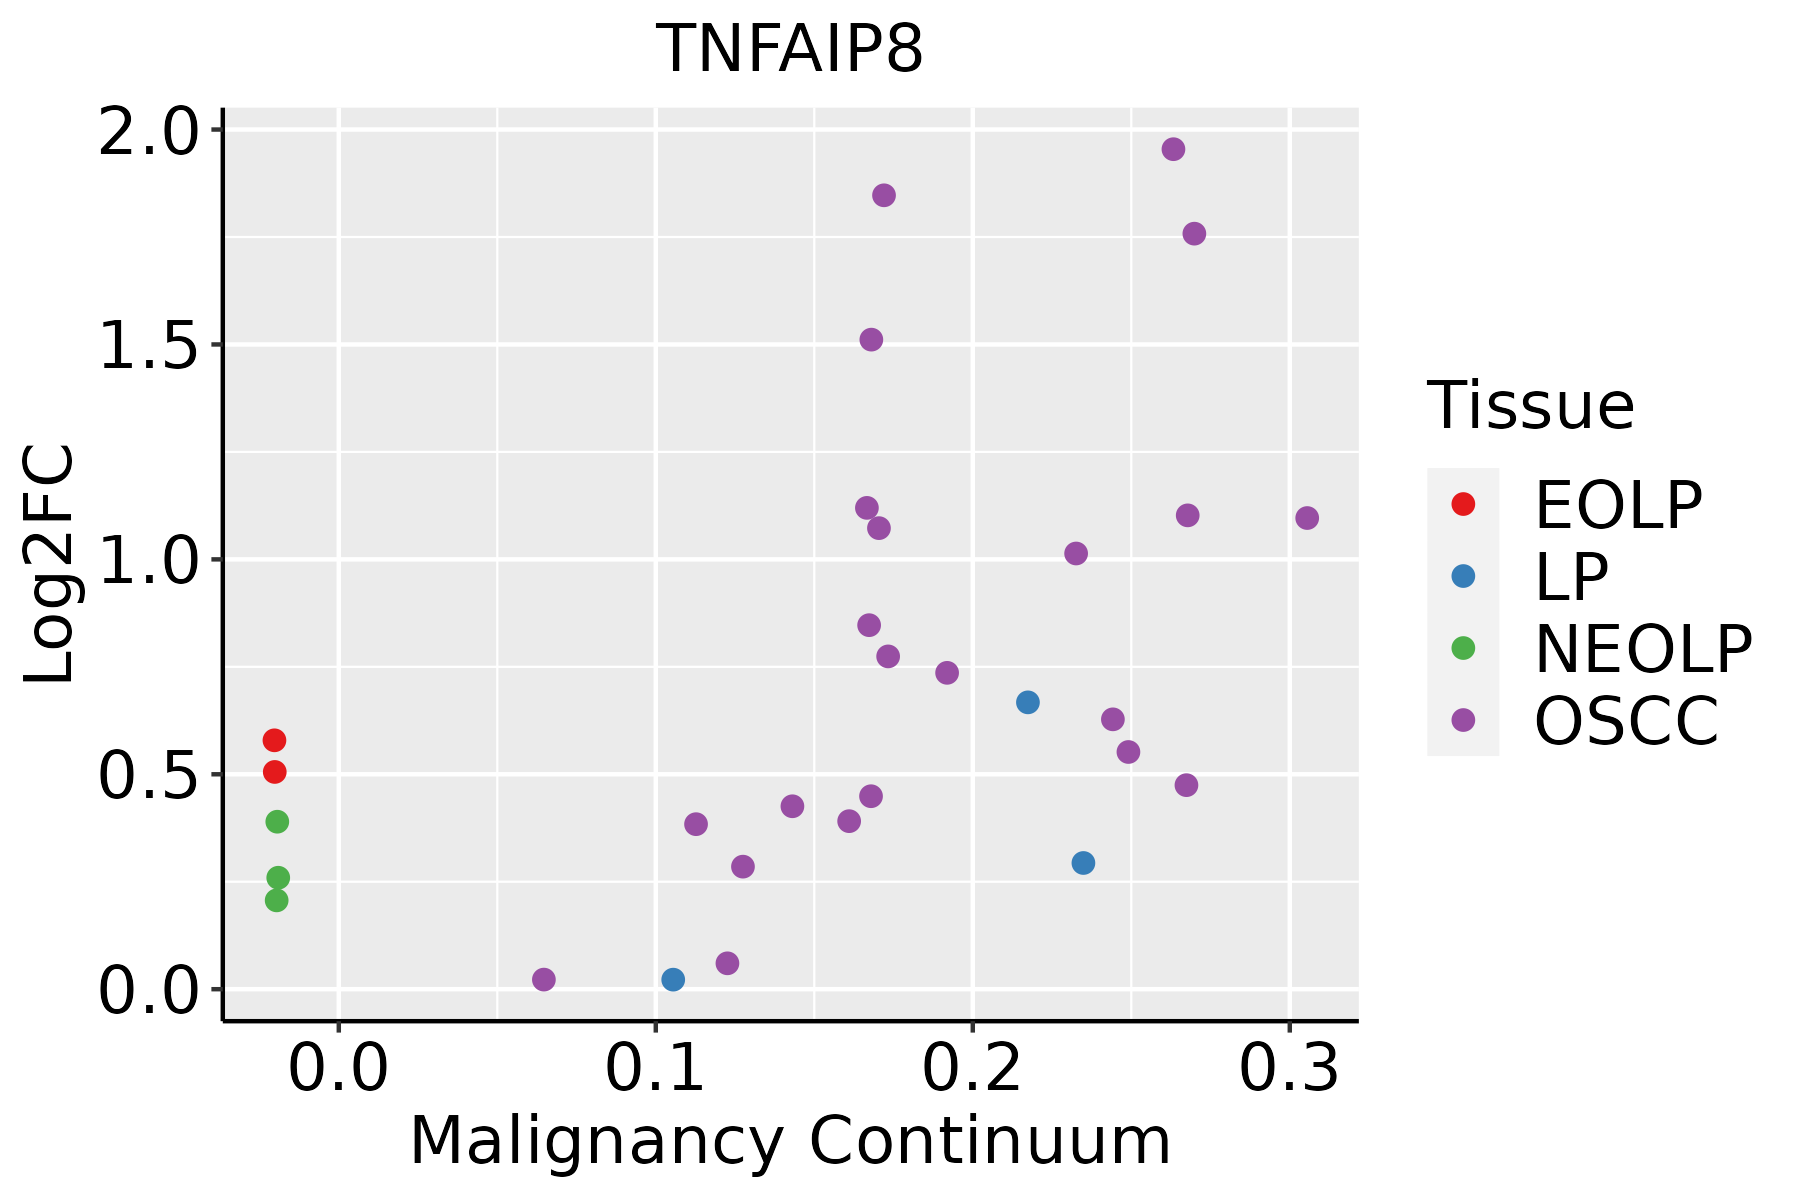 | EOLP: Erosive Oral lichen planus |
| LP: leukoplakia | ||
| NEOLP: Non-erosive oral lichen planus | ||
| OSCC: Oral squamous cell carcinoma | ||
| Prostate | 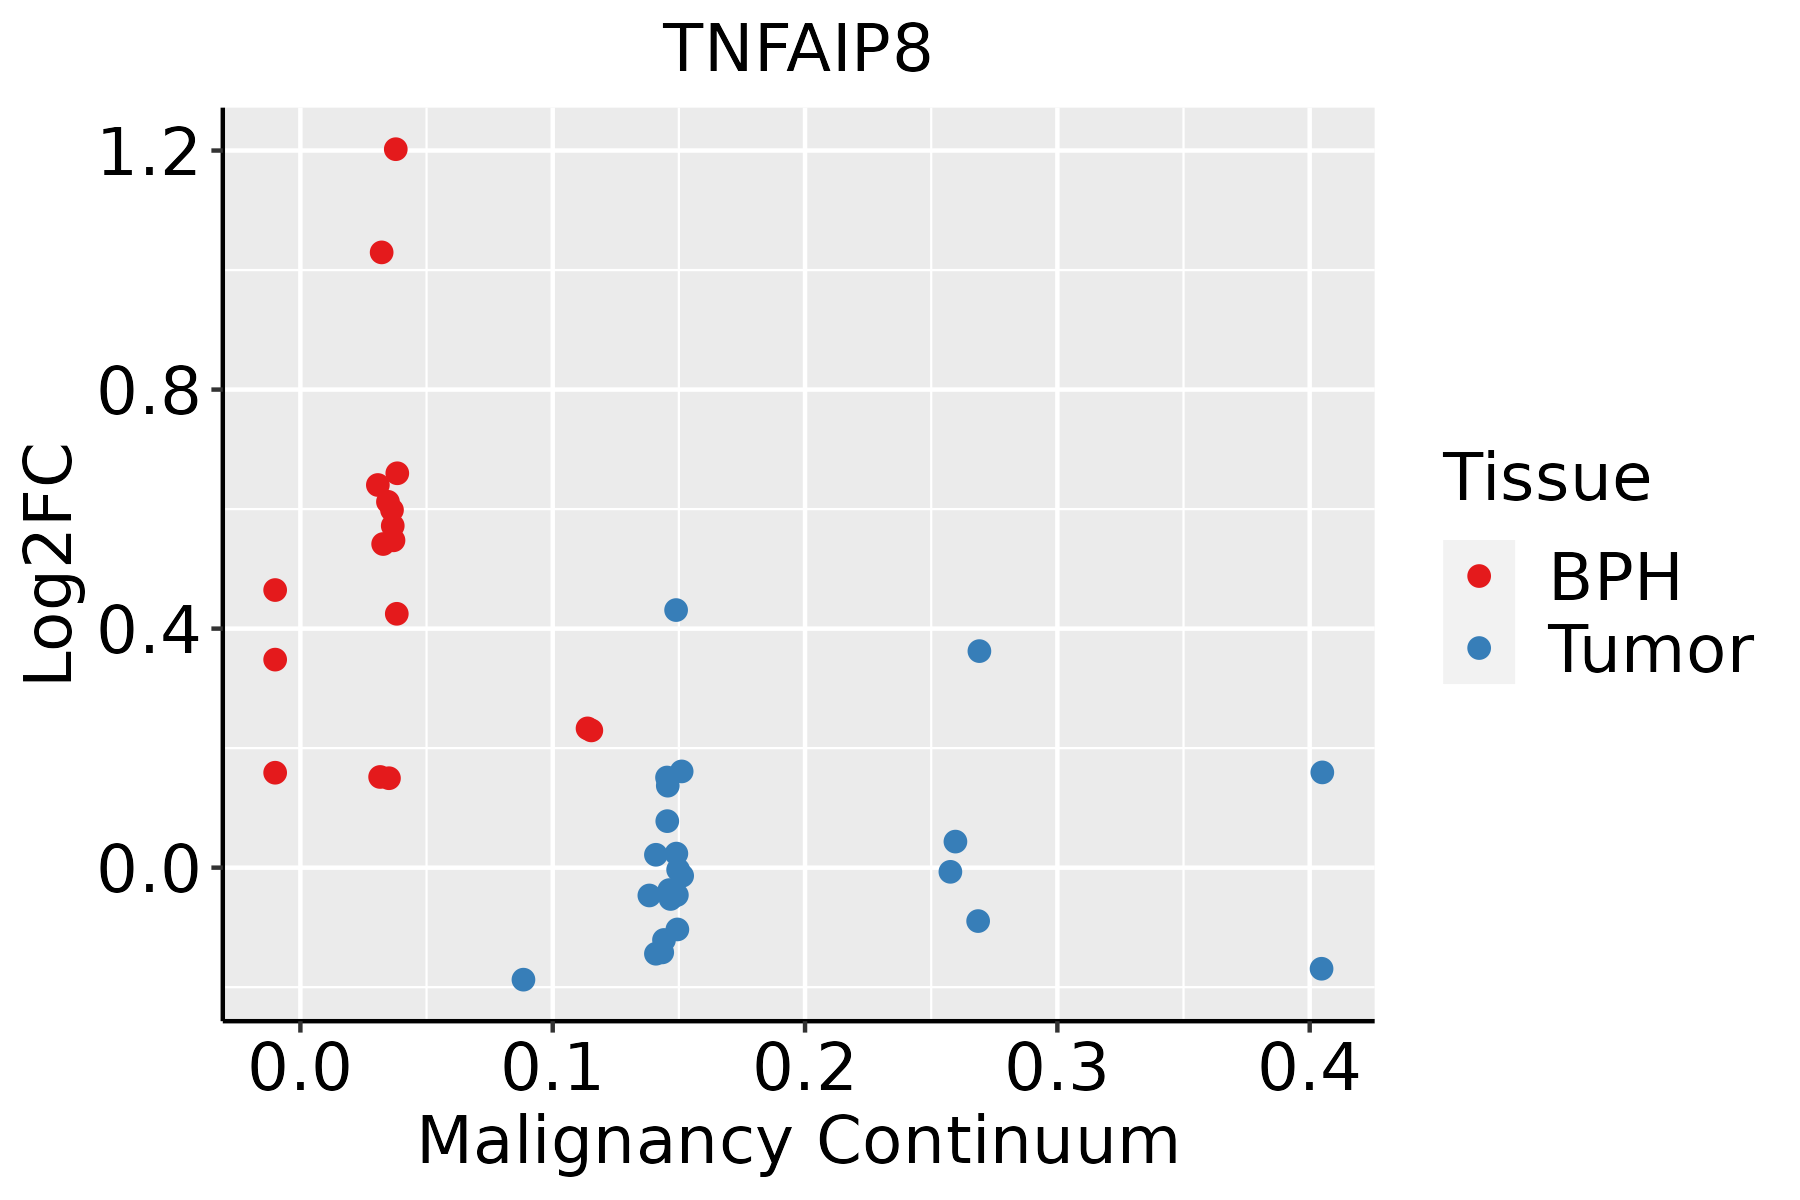 | BPH: Benign Prostatic Hyperplasia |
| Skin | 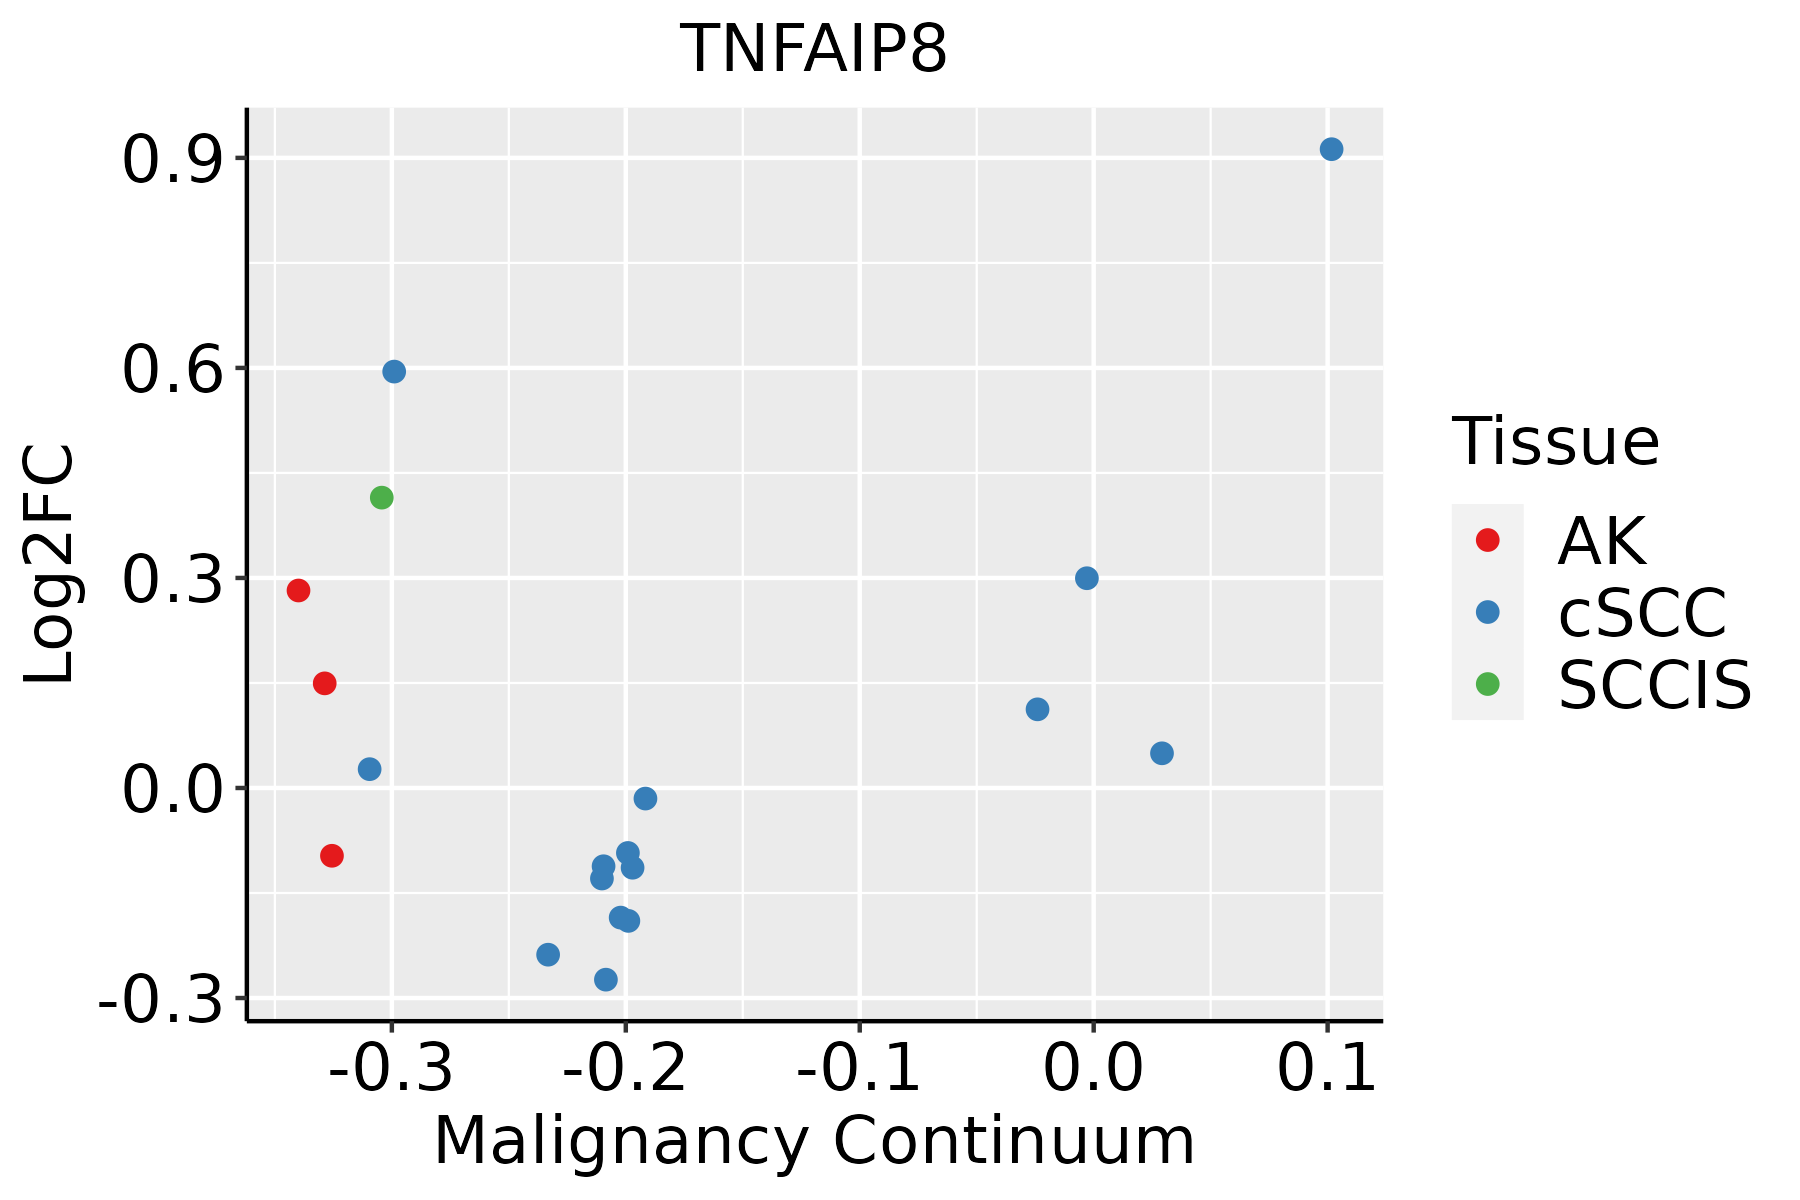 | AK: Actinic keratosis |
| cSCC: Cutaneous squamous cell carcinoma | ||
| SCCIS:squamous cell carcinoma in situ |
| ∗log2FC in expression of this searched gene in stem-like cells from each diseased tissue sample relative to stem-like cells in normal samples in each tissue plotted against the malignancy continuum. Samples are colored based on if they are from different disease stage. |
Top |
Malignant transformation related pathway analysis |
| Find out the enriched GO biological processes and KEGG pathways involved in transition from healthy to precancer to cancer |
| Tissue | Disease Stage | Enriched GO biological Processes |
| Colorectum | AD |  |
| Colorectum | SER |  |
| Colorectum | MSS |  |
| Colorectum | MSI-H |  |
| Colorectum | FAP |  |
| ∗Top 15 enriched GO BP terms are showed in the bar plot of each disease state in each tissue. Each row represents a significant GO biological process which is colored according to the -log10(p.adjust). |
| Page: 1 2 3 4 5 6 7 8 9 |
| GO ID | Tissue | Disease Stage | Description | Gene Ratio | Bg Ratio | pvalue | p.adjust | Count |
| GO:2000116111 | Esophagus | ESCC | regulation of cysteine-type endopeptidase activity | 158/8552 | 235/18723 | 1.67e-11 | 5.90e-10 | 158 |
| GO:0043281111 | Esophagus | ESCC | regulation of cysteine-type endopeptidase activity involved in apoptotic process | 143/8552 | 209/18723 | 2.12e-11 | 7.31e-10 | 143 |
| GO:0052547111 | Esophagus | ESCC | regulation of peptidase activity | 275/8552 | 461/18723 | 7.54e-10 | 1.88e-08 | 275 |
| GO:0052548111 | Esophagus | ESCC | regulation of endopeptidase activity | 253/8552 | 432/18723 | 3.68e-08 | 6.78e-07 | 253 |
| GO:2000117110 | Esophagus | ESCC | negative regulation of cysteine-type endopeptidase activity | 63/8552 | 86/18723 | 1.84e-07 | 2.88e-06 | 63 |
| GO:0043154110 | Esophagus | ESCC | negative regulation of cysteine-type endopeptidase activity involved in apoptotic process | 58/8552 | 78/18723 | 2.38e-07 | 3.61e-06 | 58 |
| GO:00319294 | Esophagus | ESCC | TOR signaling | 79/8552 | 126/18723 | 8.57e-05 | 6.21e-04 | 79 |
| GO:0045861111 | Esophagus | ESCC | negative regulation of proteolysis | 195/8552 | 351/18723 | 1.13e-04 | 7.85e-04 | 195 |
| GO:0051346110 | Esophagus | ESCC | negative regulation of hydrolase activity | 208/8552 | 379/18723 | 1.76e-04 | 1.14e-03 | 208 |
| GO:00320061 | Esophagus | ESCC | regulation of TOR signaling | 63/8552 | 104/18723 | 1.55e-03 | 7.29e-03 | 63 |
| GO:001046620 | Esophagus | ESCC | negative regulation of peptidase activity | 140/8552 | 262/18723 | 6.73e-03 | 2.46e-02 | 140 |
| GO:001095119 | Esophagus | ESCC | negative regulation of endopeptidase activity | 135/8552 | 252/18723 | 6.86e-03 | 2.51e-02 | 135 |
| GO:00319292 | Liver | Cirrhotic | TOR signaling | 44/4634 | 126/18723 | 6.69e-03 | 3.30e-02 | 44 |
| GO:00066444 | Liver | HCC | phospholipid metabolic process | 214/7958 | 383/18723 | 7.25e-08 | 1.48e-06 | 214 |
| GO:00192162 | Liver | HCC | regulation of lipid metabolic process | 181/7958 | 331/18723 | 4.58e-06 | 5.79e-05 | 181 |
| GO:00319291 | Liver | HCC | TOR signaling | 78/7958 | 126/18723 | 8.49e-06 | 9.97e-05 | 78 |
| GO:0032006 | Liver | HCC | regulation of TOR signaling | 63/7958 | 104/18723 | 1.50e-04 | 1.20e-03 | 63 |
| GO:001087621 | Liver | HCC | lipid localization | 228/7958 | 448/18723 | 1.80e-04 | 1.41e-03 | 228 |
| GO:01200092 | Liver | HCC | intermembrane lipid transfer | 33/7958 | 48/18723 | 2.12e-04 | 1.63e-03 | 33 |
| GO:003367411 | Liver | HCC | positive regulation of kinase activity | 230/7958 | 467/18723 | 1.72e-03 | 8.95e-03 | 230 |
| Page: 1 2 3 4 5 |
| Pathway ID | Tissue | Disease Stage | Description | Gene Ratio | Bg Ratio | pvalue | p.adjust | qvalue | Count |
| Page: 1 |
Top |
Cell-cell communication analysis |
| Identification of potential cell-cell interactions between two cell types and their ligand-receptor pairs for different disease states |
| Ligand | Receptor | LRpair | Pathway | Tissue | Disease Stage |
| Page: 1 |
Top |
Single-cell gene regulatory network inference analysis |
| Find out the significant the regulons (TFs) and the target genes of each regulon across cell types for different disease states |
| TF | Cell Type | Tissue | Disease Stage | Target Gene | RSS | Regulon Activity |
| ∗The dot plots of a searched regulon are shown for all cell subpopulations in each disease state of each tissue based on the regulon specific score inferred using pySCENIC and by calculating the average expression. |
| Page: 1 |
Top |
Somatic mutation of malignant transformation related genes |
| Annotation of somatic variants for genes involved in malignant transformation |
| Hugo Symbol | Variant Class | Variant Classification | dbSNP RS | HGVSc | HGVSp | HGVSp Short | SWISSPROT | BIOTYPE | SIFT | PolyPhen | Tumor Sample Barcode | Tissue | Histology | Sex | Age | Stage | Therapy Types | Drugs | Outcome |
| TNFAIP8 | SNV | Missense_Mutation | novel | c.243N>C | p.Glu81Asp | p.E81D | O95379 | protein_coding | tolerated(0.12) | possibly_damaging(0.63) | TCGA-VS-A8QM-01 | Cervix | cervical & endocervical cancer | Female | <65 | I/II | Chemotherapy | cisplatin | PD |
| TNFAIP8 | SNV | Missense_Mutation | novel | c.241G>C | p.Glu81Gln | p.E81Q | O95379 | protein_coding | tolerated(0.89) | benign(0.053) | TCGA-VS-A9UP-01 | Cervix | cervical & endocervical cancer | Female | <65 | I/II | Chemotherapy | cisplatin | PD |
| TNFAIP8 | SNV | Missense_Mutation | novel | c.193N>A | p.Glu65Lys | p.E65K | O95379 | protein_coding | deleterious(0.01) | probably_damaging(0.963) | TCGA-VS-AA62-01 | Cervix | cervical & endocervical cancer | Female | <65 | I/II | Chemotherapy | cisplatin | PD |
| TNFAIP8 | SNV | Missense_Mutation | c.569N>G | p.Phe190Cys | p.F190C | O95379 | protein_coding | tolerated(0.38) | possibly_damaging(0.906) | TCGA-AA-A010-01 | Colorectum | colon adenocarcinoma | Female | <65 | I/II | Chemotherapy | folinic | CR | |
| TNFAIP8 | SNV | Missense_Mutation | rs142090608 | c.373N>A | p.Val125Met | p.V125M | O95379 | protein_coding | tolerated(0.1) | probably_damaging(0.964) | TCGA-WS-AB45-01 | Colorectum | colon adenocarcinoma | Female | <65 | I/II | Unknown | Unknown | SD |
| TNFAIP8 | SNV | Missense_Mutation | novel | c.542N>A | p.Ala181Asp | p.A181D | O95379 | protein_coding | tolerated(0.35) | probably_damaging(0.918) | TCGA-A5-A0G2-01 | Endometrium | uterine corpus endometrioid carcinoma | Female | <65 | III/IV | Unknown | Unknown | SD |
| TNFAIP8 | SNV | Missense_Mutation | rs751972765 | c.151N>A | p.Ala51Thr | p.A51T | O95379 | protein_coding | deleterious(0.02) | benign(0.055) | TCGA-AP-A059-01 | Endometrium | uterine corpus endometrioid carcinoma | Female | >=65 | I/II | Unknown | Unknown | SD |
| TNFAIP8 | SNV | Missense_Mutation | c.296N>T | p.Arg99Met | p.R99M | O95379 | protein_coding | deleterious(0) | probably_damaging(0.998) | TCGA-AX-A05Z-01 | Endometrium | uterine corpus endometrioid carcinoma | Female | <65 | III/IV | Chemotherapy | adriamycin | SD | |
| TNFAIP8 | SNV | Missense_Mutation | novel | c.243N>T | p.Glu81Asp | p.E81D | O95379 | protein_coding | tolerated(0.12) | possibly_damaging(0.63) | TCGA-QF-A5YS-01 | Endometrium | uterine corpus endometrioid carcinoma | Female | <65 | I/II | Chemotherapy | carboplatin | CR |
| TNFAIP8 | SNV | Missense_Mutation | c.556C>T | p.Pro186Ser | p.P186S | O95379 | protein_coding | tolerated(0.24) | possibly_damaging(0.852) | TCGA-18-3409-01 | Lung | lung squamous cell carcinoma | Male | >=65 | I/II | Unknown | Unknown | PD |
| Page: 1 2 |
Top |
Related drugs of malignant transformation related genes |
| Identification of chemicals and drugs interact with genes involved in malignant transfromation |
| (DGIdb 4.0) |
| Entrez ID | Symbol | Category | Interaction Types | Drug Claim Name | Drug Name | PMIDs |
| Page: 1 |

Copyright 2023-Present -The University of Texas Health Science Center at Houston |