
|
|||||
|
 | |
| |
| |
| |
| |
| |
|
Gene: TNFAIP6 |
Gene summary for TNFAIP6 |
| Gene information | Species | Human | Gene symbol | TNFAIP6 | Gene ID | 7130 |
| Gene name | TNF alpha induced protein 6 | |
| Gene Alias | TSG-6 | |
| Cytomap | 2q23.3 | |
| Gene Type | protein-coding | GO ID | GO:0000003 | UniProtAcc | P98066 |
Top |
Malignant transformation analysis |
| Identification of the aberrant gene expression in precancerous and cancerous lesions by comparing the gene expression of stem-like cells in diseased tissues with normal stem cells |
| Entrez ID | Symbol | Replicates | Species | Organ | Tissue | Adj P-value | Log2FC | Malignancy |
| 7130 | TNFAIP6 | GSM4909281 | Human | Breast | IDC | 1.39e-03 | -2.76e-01 | 0.21 |
| 7130 | TNFAIP6 | GSM4909282 | Human | Breast | IDC | 6.80e-14 | 4.73e-01 | -0.0288 |
| 7130 | TNFAIP6 | GSM4909285 | Human | Breast | IDC | 2.88e-05 | -2.87e-01 | 0.21 |
| 7130 | TNFAIP6 | GSM4909286 | Human | Breast | IDC | 3.69e-10 | -3.26e-01 | 0.1081 |
| 7130 | TNFAIP6 | GSM4909287 | Human | Breast | IDC | 1.48e-07 | -3.04e-01 | 0.2057 |
| 7130 | TNFAIP6 | GSM4909290 | Human | Breast | IDC | 1.11e-08 | -3.26e-01 | 0.2096 |
| 7130 | TNFAIP6 | GSM4909291 | Human | Breast | IDC | 1.07e-03 | -3.06e-01 | 0.1753 |
| 7130 | TNFAIP6 | GSM4909293 | Human | Breast | IDC | 1.75e-09 | -3.24e-01 | 0.1581 |
| 7130 | TNFAIP6 | GSM4909294 | Human | Breast | IDC | 7.71e-11 | -3.26e-01 | 0.2022 |
| 7130 | TNFAIP6 | GSM4909295 | Human | Breast | IDC | 4.83e-05 | -3.26e-01 | 0.0898 |
| 7130 | TNFAIP6 | GSM4909296 | Human | Breast | IDC | 8.04e-10 | -3.15e-01 | 0.1524 |
| 7130 | TNFAIP6 | GSM4909297 | Human | Breast | IDC | 7.71e-11 | -3.20e-01 | 0.1517 |
| 7130 | TNFAIP6 | GSM4909298 | Human | Breast | IDC | 7.71e-11 | -3.26e-01 | 0.1551 |
| 7130 | TNFAIP6 | GSM4909299 | Human | Breast | IDC | 3.74e-05 | -3.12e-01 | 0.035 |
| 7130 | TNFAIP6 | GSM4909300 | Human | Breast | IDC | 2.71e-04 | -3.26e-01 | 0.0334 |
| 7130 | TNFAIP6 | GSM4909301 | Human | Breast | IDC | 1.69e-10 | -3.26e-01 | 0.1577 |
| 7130 | TNFAIP6 | GSM4909302 | Human | Breast | IDC | 3.88e-07 | -3.01e-01 | 0.1545 |
| 7130 | TNFAIP6 | GSM4909303 | Human | Breast | IDC | 2.16e-02 | -3.26e-01 | 0.0438 |
| 7130 | TNFAIP6 | GSM4909304 | Human | Breast | IDC | 1.69e-10 | -3.26e-01 | 0.1636 |
| 7130 | TNFAIP6 | GSM4909305 | Human | Breast | IDC | 2.42e-08 | -3.26e-01 | 0.0436 |
| Page: 1 2 3 4 |
| Tissue | Expression Dynamics | Abbreviation |
| Breast | 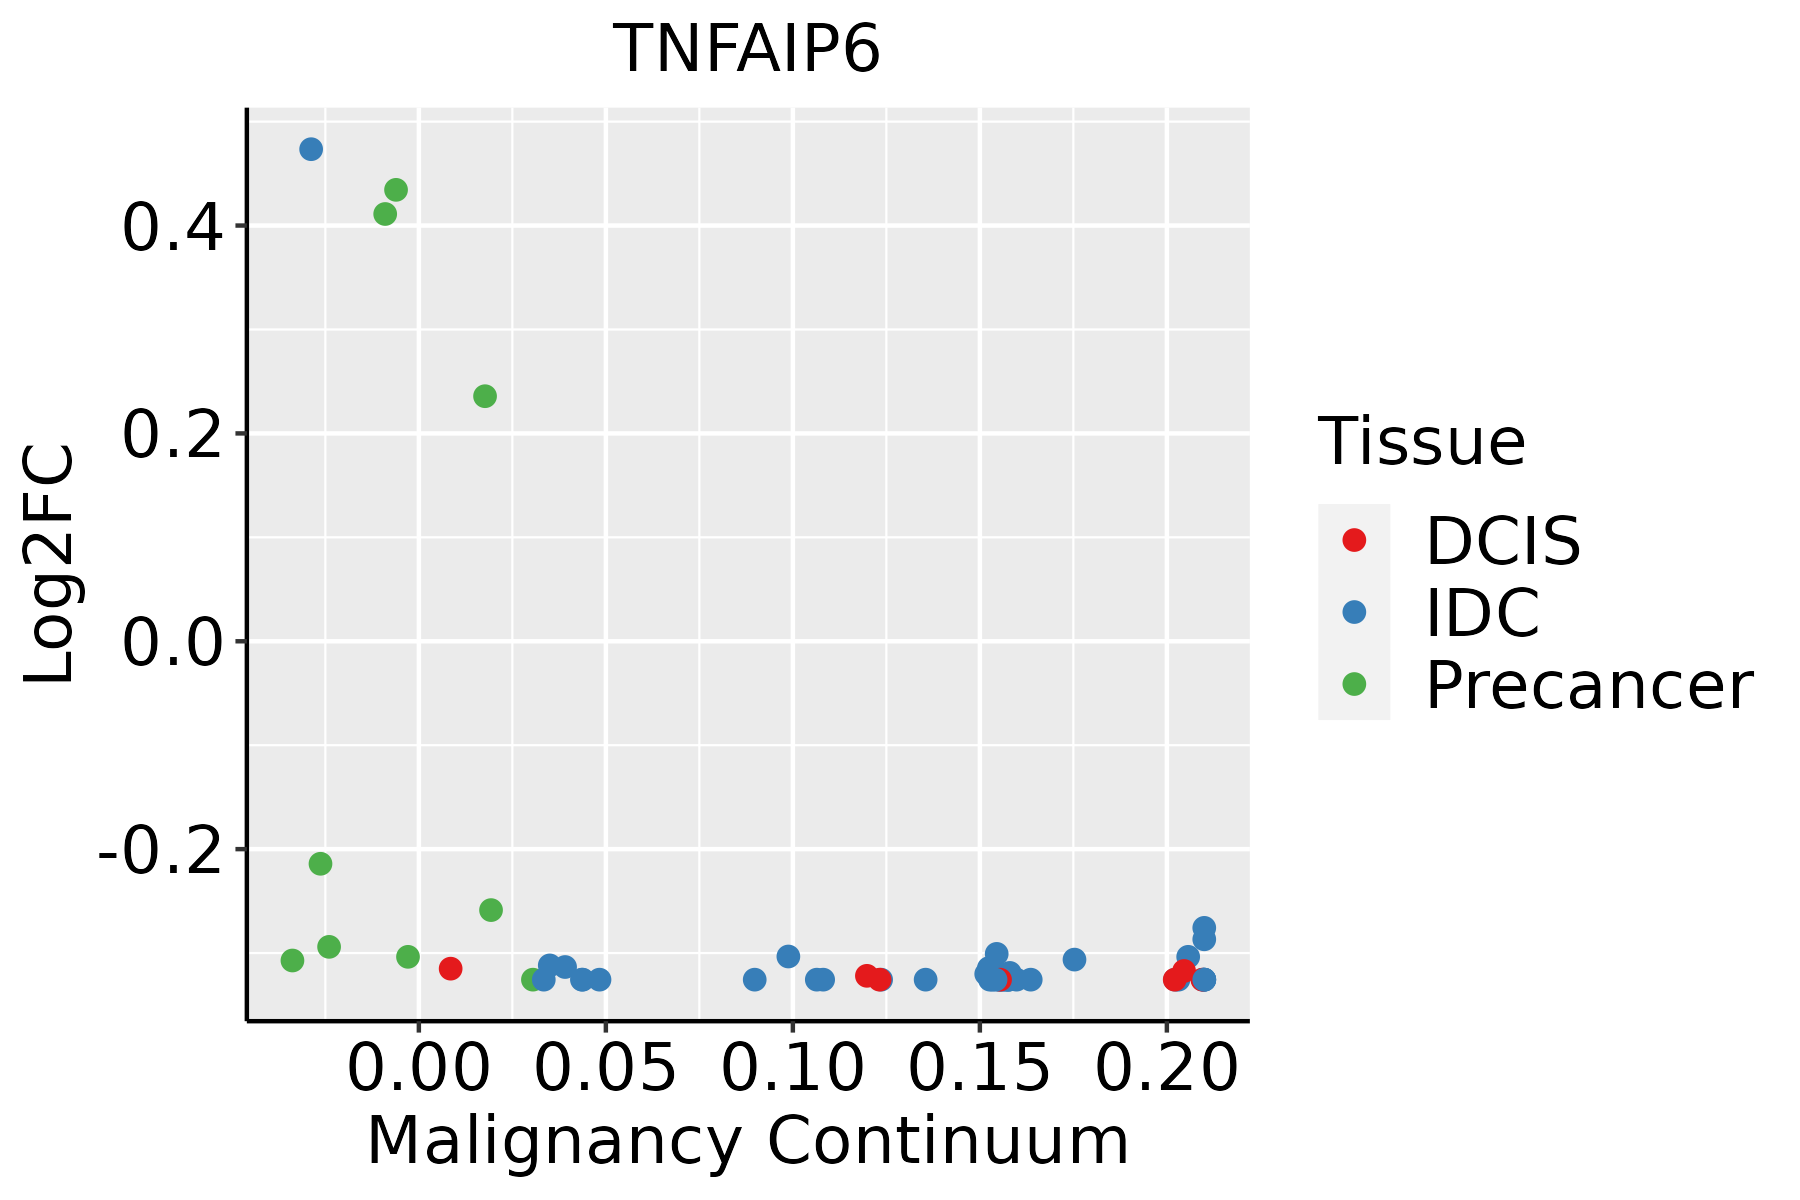 | IDC: Invasive ductal carcinoma |
| DCIS: Ductal carcinoma in situ | ||
| Precancer(BRCA1-mut): Precancerous lesion from BRCA1 mutation carriers | ||
| Esophagus | 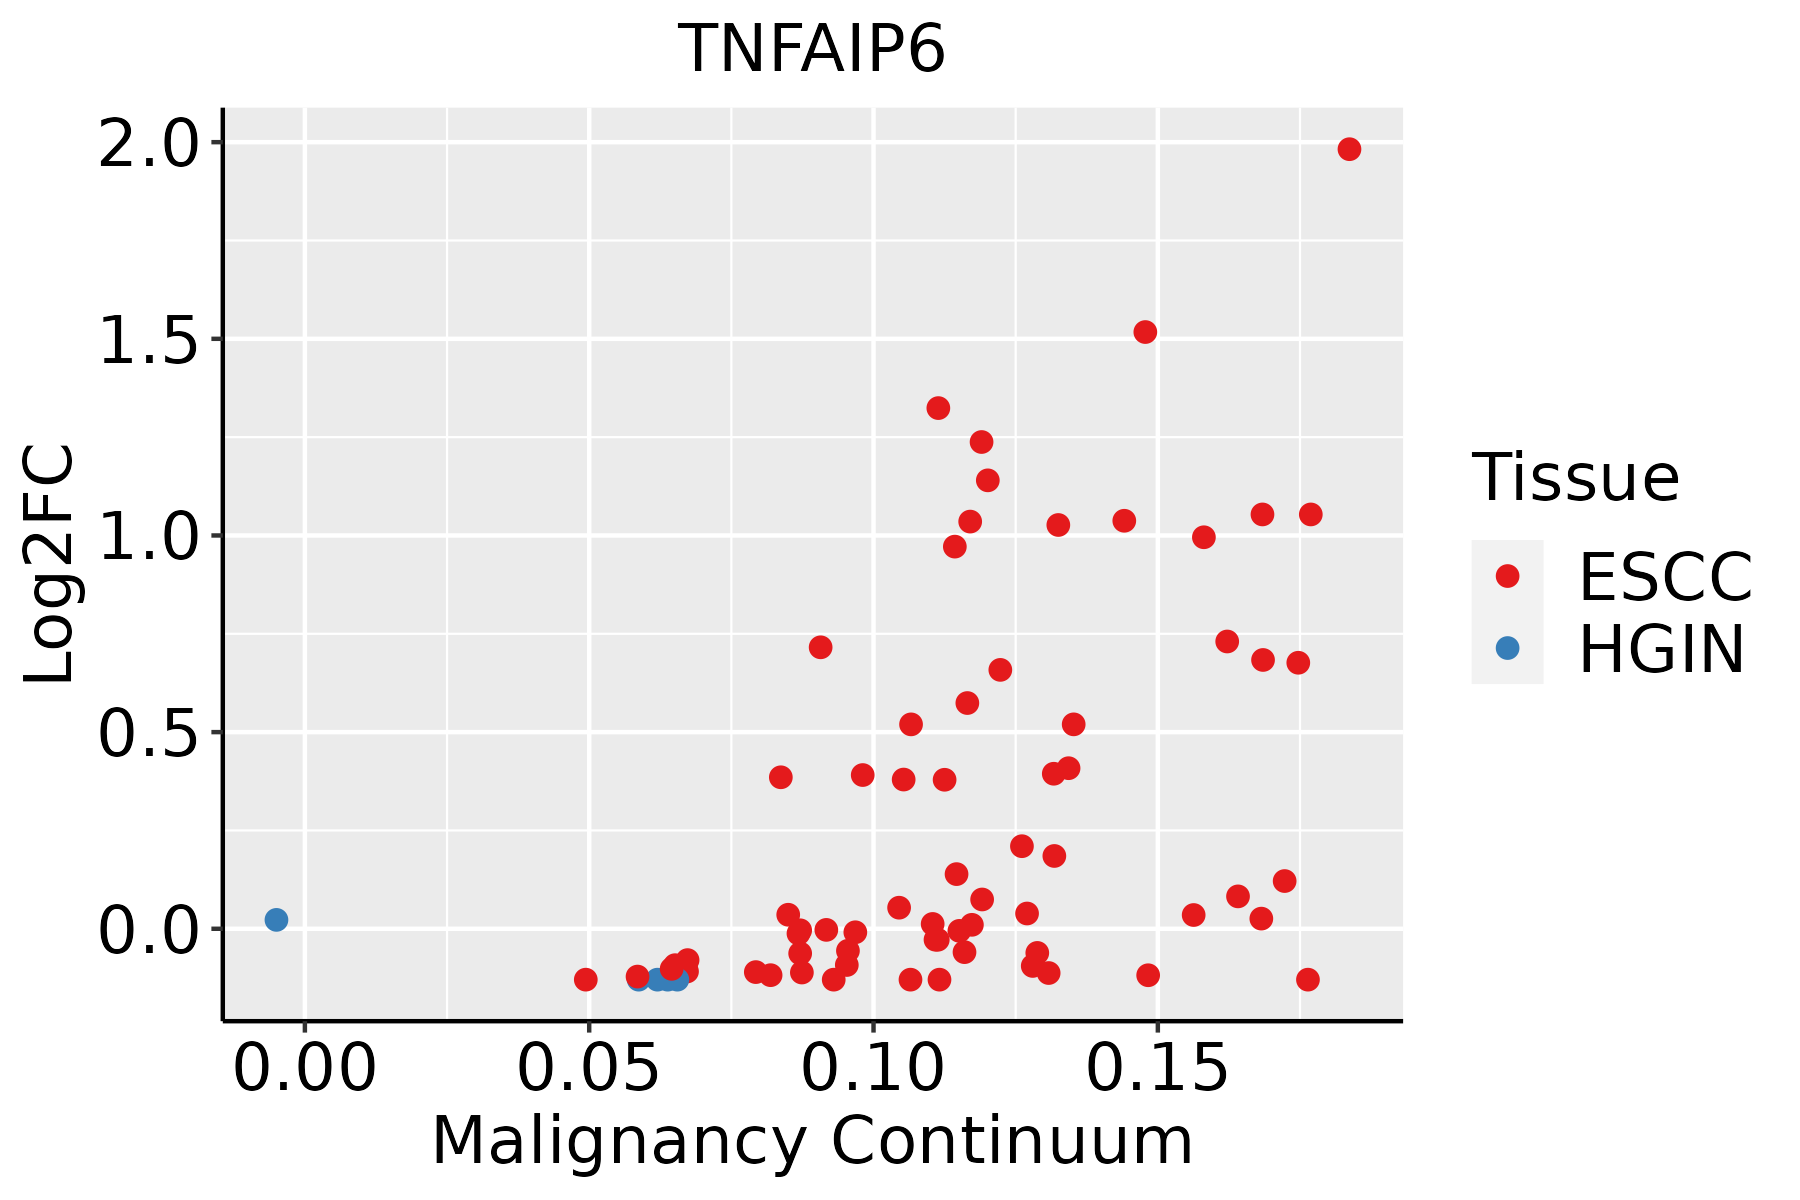 | ESCC: Esophageal squamous cell carcinoma |
| HGIN: High-grade intraepithelial neoplasias | ||
| LGIN: Low-grade intraepithelial neoplasias | ||
| Thyroid | 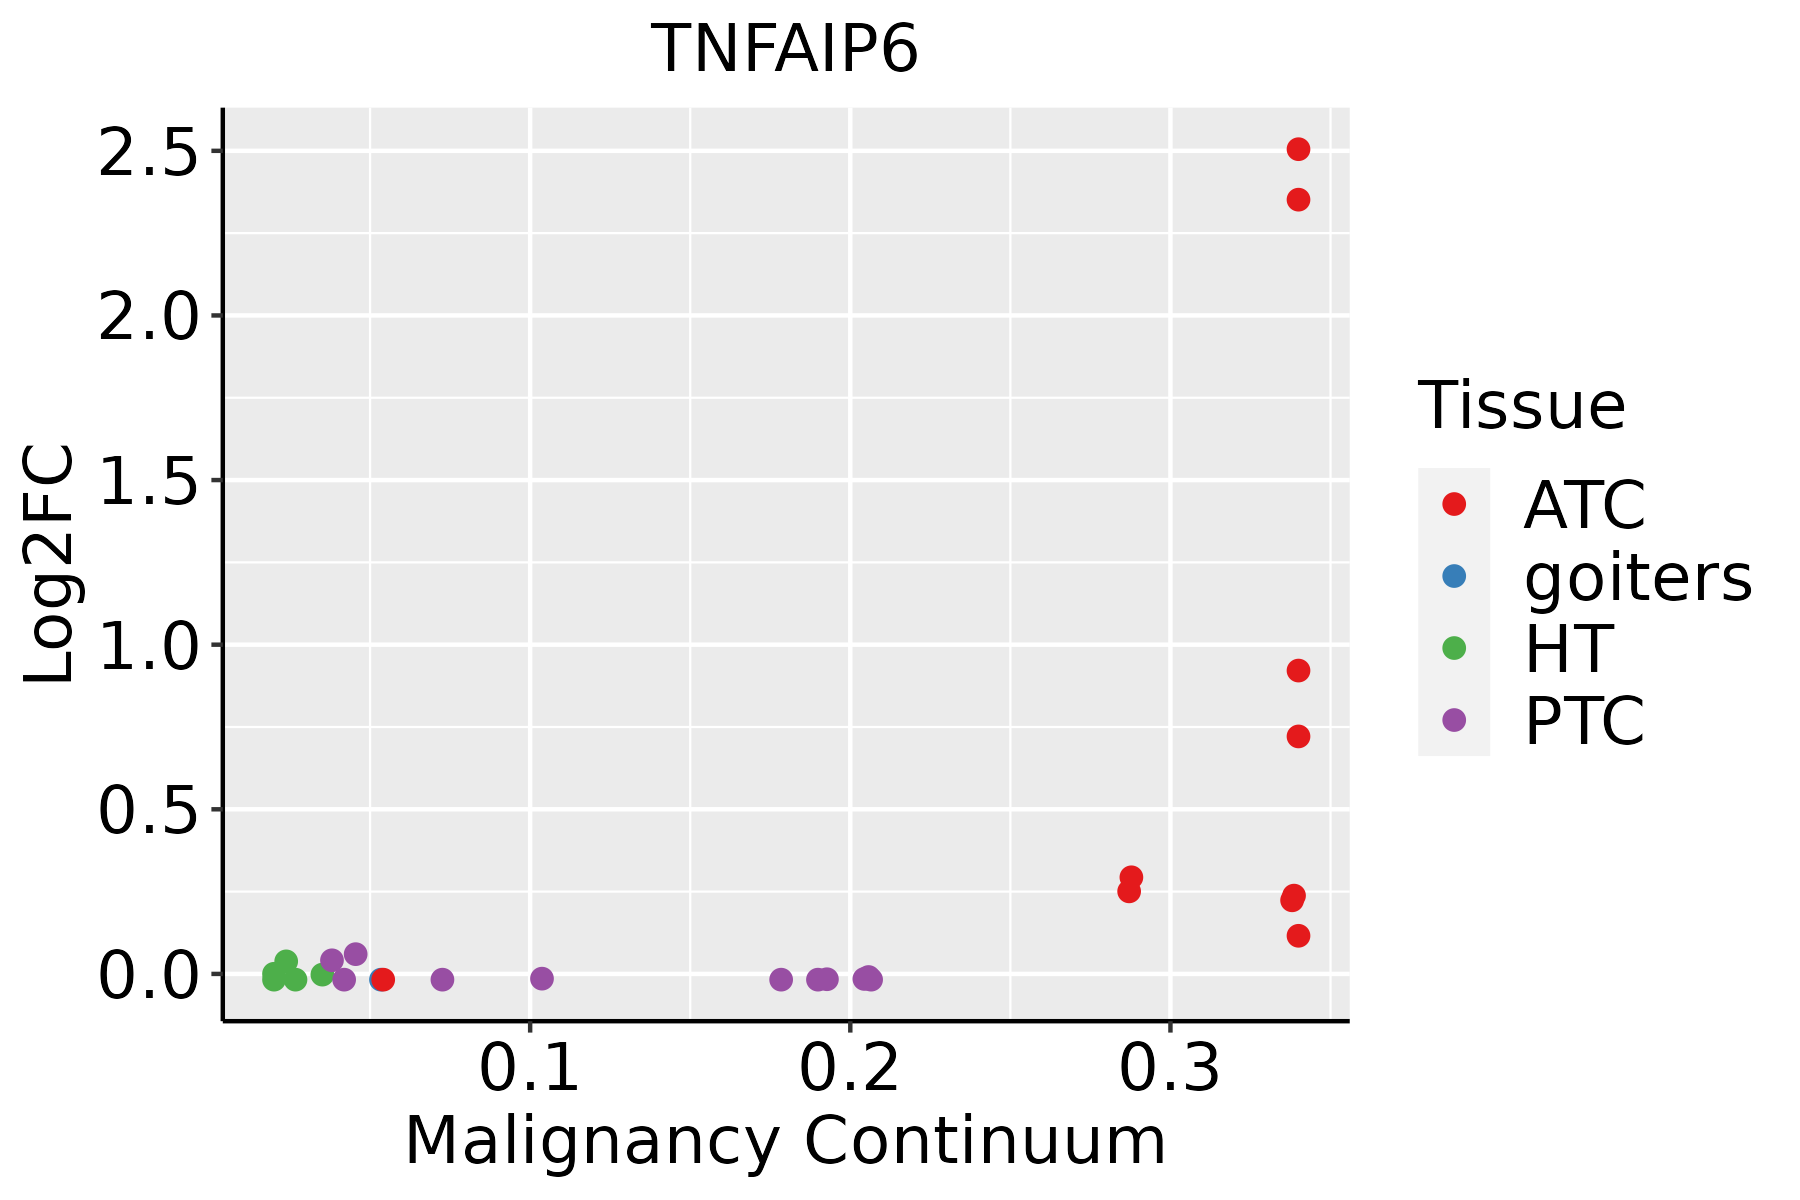 | ATC: Anaplastic thyroid cancer |
| HT: Hashimoto's thyroiditis | ||
| PTC: Papillary thyroid cancer |
| ∗log2FC in expression of this searched gene in stem-like cells from each diseased tissue sample relative to stem-like cells in normal samples in each tissue plotted against the malignancy continuum. Samples are colored based on if they are from different disease stage. |
Top |
Malignant transformation related pathway analysis |
| Find out the enriched GO biological processes and KEGG pathways involved in transition from healthy to precancer to cancer |
| Tissue | Disease Stage | Enriched GO biological Processes |
| Colorectum | AD |  |
| Colorectum | SER |  |
| Colorectum | MSS |  |
| Colorectum | MSI-H |  |
| Colorectum | FAP |  |
| ∗Top 15 enriched GO BP terms are showed in the bar plot of each disease state in each tissue. Each row represents a significant GO biological process which is colored according to the -log10(p.adjust). |
| Page: 1 2 3 4 5 6 7 8 9 |
| GO ID | Tissue | Disease Stage | Description | Gene Ratio | Bg Ratio | pvalue | p.adjust | Count |
| GO:0050727 | Breast | Precancer | regulation of inflammatory response | 44/1080 | 386/18723 | 1.26e-05 | 3.22e-04 | 44 |
| GO:00507271 | Breast | IDC | regulation of inflammatory response | 48/1434 | 386/18723 | 5.99e-04 | 7.54e-03 | 48 |
| GO:00507272 | Breast | DCIS | regulation of inflammatory response | 46/1390 | 386/18723 | 9.91e-04 | 1.10e-02 | 46 |
| GO:00321021 | Breast | DCIS | negative regulation of response to external stimulus | 46/1390 | 420/18723 | 5.19e-03 | 3.81e-02 | 46 |
| Page: 1 |
| Pathway ID | Tissue | Disease Stage | Description | Gene Ratio | Bg Ratio | pvalue | p.adjust | qvalue | Count |
| Page: 1 |
Top |
Cell-cell communication analysis |
| Identification of potential cell-cell interactions between two cell types and their ligand-receptor pairs for different disease states |
| Ligand | Receptor | LRpair | Pathway | Tissue | Disease Stage |
| Page: 1 |
Top |
Single-cell gene regulatory network inference analysis |
| Find out the significant the regulons (TFs) and the target genes of each regulon across cell types for different disease states |
| TF | Cell Type | Tissue | Disease Stage | Target Gene | RSS | Regulon Activity |
| ∗The dot plots of a searched regulon are shown for all cell subpopulations in each disease state of each tissue based on the regulon specific score inferred using pySCENIC and by calculating the average expression. |
| Page: 1 |
Top |
Somatic mutation of malignant transformation related genes |
| Annotation of somatic variants for genes involved in malignant transformation |
| Hugo Symbol | Variant Class | Variant Classification | dbSNP RS | HGVSc | HGVSp | HGVSp Short | SWISSPROT | BIOTYPE | SIFT | PolyPhen | Tumor Sample Barcode | Tissue | Histology | Sex | Age | Stage | Therapy Types | Drugs | Outcome |
| TNFAIP6 | SNV | Missense_Mutation | c.81C>A | p.Asn27Lys | p.N27K | P98066 | protein_coding | deleterious(0.01) | probably_damaging(0.994) | TCGA-A8-A09W-01 | Breast | breast invasive carcinoma | Female | >=65 | III/IV | Unknown | Unknown | SD | |
| TNFAIP6 | SNV | Missense_Mutation | c.637N>A | p.Glu213Lys | p.E213K | P98066 | protein_coding | tolerated(0.22) | benign(0.039) | TCGA-AC-A23H-01 | Breast | breast invasive carcinoma | Female | >=65 | I/II | Unknown | Unknown | PD | |
| TNFAIP6 | SNV | Missense_Mutation | rs777710715 | c.466N>A | p.Glu156Lys | p.E156K | P98066 | protein_coding | tolerated(0.1) | benign(0.037) | TCGA-AN-A046-01 | Breast | breast invasive carcinoma | Female | >=65 | I/II | Unknown | Unknown | SD |
| TNFAIP6 | SNV | Missense_Mutation | rs750979012 | c.106N>A | p.Gly36Ser | p.G36S | P98066 | protein_coding | deleterious(0) | probably_damaging(1) | TCGA-BH-A208-01 | Breast | breast invasive carcinoma | Female | <65 | I/II | Unknown | Unknown | SD |
| TNFAIP6 | SNV | Missense_Mutation | rs777710715 | c.466N>A | p.Glu156Lys | p.E156K | P98066 | protein_coding | tolerated(0.1) | benign(0.037) | TCGA-DG-A2KK-01 | Cervix | cervical & endocervical cancer | Female | <65 | III/IV | Chemotherapy | cisplatin | SD |
| TNFAIP6 | SNV | Missense_Mutation | rs564029423 | c.412N>A | p.Val138Ile | p.V138I | P98066 | protein_coding | tolerated(0.38) | benign(0) | TCGA-AA-3989-01 | Colorectum | colon adenocarcinoma | Male | >=65 | III/IV | Unknown | Unknown | PD |
| TNFAIP6 | SNV | Missense_Mutation | rs200351871 | c.347N>A | p.Arg116His | p.R116H | P98066 | protein_coding | deleterious(0.03) | probably_damaging(0.999) | TCGA-AD-6888-01 | Colorectum | colon adenocarcinoma | Male | >=65 | III/IV | Unknown | Unknown | PD |
| TNFAIP6 | SNV | Missense_Mutation | novel | c.803A>C | p.Asn268Thr | p.N268T | P98066 | protein_coding | tolerated_low_confidence(0.09) | benign(0.015) | TCGA-AG-3892-01 | Colorectum | rectum adenocarcinoma | Female | <65 | I/II | Unknown | Unknown | SD |
| TNFAIP6 | SNV | Missense_Mutation | c.244T>C | p.Cys82Arg | p.C82R | P98066 | protein_coding | deleterious(0) | probably_damaging(0.999) | TCGA-AG-4007-01 | Colorectum | rectum adenocarcinoma | Male | >=65 | III/IV | Unknown | Unknown | SD | |
| TNFAIP6 | SNV | Missense_Mutation | c.773A>C | p.Asn258Thr | p.N258T | P98066 | protein_coding | tolerated(0.17) | probably_damaging(0.971) | TCGA-DY-A1DF-01 | Colorectum | rectum adenocarcinoma | Female | >=65 | III/IV | Unknown | Unknown | SD |
| Page: 1 2 3 4 5 |
Top |
Related drugs of malignant transformation related genes |
| Identification of chemicals and drugs interact with genes involved in malignant transfromation |
| (DGIdb 4.0) |
| Entrez ID | Symbol | Category | Interaction Types | Drug Claim Name | Drug Name | PMIDs |
| Page: 1 |

Copyright 2023-Present -The University of Texas Health Science Center at Houston |