
|
|||||
|
 | |
| |
| |
| |
| |
| |
|
Gene: TNFAIP2 |
Gene summary for TNFAIP2 |
| Gene information | Species | Human | Gene symbol | TNFAIP2 | Gene ID | 7127 |
| Gene name | TNF alpha induced protein 2 | |
| Gene Alias | B94 | |
| Cytomap | 14q32.32 | |
| Gene Type | protein-coding | GO ID | GO:0001525 | UniProtAcc | Q03169 |
Top |
Malignant transformation analysis |
| Identification of the aberrant gene expression in precancerous and cancerous lesions by comparing the gene expression of stem-like cells in diseased tissues with normal stem cells |
| Entrez ID | Symbol | Replicates | Species | Organ | Tissue | Adj P-value | Log2FC | Malignancy |
| 7127 | TNFAIP2 | AEH-subject1 | Human | Endometrium | AEH | 4.35e-23 | 6.15e-01 | -0.3059 |
| 7127 | TNFAIP2 | AEH-subject2 | Human | Endometrium | AEH | 3.61e-22 | 7.30e-01 | -0.2525 |
| 7127 | TNFAIP2 | EEC-subject2 | Human | Endometrium | EEC | 1.81e-27 | 8.22e-01 | -0.2607 |
| 7127 | TNFAIP2 | EEC-subject3 | Human | Endometrium | EEC | 4.76e-15 | 4.56e-01 | -0.2525 |
| 7127 | TNFAIP2 | GSM5276934 | Human | Endometrium | EEC | 1.00e-05 | 3.48e-01 | -0.0913 |
| 7127 | TNFAIP2 | GSM6177620_NYU_UCEC1_lib1_lib1 | Human | Endometrium | EEC | 4.13e-14 | 2.83e-01 | -0.1869 |
| 7127 | TNFAIP2 | GSM6177620_NYU_UCEC1_lib2_lib2 | Human | Endometrium | EEC | 1.21e-13 | 3.08e-01 | -0.1875 |
| 7127 | TNFAIP2 | GSM6177620_NYU_UCEC1_lib3_lib3 | Human | Endometrium | EEC | 1.45e-16 | 3.60e-01 | -0.1883 |
| 7127 | TNFAIP2 | GSM6177621_NYU_UCEC2_lib1_lib1 | Human | Endometrium | EEC | 1.62e-08 | 1.53e-01 | -0.1934 |
| 7127 | TNFAIP2 | GSM6177622_NYU_UCEC3_lib1_lib1 | Human | Endometrium | EEC | 1.17e-15 | 1.59e-01 | -0.1917 |
| 7127 | TNFAIP2 | GSM6177622_NYU_UCEC3_lib2_lib2 | Human | Endometrium | EEC | 1.70e-19 | 2.02e-01 | -0.1916 |
| 7127 | TNFAIP2 | GSM6177623_NYU_UCEC3_Vis | Human | Endometrium | EEC | 2.74e-23 | 6.92e-01 | -0.1269 |
| 7127 | TNFAIP2 | LZE4T | Human | Esophagus | ESCC | 3.42e-02 | 7.20e-02 | 0.0811 |
| 7127 | TNFAIP2 | LZE5T | Human | Esophagus | ESCC | 4.66e-11 | 1.65e+00 | 0.0514 |
| 7127 | TNFAIP2 | LZE7T | Human | Esophagus | ESCC | 6.21e-10 | 7.59e-01 | 0.0667 |
| 7127 | TNFAIP2 | LZE8T | Human | Esophagus | ESCC | 1.29e-16 | 9.17e-01 | 0.067 |
| 7127 | TNFAIP2 | LZE20T | Human | Esophagus | ESCC | 1.68e-11 | 1.08e+00 | 0.0662 |
| 7127 | TNFAIP2 | LZE21D1 | Human | Esophagus | HGIN | 6.13e-05 | 6.33e-01 | 0.0632 |
| 7127 | TNFAIP2 | LZE22T | Human | Esophagus | ESCC | 5.11e-06 | 5.53e-01 | 0.068 |
| 7127 | TNFAIP2 | LZE21T | Human | Esophagus | ESCC | 2.51e-12 | 1.13e+00 | 0.0655 |
| Page: 1 2 3 4 5 6 |
| Tissue | Expression Dynamics | Abbreviation |
| Endometrium |  | AEH: Atypical endometrial hyperplasia |
| EEC: Endometrioid Cancer | ||
| Esophagus | 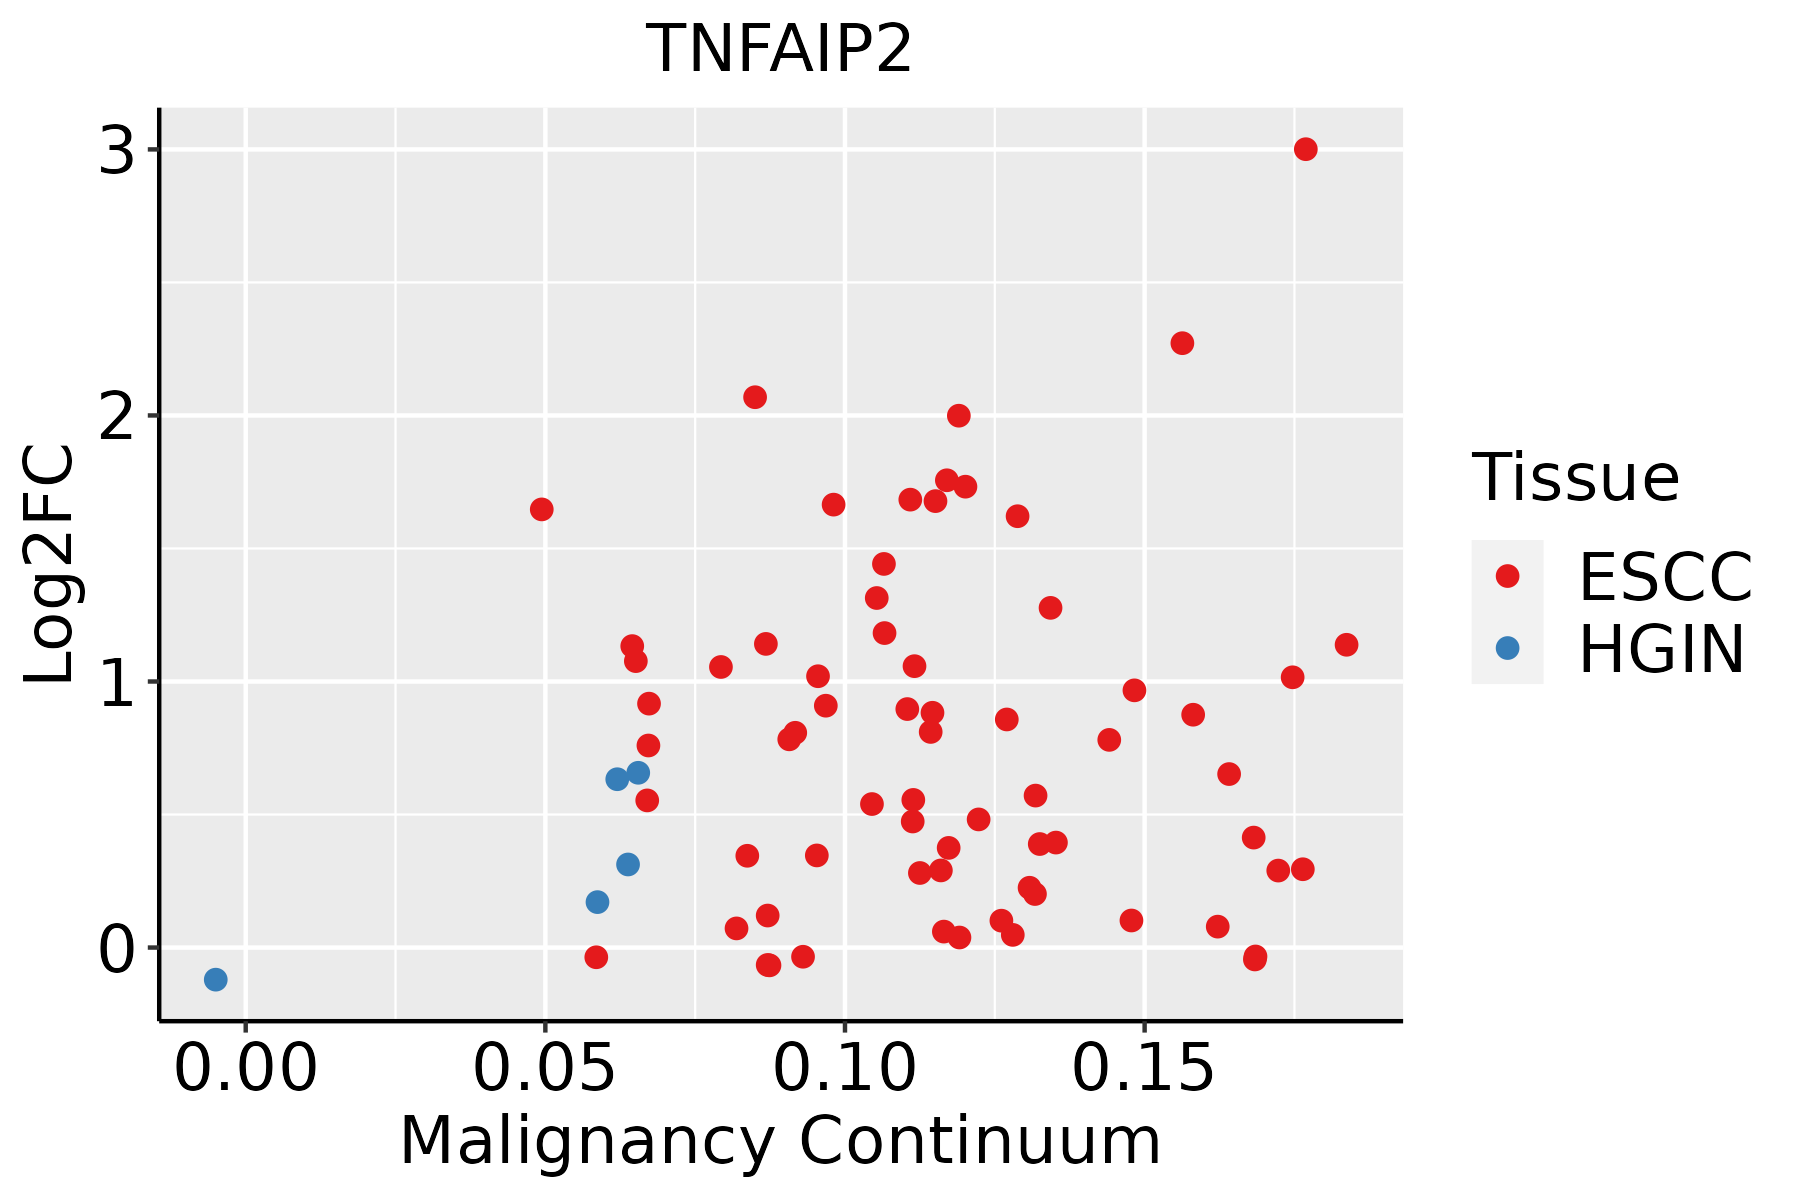 | ESCC: Esophageal squamous cell carcinoma |
| HGIN: High-grade intraepithelial neoplasias | ||
| LGIN: Low-grade intraepithelial neoplasias | ||
| Liver | 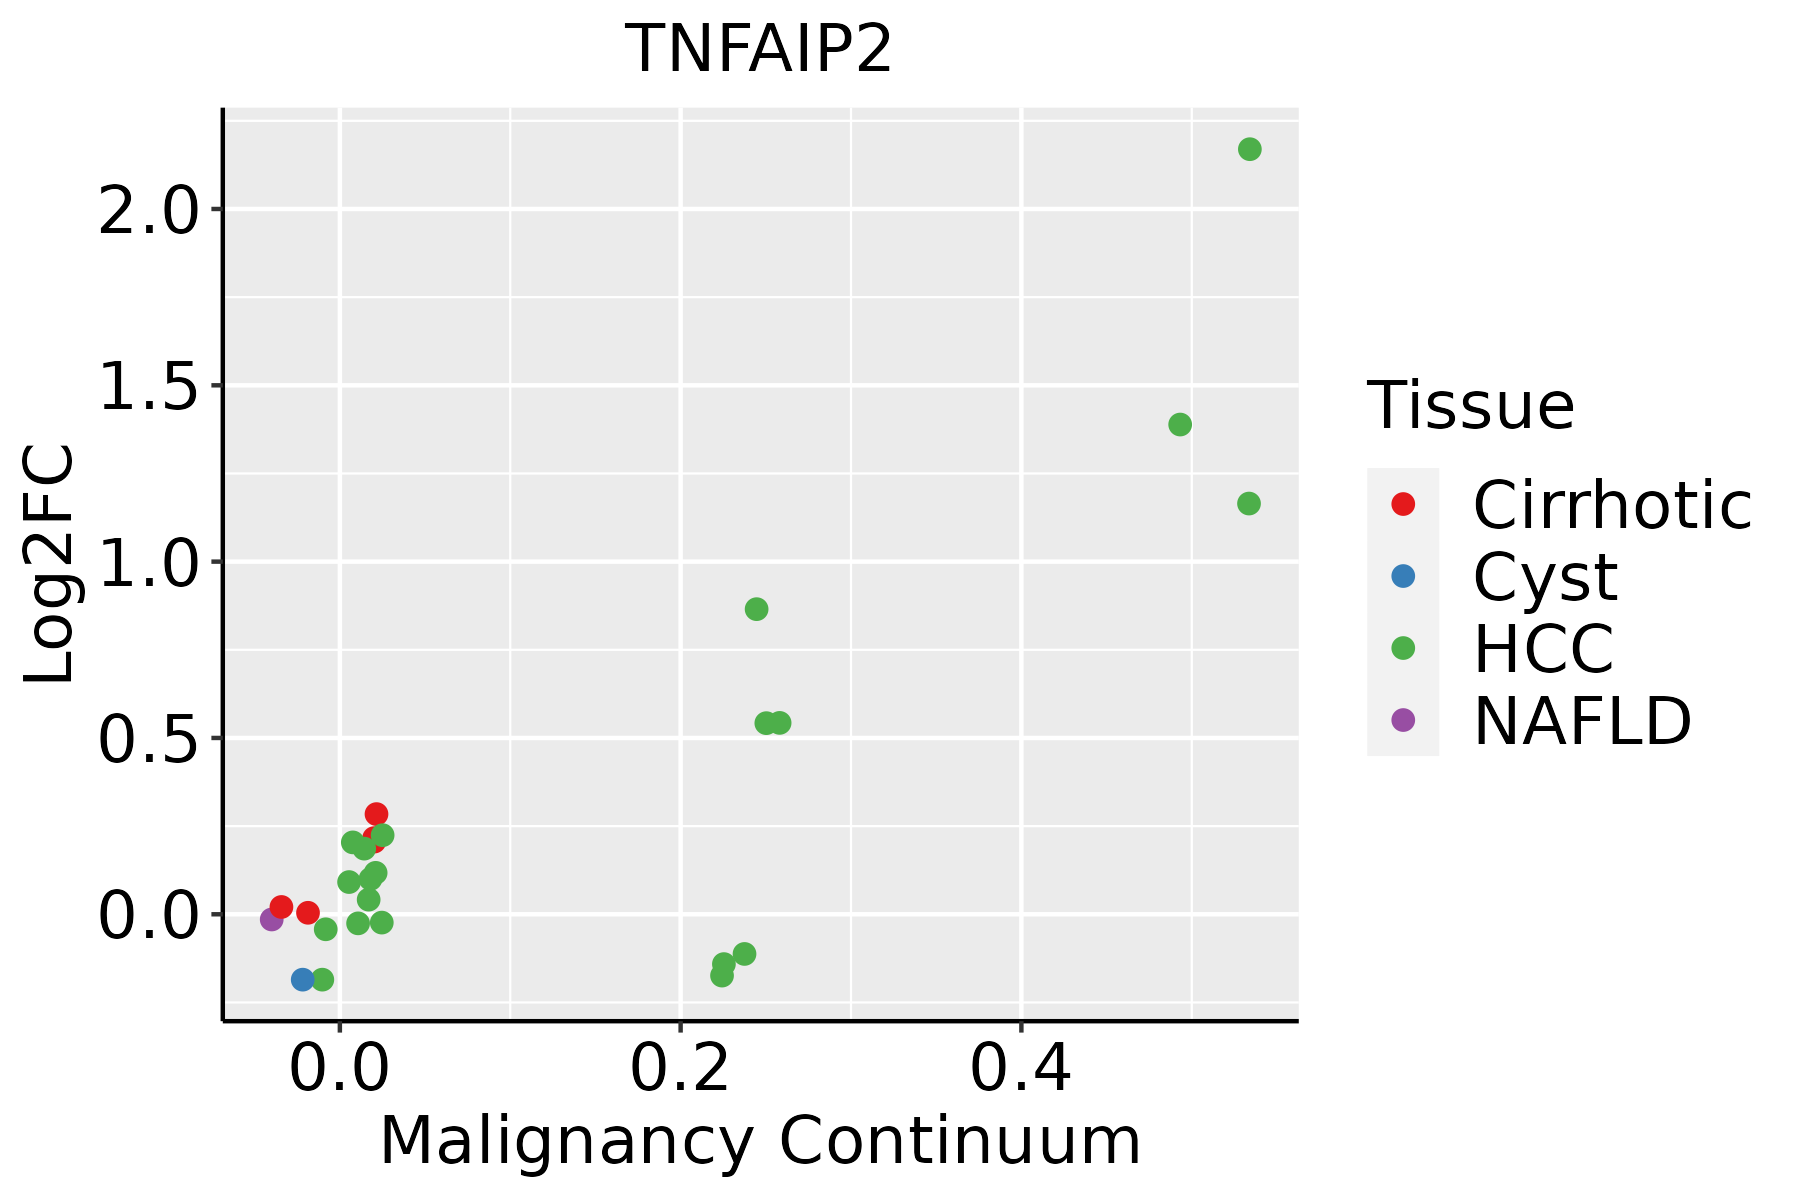 | HCC: Hepatocellular carcinoma |
| NAFLD: Non-alcoholic fatty liver disease | ||
| Oral Cavity | 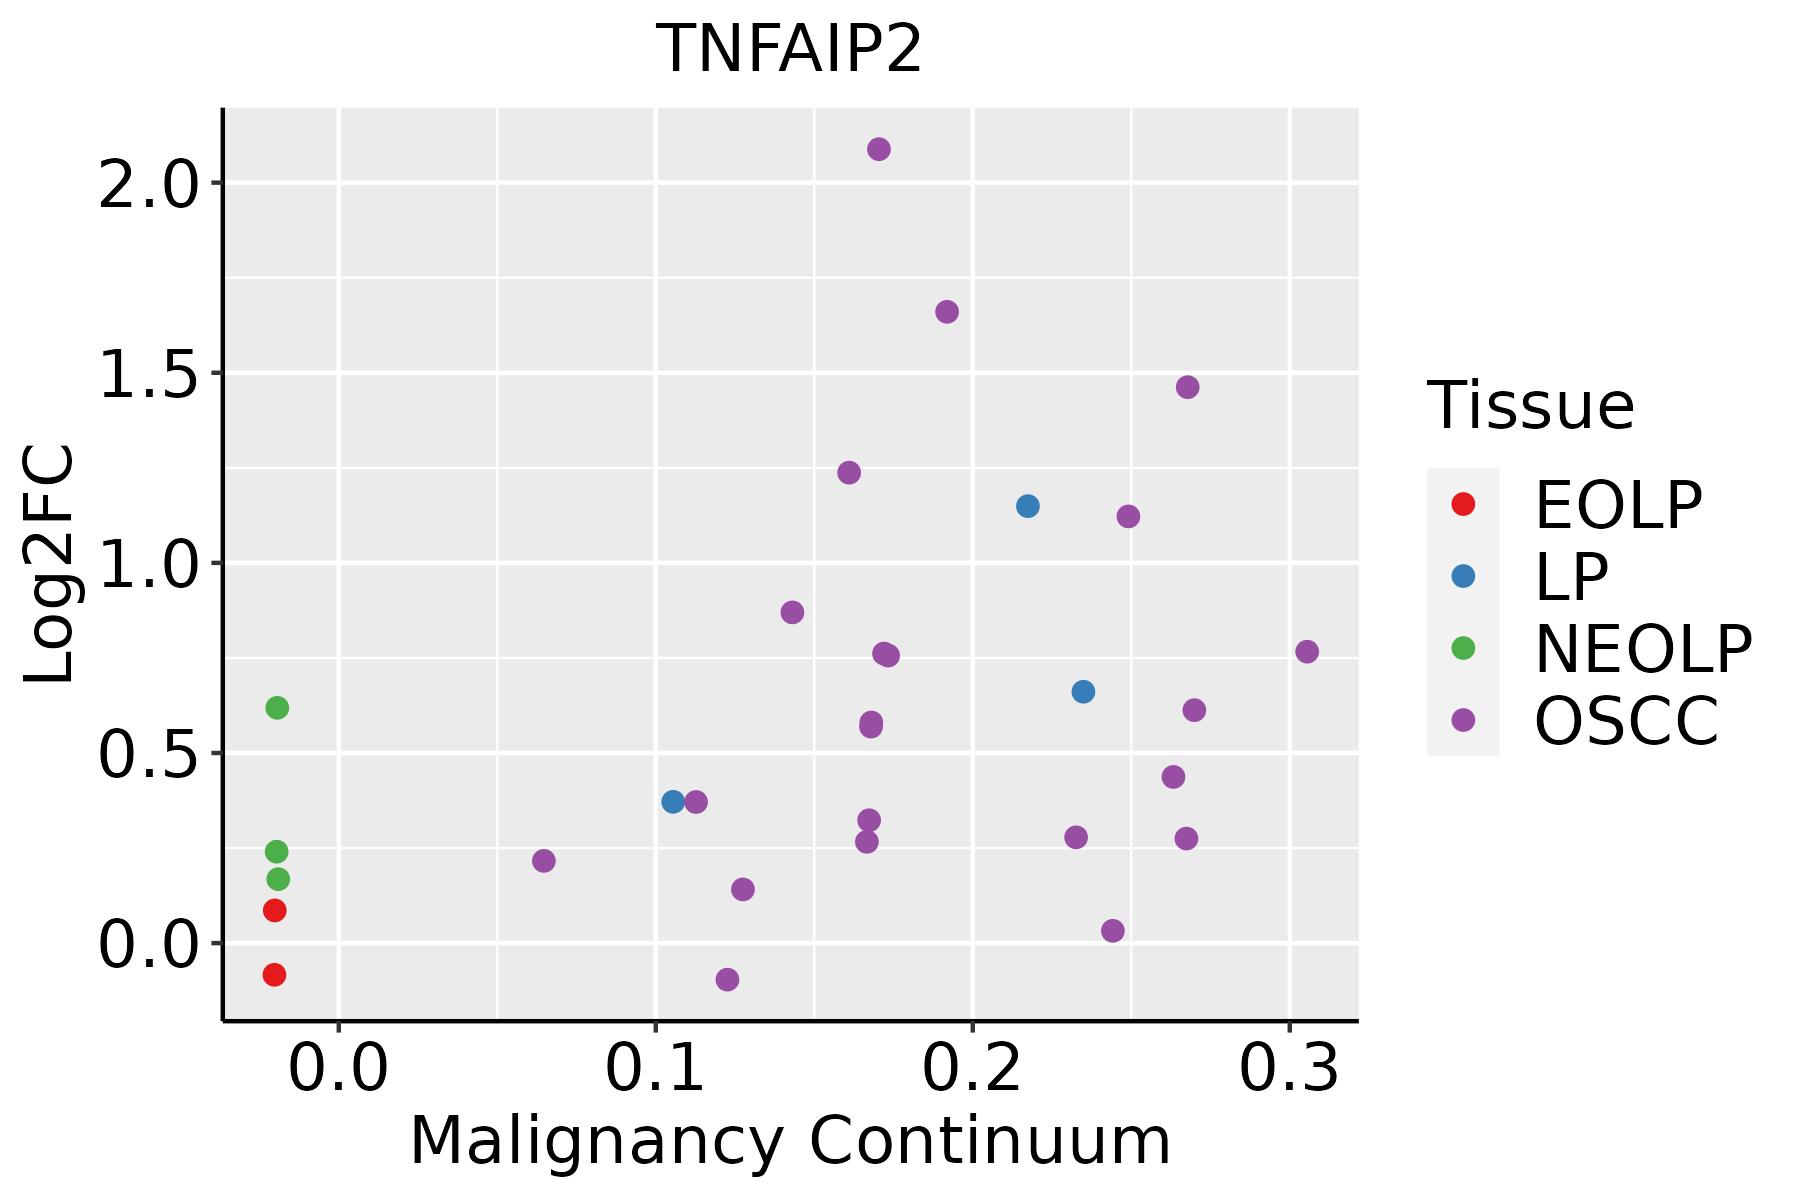 | EOLP: Erosive Oral lichen planus |
| LP: leukoplakia | ||
| NEOLP: Non-erosive oral lichen planus | ||
| OSCC: Oral squamous cell carcinoma | ||
| Prostate | 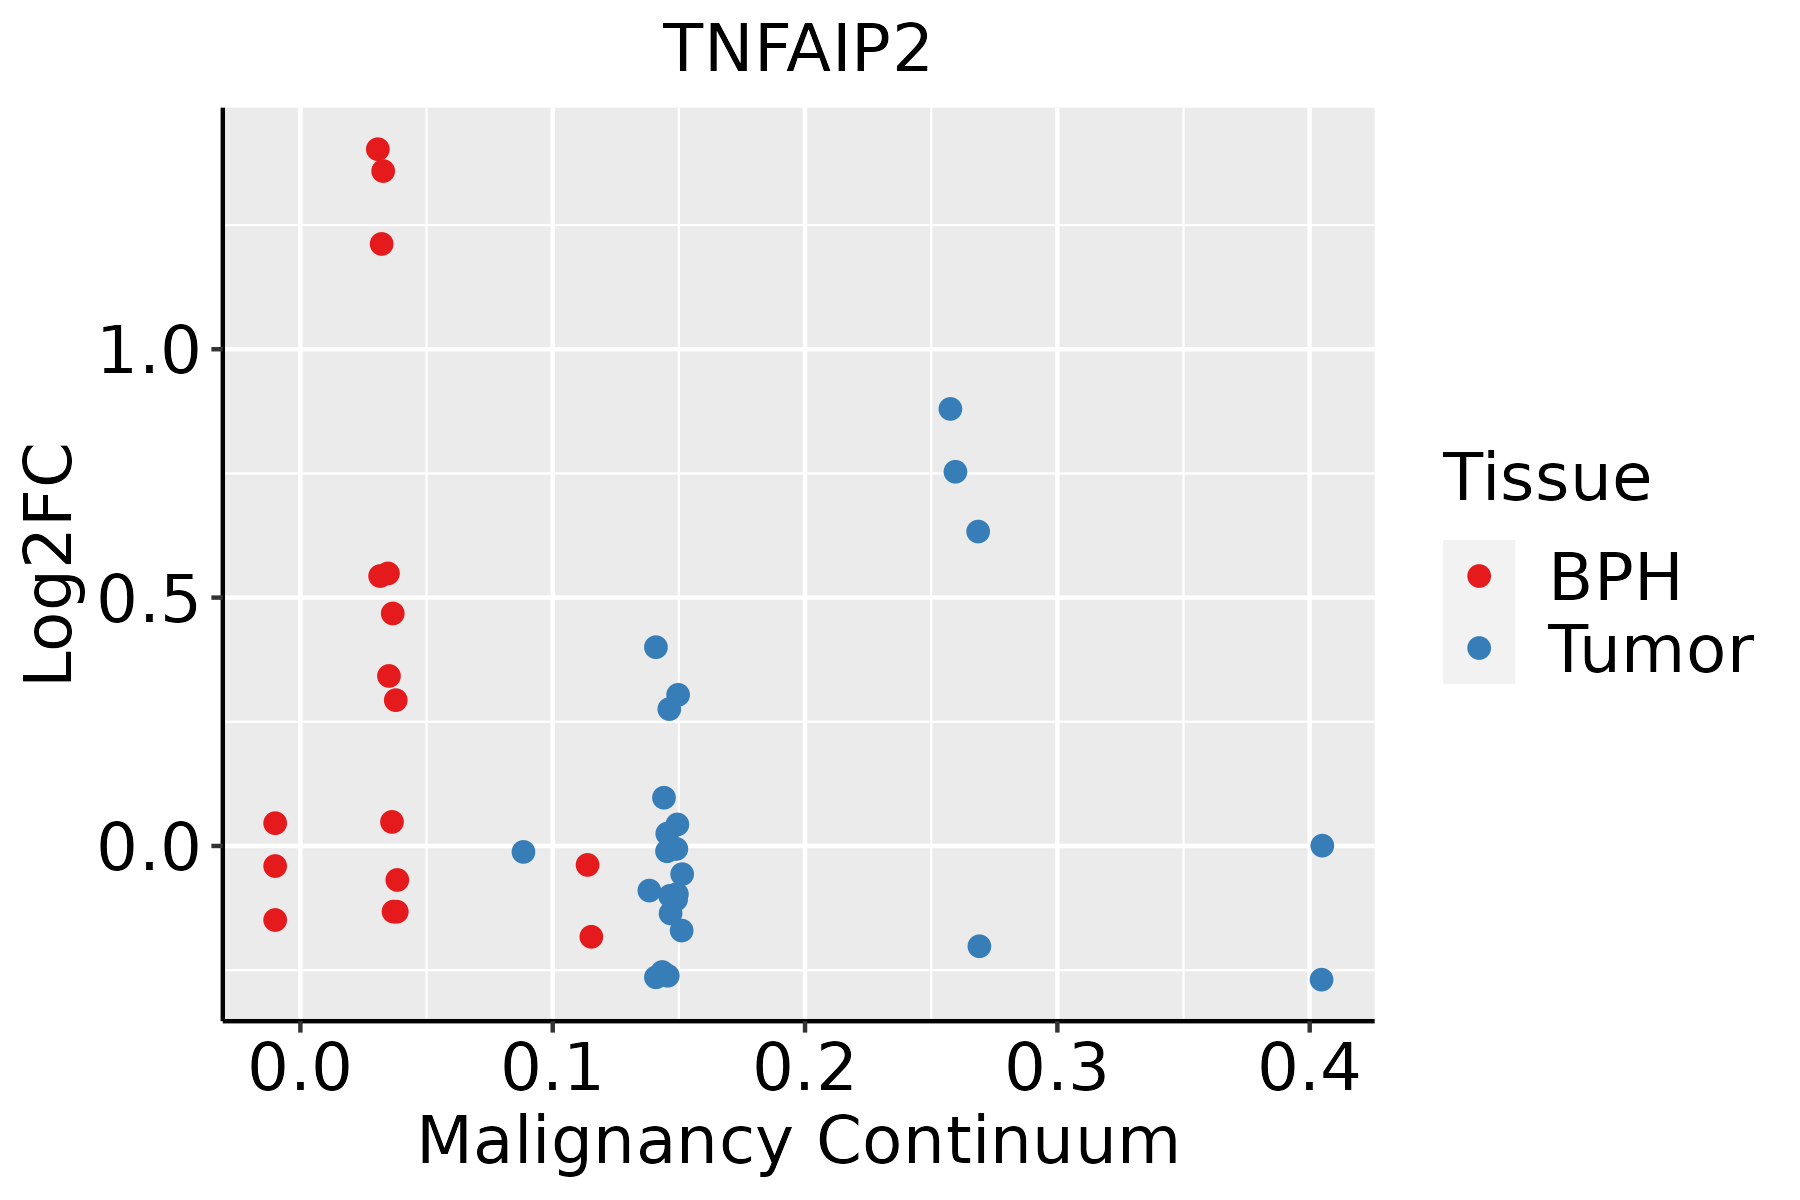 | BPH: Benign Prostatic Hyperplasia |
| Thyroid | 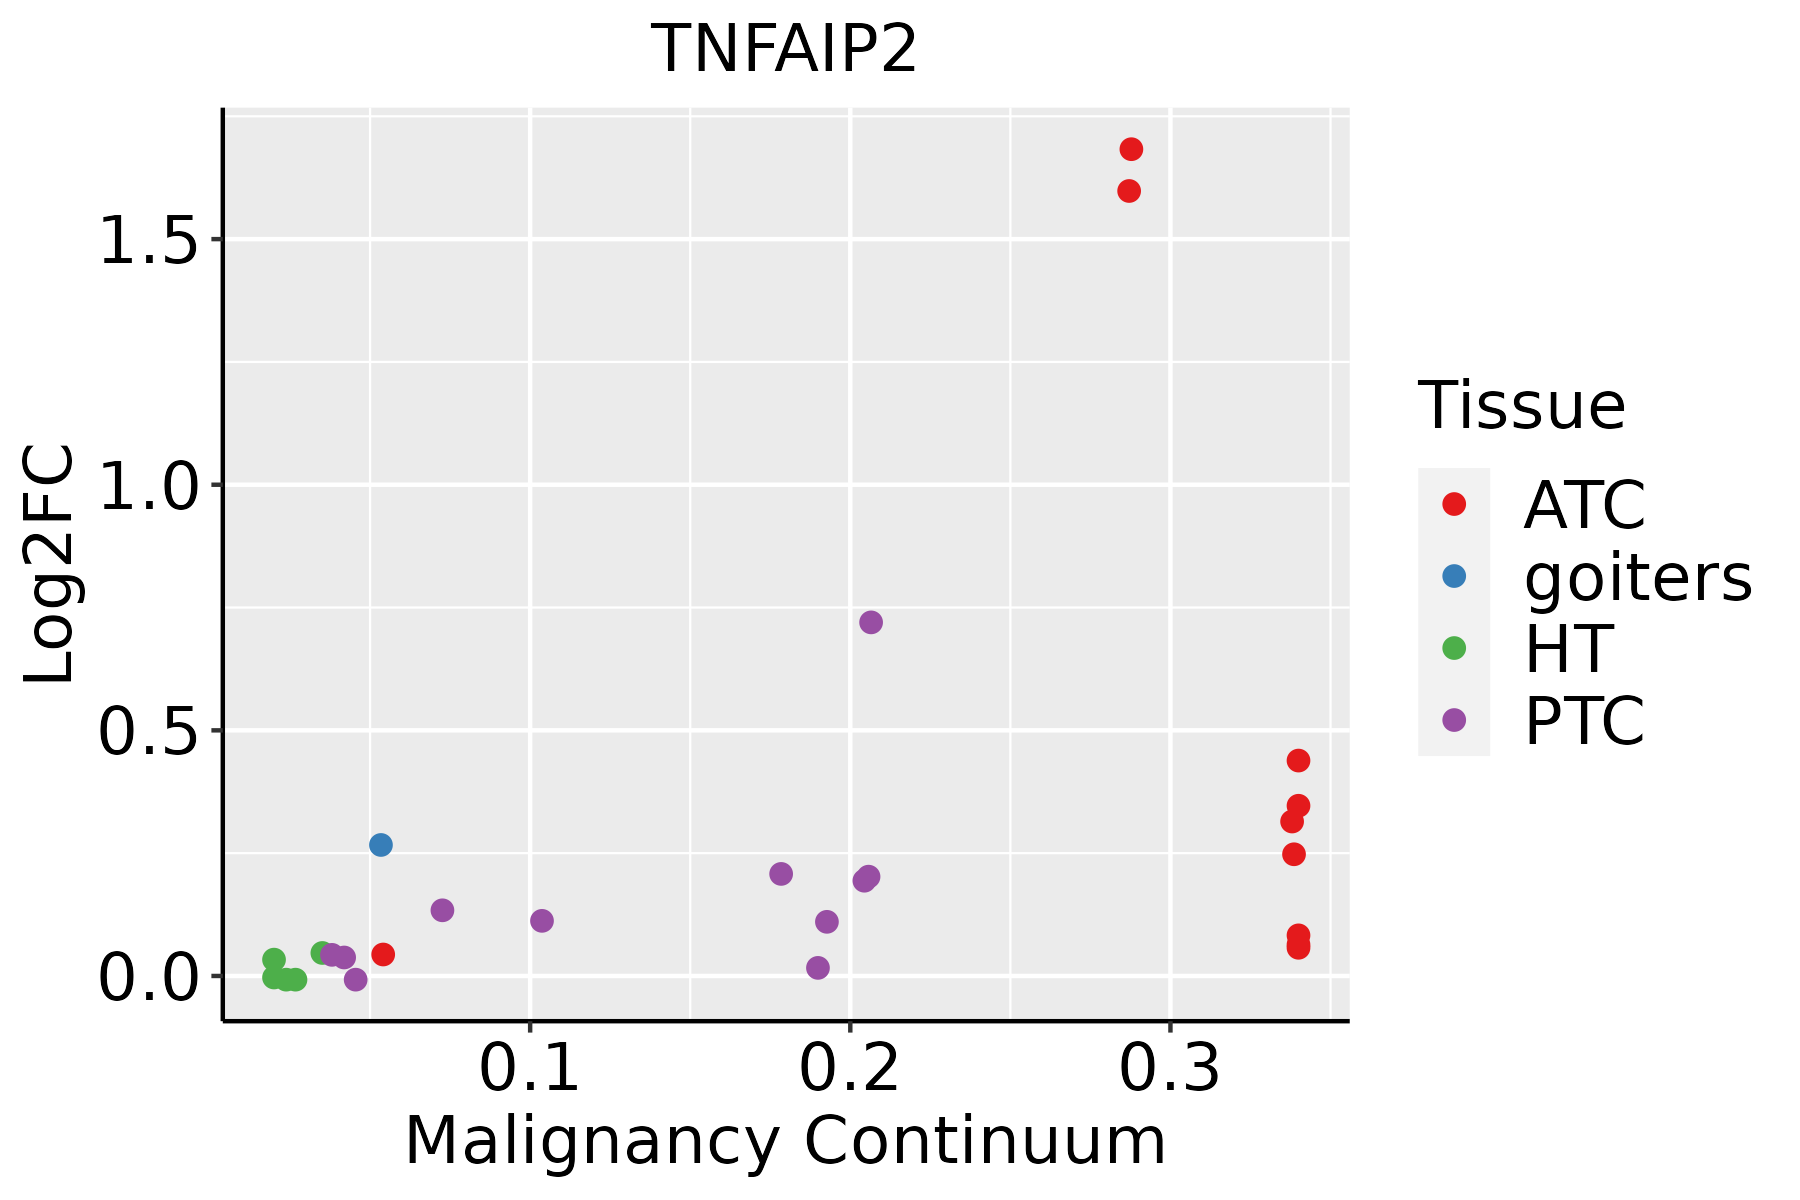 | ATC: Anaplastic thyroid cancer |
| HT: Hashimoto's thyroiditis | ||
| PTC: Papillary thyroid cancer |
| ∗log2FC in expression of this searched gene in stem-like cells from each diseased tissue sample relative to stem-like cells in normal samples in each tissue plotted against the malignancy continuum. Samples are colored based on if they are from different disease stage. |
Top |
Malignant transformation related pathway analysis |
| Find out the enriched GO biological processes and KEGG pathways involved in transition from healthy to precancer to cancer |
| Tissue | Disease Stage | Enriched GO biological Processes |
| Colorectum | AD |  |
| Colorectum | SER |  |
| Colorectum | MSS |  |
| Colorectum | MSI-H |  |
| Colorectum | FAP |  |
| ∗Top 15 enriched GO BP terms are showed in the bar plot of each disease state in each tissue. Each row represents a significant GO biological process which is colored according to the -log10(p.adjust). |
| Page: 1 2 3 4 5 6 7 8 9 |
| GO ID | Tissue | Disease Stage | Description | Gene Ratio | Bg Ratio | pvalue | p.adjust | Count |
| GO:00315035 | Esophagus | HGIN | protein-containing complex localization | 50/2587 | 220/18723 | 2.18e-04 | 3.98e-03 | 50 |
| GO:003150314 | Esophagus | ESCC | protein-containing complex localization | 139/8552 | 220/18723 | 1.14e-07 | 1.85e-06 | 139 |
| GO:0031503 | Liver | Cirrhotic | protein-containing complex localization | 75/4634 | 220/18723 | 1.13e-03 | 7.73e-03 | 75 |
| GO:00315031 | Liver | HCC | protein-containing complex localization | 129/7958 | 220/18723 | 9.38e-07 | 1.42e-05 | 129 |
| GO:0034629 | Liver | HCC | cellular protein-containing complex localization | 17/7958 | 22/18723 | 9.84e-04 | 5.70e-03 | 17 |
| GO:00315034 | Oral cavity | OSCC | protein-containing complex localization | 123/7305 | 220/18723 | 2.54e-07 | 4.00e-06 | 123 |
| GO:003150313 | Oral cavity | LP | protein-containing complex localization | 82/4623 | 220/18723 | 2.08e-05 | 3.44e-04 | 82 |
| GO:003150331 | Oral cavity | NEOLP | protein-containing complex localization | 37/2005 | 220/18723 | 3.69e-03 | 2.15e-02 | 37 |
| GO:00315033 | Prostate | BPH | protein-containing complex localization | 59/3107 | 220/18723 | 8.01e-05 | 7.66e-04 | 59 |
| GO:003150312 | Prostate | Tumor | protein-containing complex localization | 59/3246 | 220/18723 | 2.71e-04 | 2.24e-03 | 59 |
| GO:00315037 | Thyroid | PTC | protein-containing complex localization | 107/5968 | 220/18723 | 1.47e-07 | 2.82e-06 | 107 |
| GO:003150316 | Thyroid | ATC | protein-containing complex localization | 108/6293 | 220/18723 | 1.33e-06 | 1.69e-05 | 108 |
| Page: 1 |
| Pathway ID | Tissue | Disease Stage | Description | Gene Ratio | Bg Ratio | pvalue | p.adjust | qvalue | Count |
| Page: 1 |
Top |
Cell-cell communication analysis |
| Identification of potential cell-cell interactions between two cell types and their ligand-receptor pairs for different disease states |
| Ligand | Receptor | LRpair | Pathway | Tissue | Disease Stage |
| Page: 1 |
Top |
Single-cell gene regulatory network inference analysis |
| Find out the significant the regulons (TFs) and the target genes of each regulon across cell types for different disease states |
| TF | Cell Type | Tissue | Disease Stage | Target Gene | RSS | Regulon Activity |
| ∗The dot plots of a searched regulon are shown for all cell subpopulations in each disease state of each tissue based on the regulon specific score inferred using pySCENIC and by calculating the average expression. |
| Page: 1 |
Top |
Somatic mutation of malignant transformation related genes |
| Annotation of somatic variants for genes involved in malignant transformation |
| Hugo Symbol | Variant Class | Variant Classification | dbSNP RS | HGVSc | HGVSp | HGVSp Short | SWISSPROT | BIOTYPE | SIFT | PolyPhen | Tumor Sample Barcode | Tissue | Histology | Sex | Age | Stage | Therapy Types | Drugs | Outcome |
| TNFAIP2 | SNV | Missense_Mutation | c.1885C>T | p.Arg629Cys | p.R629C | Q03169 | protein_coding | deleterious(0) | benign(0.027) | TCGA-A1-A0SO-01 | Breast | breast invasive carcinoma | Female | >=65 | I/II | Chemotherapy | SD | ||
| TNFAIP2 | SNV | Missense_Mutation | c.1247N>A | p.Thr416Lys | p.T416K | Q03169 | protein_coding | tolerated(0.52) | benign(0) | TCGA-D8-A1XK-01 | Breast | breast invasive carcinoma | Female | <65 | I/II | Chemotherapy | doxorubicine+cyclophosphamide | SD | |
| TNFAIP2 | SNV | Missense_Mutation | rs745552776 | c.1699N>T | p.His567Tyr | p.H567Y | Q03169 | protein_coding | tolerated(0.1) | benign(0.15) | TCGA-AD-6964-01 | Colorectum | colon adenocarcinoma | Male | <65 | III/IV | Chemotherapy | folfox | PD |
| TNFAIP2 | SNV | Missense_Mutation | novel | c.1915G>A | p.Gly639Arg | p.G639R | Q03169 | protein_coding | tolerated(0.15) | possibly_damaging(0.806) | TCGA-AY-4070-01 | Colorectum | colon adenocarcinoma | Female | <65 | III/IV | Chemotherapy | 5-fu | PD |
| TNFAIP2 | SNV | Missense_Mutation | rs533232691 | c.1457C>T | p.Ala486Val | p.A486V | Q03169 | protein_coding | tolerated(0.2) | benign(0.027) | TCGA-AZ-6601-01 | Colorectum | colon adenocarcinoma | Male | >=65 | I/II | Unknown | Unknown | PD |
| TNFAIP2 | SNV | Missense_Mutation | c.1003N>T | p.Ala335Ser | p.A335S | Q03169 | protein_coding | tolerated(0.2) | benign(0.401) | TCGA-CK-4951-01 | Colorectum | colon adenocarcinoma | Female | >=65 | I/II | Unknown | Unknown | PD | |
| TNFAIP2 | SNV | Missense_Mutation | c.136G>A | p.Val46Ile | p.V46I | Q03169 | protein_coding | tolerated(0.2) | benign(0.007) | TCGA-CM-6171-01 | Colorectum | colon adenocarcinoma | Female | >=65 | I/II | Unknown | Unknown | SD | |
| TNFAIP2 | SNV | Missense_Mutation | c.97N>G | p.Lys33Glu | p.K33E | Q03169 | protein_coding | tolerated(0.5) | benign(0.292) | TCGA-D5-6930-01 | Colorectum | colon adenocarcinoma | Male | >=65 | I/II | Unknown | Unknown | SD | |
| TNFAIP2 | SNV | Missense_Mutation | c.218A>T | p.Asp73Val | p.D73V | Q03169 | protein_coding | tolerated(0.06) | benign(0.082) | TCGA-G4-6309-01 | Colorectum | colon adenocarcinoma | Female | <65 | III/IV | Chemotherapy | xeloda | PD | |
| TNFAIP2 | SNV | Missense_Mutation | c.119N>C | p.Leu40Pro | p.L40P | Q03169 | protein_coding | deleterious(0) | probably_damaging(0.916) | TCGA-G4-6586-01 | Colorectum | colon adenocarcinoma | Female | >=65 | I/II | Unknown | Unknown | SD |
| Page: 1 2 3 4 5 |
Top |
Related drugs of malignant transformation related genes |
| Identification of chemicals and drugs interact with genes involved in malignant transfromation |
| (DGIdb 4.0) |
| Entrez ID | Symbol | Category | Interaction Types | Drug Claim Name | Drug Name | PMIDs |
| Page: 1 |

Copyright 2023-Present -The University of Texas Health Science Center at Houston |