
|
|||||
|
 | |
| |
| |
| |
| |
| |
|
Gene: TNFAIP1 |
Gene summary for TNFAIP1 |
| Gene information | Species | Human | Gene symbol | TNFAIP1 | Gene ID | 7126 |
| Gene name | TNF alpha induced protein 1 | |
| Gene Alias | B12 | |
| Cytomap | 17q11.2 | |
| Gene Type | protein-coding | GO ID | GO:0002376 | UniProtAcc | Q13829 |
Top |
Malignant transformation analysis |
| Identification of the aberrant gene expression in precancerous and cancerous lesions by comparing the gene expression of stem-like cells in diseased tissues with normal stem cells |
| Entrez ID | Symbol | Replicates | Species | Organ | Tissue | Adj P-value | Log2FC | Malignancy |
| 7126 | TNFAIP1 | LZE4T | Human | Esophagus | ESCC | 5.55e-08 | 2.76e-01 | 0.0811 |
| 7126 | TNFAIP1 | LZE5T | Human | Esophagus | ESCC | 1.90e-04 | 1.24e-01 | 0.0514 |
| 7126 | TNFAIP1 | LZE7T | Human | Esophagus | ESCC | 5.87e-04 | 1.10e-01 | 0.0667 |
| 7126 | TNFAIP1 | LZE8T | Human | Esophagus | ESCC | 1.36e-06 | 2.18e-02 | 0.067 |
| 7126 | TNFAIP1 | LZE24T | Human | Esophagus | ESCC | 3.72e-18 | 7.50e-01 | 0.0596 |
| 7126 | TNFAIP1 | LZE21T | Human | Esophagus | ESCC | 2.24e-02 | 3.13e-01 | 0.0655 |
| 7126 | TNFAIP1 | LZE6T | Human | Esophagus | ESCC | 5.57e-03 | 1.98e-01 | 0.0845 |
| 7126 | TNFAIP1 | P1T-E | Human | Esophagus | ESCC | 5.43e-04 | 5.00e-01 | 0.0875 |
| 7126 | TNFAIP1 | P2T-E | Human | Esophagus | ESCC | 6.05e-17 | 2.68e-01 | 0.1177 |
| 7126 | TNFAIP1 | P4T-E | Human | Esophagus | ESCC | 2.97e-20 | 4.58e-01 | 0.1323 |
| 7126 | TNFAIP1 | P5T-E | Human | Esophagus | ESCC | 5.94e-22 | 4.86e-01 | 0.1327 |
| 7126 | TNFAIP1 | P8T-E | Human | Esophagus | ESCC | 3.44e-15 | 1.13e-01 | 0.0889 |
| 7126 | TNFAIP1 | P9T-E | Human | Esophagus | ESCC | 2.27e-07 | 3.28e-01 | 0.1131 |
| 7126 | TNFAIP1 | P10T-E | Human | Esophagus | ESCC | 3.17e-22 | 3.39e-01 | 0.116 |
| 7126 | TNFAIP1 | P11T-E | Human | Esophagus | ESCC | 2.40e-21 | 6.70e-01 | 0.1426 |
| 7126 | TNFAIP1 | P12T-E | Human | Esophagus | ESCC | 3.43e-11 | 2.36e-01 | 0.1122 |
| 7126 | TNFAIP1 | P15T-E | Human | Esophagus | ESCC | 2.99e-14 | 4.00e-01 | 0.1149 |
| 7126 | TNFAIP1 | P16T-E | Human | Esophagus | ESCC | 7.12e-16 | 1.19e-01 | 0.1153 |
| 7126 | TNFAIP1 | P17T-E | Human | Esophagus | ESCC | 2.55e-13 | 6.46e-01 | 0.1278 |
| 7126 | TNFAIP1 | P19T-E | Human | Esophagus | ESCC | 2.31e-04 | 1.06e+00 | 0.1662 |
| Page: 1 2 3 4 5 |
| Tissue | Expression Dynamics | Abbreviation |
| Esophagus | 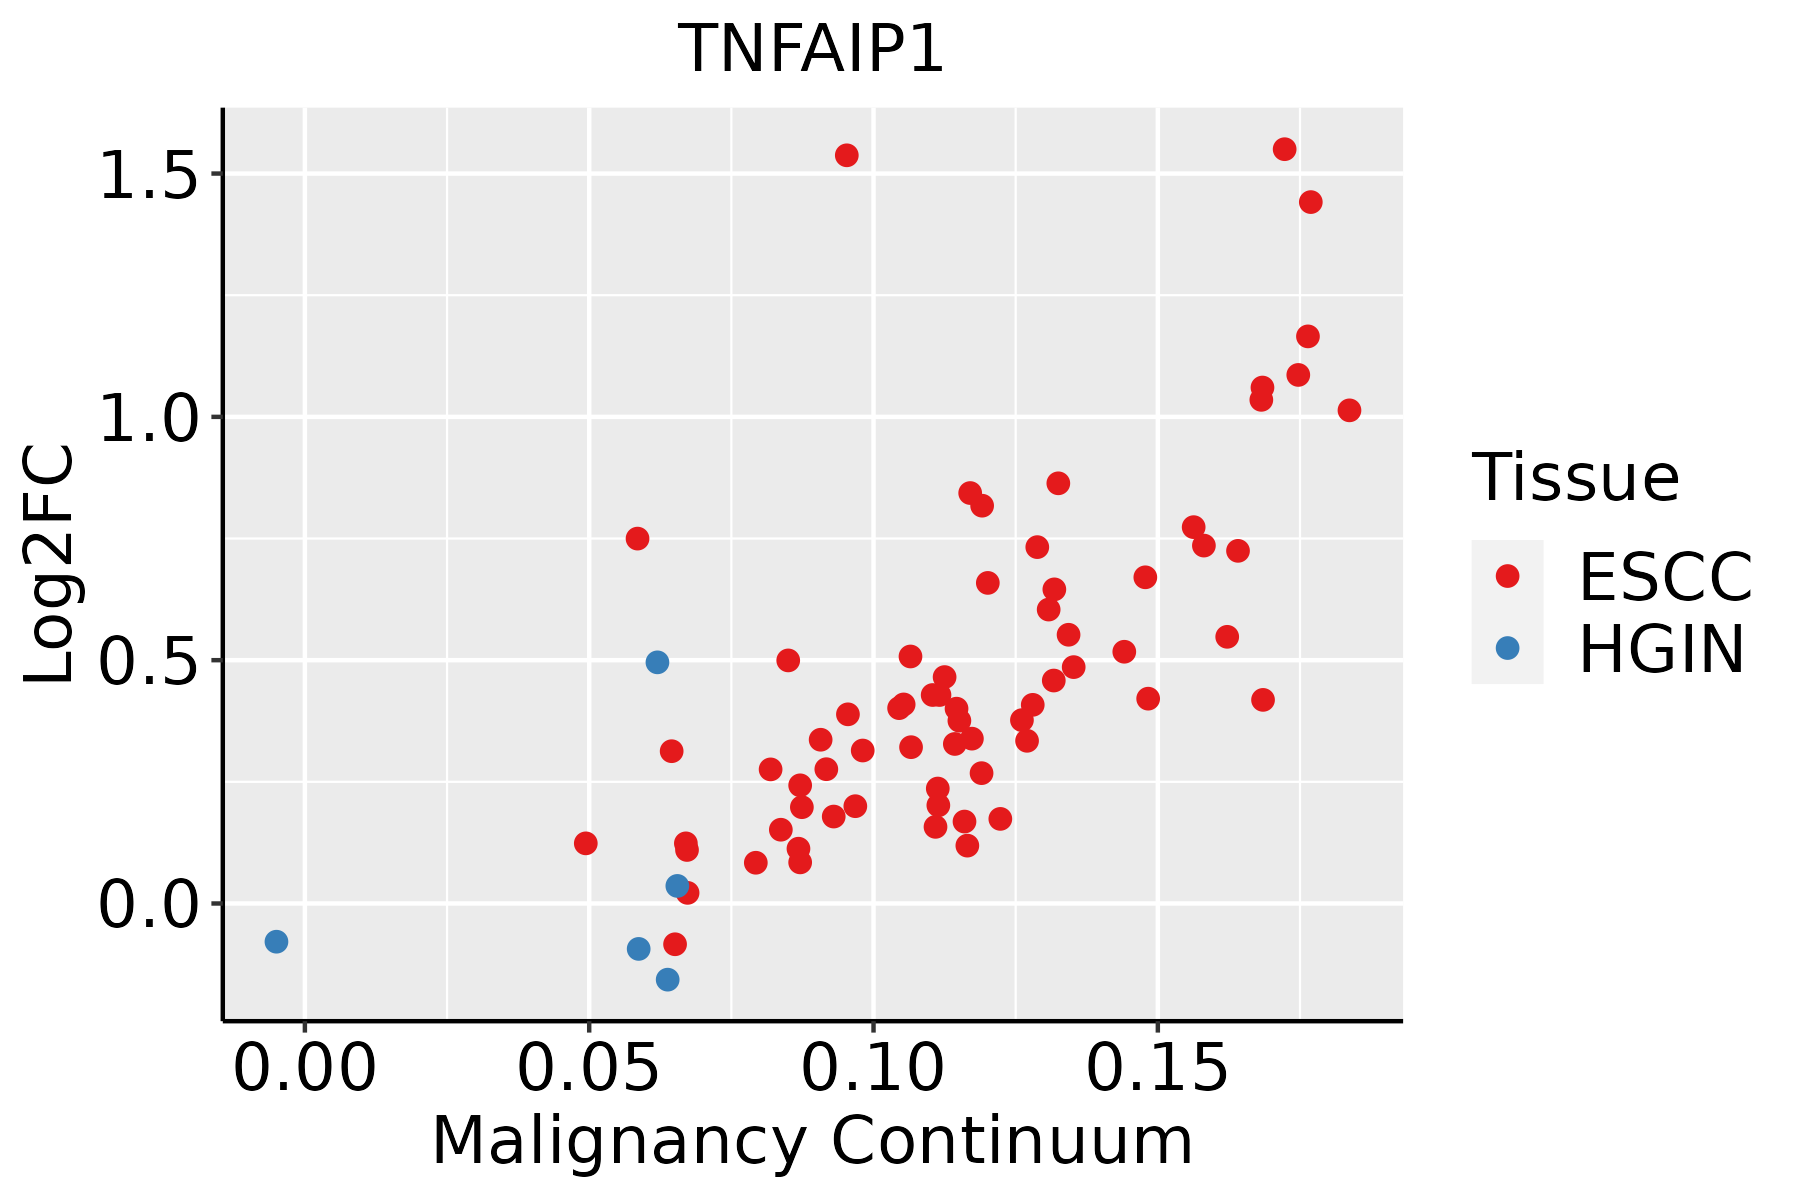 | ESCC: Esophageal squamous cell carcinoma |
| HGIN: High-grade intraepithelial neoplasias | ||
| LGIN: Low-grade intraepithelial neoplasias | ||
| Liver |  | HCC: Hepatocellular carcinoma |
| NAFLD: Non-alcoholic fatty liver disease | ||
| Oral Cavity | 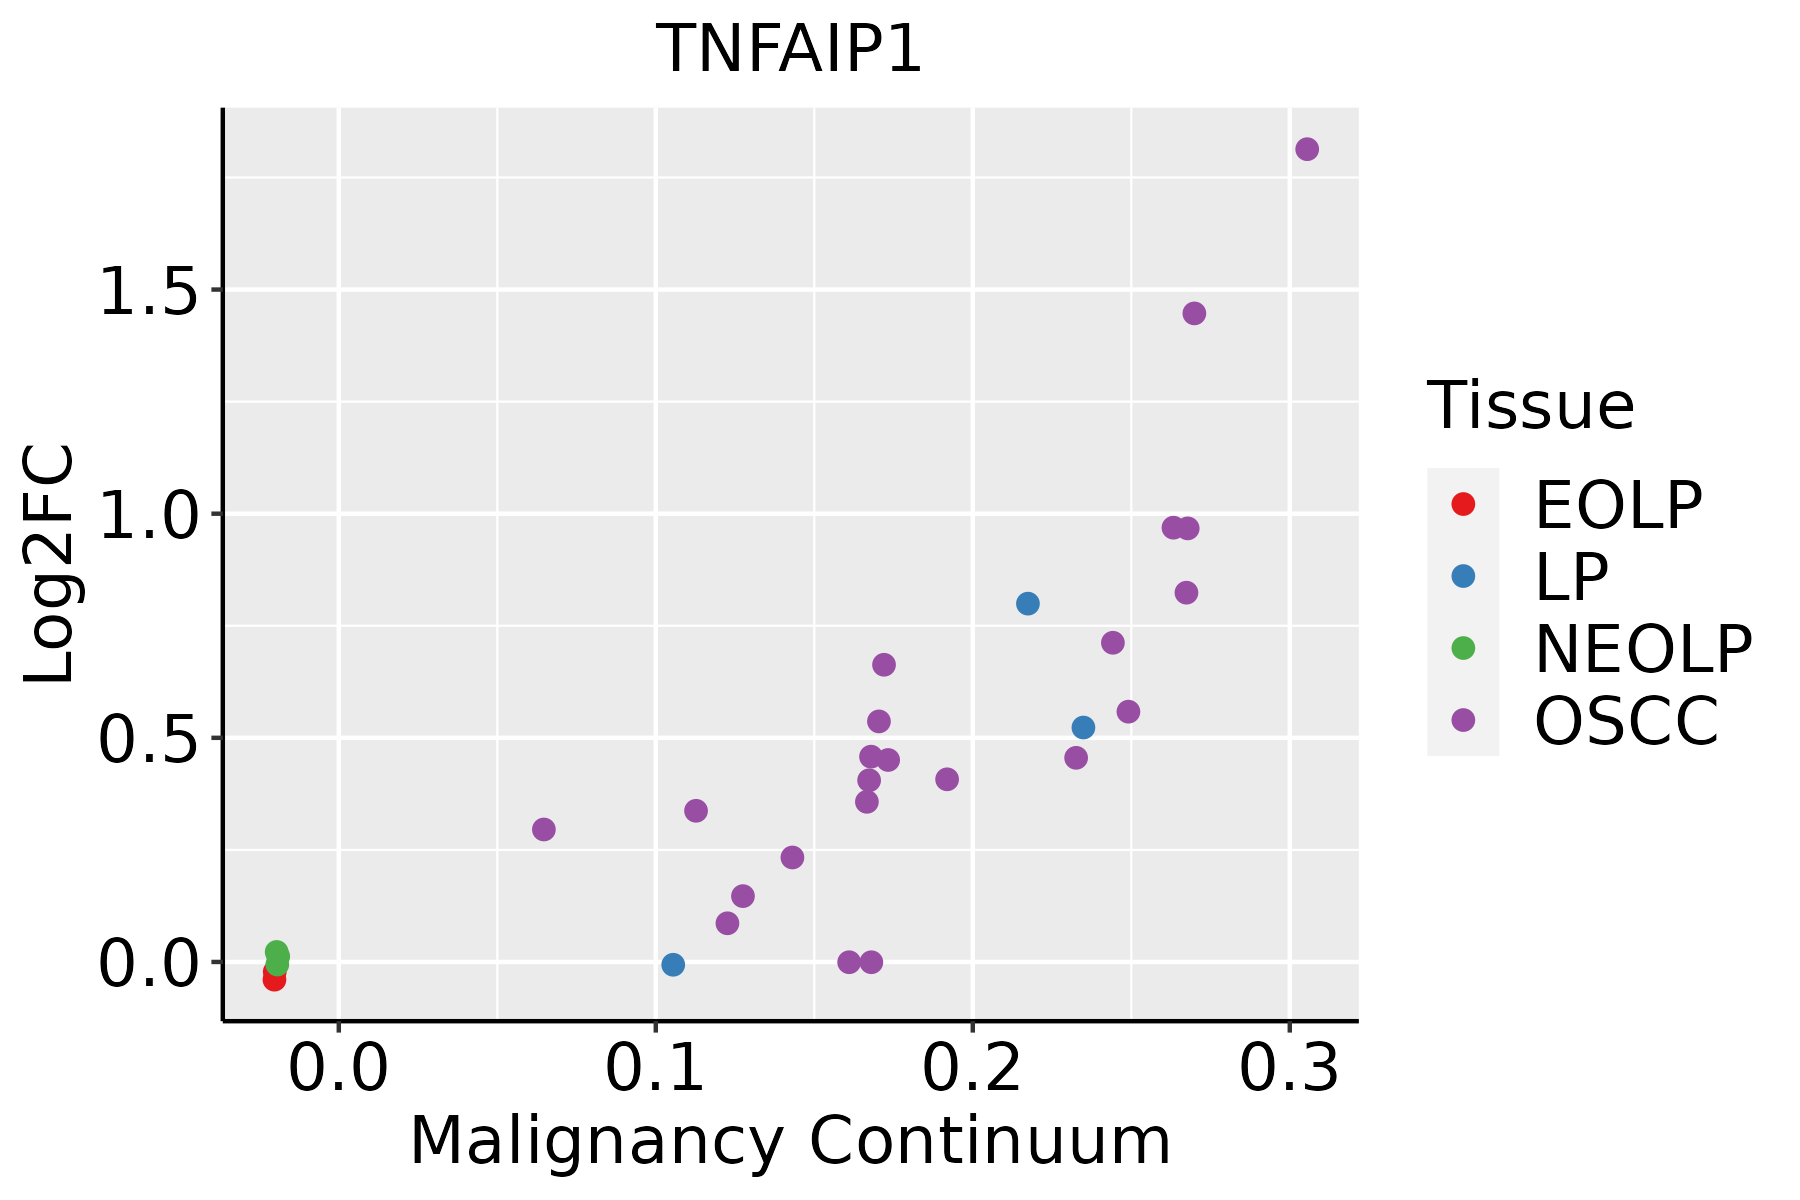 | EOLP: Erosive Oral lichen planus |
| LP: leukoplakia | ||
| NEOLP: Non-erosive oral lichen planus | ||
| OSCC: Oral squamous cell carcinoma | ||
| Skin |  | AK: Actinic keratosis |
| cSCC: Cutaneous squamous cell carcinoma | ||
| SCCIS:squamous cell carcinoma in situ |
| ∗log2FC in expression of this searched gene in stem-like cells from each diseased tissue sample relative to stem-like cells in normal samples in each tissue plotted against the malignancy continuum. Samples are colored based on if they are from different disease stage. |
Top |
Malignant transformation related pathway analysis |
| Find out the enriched GO biological processes and KEGG pathways involved in transition from healthy to precancer to cancer |
| Tissue | Disease Stage | Enriched GO biological Processes |
| Colorectum | AD |  |
| Colorectum | SER |  |
| Colorectum | MSS |  |
| Colorectum | MSI-H |  |
| Colorectum | FAP |  |
| ∗Top 15 enriched GO BP terms are showed in the bar plot of each disease state in each tissue. Each row represents a significant GO biological process which is colored according to the -log10(p.adjust). |
| Page: 1 2 3 4 5 6 7 8 9 |
| GO ID | Tissue | Disease Stage | Description | Gene Ratio | Bg Ratio | pvalue | p.adjust | Count |
| GO:0010498111 | Esophagus | ESCC | proteasomal protein catabolic process | 369/8552 | 490/18723 | 1.13e-41 | 1.80e-38 | 369 |
| GO:0043161111 | Esophagus | ESCC | proteasome-mediated ubiquitin-dependent protein catabolic process | 312/8552 | 412/18723 | 3.53e-36 | 4.48e-33 | 312 |
| GO:00062604 | Esophagus | ESCC | DNA replication | 181/8552 | 260/18723 | 3.55e-15 | 2.05e-13 | 181 |
| GO:000701527 | Esophagus | ESCC | actin filament organization | 259/8552 | 442/18723 | 2.37e-08 | 4.50e-07 | 259 |
| GO:000726510 | Esophagus | ESCC | Ras protein signal transduction | 201/8552 | 337/18723 | 1.44e-07 | 2.30e-06 | 201 |
| GO:00062754 | Esophagus | ESCC | regulation of DNA replication | 73/8552 | 107/18723 | 1.97e-06 | 2.28e-05 | 73 |
| GO:005101727 | Esophagus | ESCC | actin filament bundle assembly | 100/8552 | 157/18723 | 3.87e-06 | 4.17e-05 | 100 |
| GO:006157227 | Esophagus | ESCC | actin filament bundle organization | 101/8552 | 161/18723 | 9.22e-06 | 8.82e-05 | 101 |
| GO:003003820 | Esophagus | ESCC | contractile actin filament bundle assembly | 67/8552 | 106/18723 | 2.03e-04 | 1.28e-03 | 67 |
| GO:004314920 | Esophagus | ESCC | stress fiber assembly | 67/8552 | 106/18723 | 2.03e-04 | 1.28e-03 | 67 |
| GO:000726610 | Esophagus | ESCC | Rho protein signal transduction | 81/8552 | 137/18723 | 1.03e-03 | 5.20e-03 | 81 |
| GO:00465789 | Esophagus | ESCC | regulation of Ras protein signal transduction | 106/8552 | 189/18723 | 2.49e-03 | 1.08e-02 | 106 |
| GO:00512592 | Esophagus | ESCC | protein complex oligomerization | 130/8552 | 238/18723 | 3.29e-03 | 1.36e-02 | 130 |
| GO:003103219 | Esophagus | ESCC | actomyosin structure organization | 108/8552 | 196/18723 | 4.86e-03 | 1.88e-02 | 108 |
| GO:00457406 | Esophagus | ESCC | positive regulation of DNA replication | 26/8552 | 40/18723 | 1.08e-02 | 3.66e-02 | 26 |
| GO:005105610 | Esophagus | ESCC | regulation of small GTPase mediated signal transduction | 157/8552 | 302/18723 | 1.55e-02 | 4.98e-02 | 157 |
| GO:001049822 | Liver | HCC | proteasomal protein catabolic process | 351/7958 | 490/18723 | 6.92e-40 | 1.46e-36 | 351 |
| GO:004316122 | Liver | HCC | proteasome-mediated ubiquitin-dependent protein catabolic process | 299/7958 | 412/18723 | 7.82e-36 | 8.27e-33 | 299 |
| GO:000701522 | Liver | HCC | actin filament organization | 252/7958 | 442/18723 | 3.83e-10 | 1.25e-08 | 252 |
| GO:000726521 | Liver | HCC | Ras protein signal transduction | 187/7958 | 337/18723 | 8.89e-07 | 1.35e-05 | 187 |
| Page: 1 2 3 4 |
| Pathway ID | Tissue | Disease Stage | Description | Gene Ratio | Bg Ratio | pvalue | p.adjust | qvalue | Count |
| Page: 1 |
Top |
Cell-cell communication analysis |
| Identification of potential cell-cell interactions between two cell types and their ligand-receptor pairs for different disease states |
| Ligand | Receptor | LRpair | Pathway | Tissue | Disease Stage |
| Page: 1 |
Top |
Single-cell gene regulatory network inference analysis |
| Find out the significant the regulons (TFs) and the target genes of each regulon across cell types for different disease states |
| TF | Cell Type | Tissue | Disease Stage | Target Gene | RSS | Regulon Activity |
| ∗The dot plots of a searched regulon are shown for all cell subpopulations in each disease state of each tissue based on the regulon specific score inferred using pySCENIC and by calculating the average expression. |
| Page: 1 |
Top |
Somatic mutation of malignant transformation related genes |
| Annotation of somatic variants for genes involved in malignant transformation |
| Hugo Symbol | Variant Class | Variant Classification | dbSNP RS | HGVSc | HGVSp | HGVSp Short | SWISSPROT | BIOTYPE | SIFT | PolyPhen | Tumor Sample Barcode | Tissue | Histology | Sex | Age | Stage | Therapy Types | Drugs | Outcome |
| TNFAIP1 | SNV | Missense_Mutation | rs782171000 | c.224N>A | p.Arg75His | p.R75H | Q13829 | protein_coding | deleterious(0) | probably_damaging(0.998) | TCGA-3C-AALI-01 | Breast | breast invasive carcinoma | Female | <65 | I/II | Unspecific | Poly E | Complete Response |
| TNFAIP1 | SNV | Missense_Mutation | novel | c.734G>A | p.Arg245Gln | p.R245Q | Q13829 | protein_coding | deleterious(0) | possibly_damaging(0.889) | TCGA-AC-A2FM-01 | Breast | breast invasive carcinoma | Female | >=65 | I/II | Unknown | Unknown | PD |
| TNFAIP1 | SNV | Missense_Mutation | novel | c.13N>C | p.Thr5Pro | p.T5P | Q13829 | protein_coding | deleterious_low_confidence(0.01) | benign(0.342) | TCGA-C8-A273-01 | Breast | breast invasive carcinoma | Female | <65 | I/II | Hormone Therapy | tamoxiphen | SD |
| TNFAIP1 | SNV | Missense_Mutation | novel | c.657G>T | p.Lys219Asn | p.K219N | Q13829 | protein_coding | deleterious(0) | probably_damaging(0.986) | TCGA-C8-A274-01 | Breast | breast invasive carcinoma | Female | <65 | I/II | Hormone Therapy | tamoxiphen | SD |
| TNFAIP1 | SNV | Missense_Mutation | rs782444724 | c.587G>A | p.Arg196His | p.R196H | Q13829 | protein_coding | deleterious(0.03) | probably_damaging(0.996) | TCGA-AA-3947-01 | Colorectum | colon adenocarcinoma | Female | <65 | I/II | Unknown | Unknown | SD |
| TNFAIP1 | SNV | Missense_Mutation | novel | c.445N>T | p.Leu149Phe | p.L149F | Q13829 | protein_coding | deleterious(0.02) | probably_damaging(0.917) | TCGA-AA-A00N-01 | Colorectum | colon adenocarcinoma | Male | >=65 | I/II | Unknown | Unknown | PD |
| TNFAIP1 | SNV | Missense_Mutation | c.550G>A | p.Glu184Lys | p.E184K | Q13829 | protein_coding | deleterious(0.03) | probably_damaging(0.999) | TCGA-AA-A010-01 | Colorectum | colon adenocarcinoma | Female | <65 | I/II | Chemotherapy | folinic | CR | |
| TNFAIP1 | SNV | Missense_Mutation | rs782624780 | c.469N>A | p.Val157Met | p.V157M | Q13829 | protein_coding | deleterious(0.03) | possibly_damaging(0.868) | TCGA-AD-6888-01 | Colorectum | colon adenocarcinoma | Male | >=65 | III/IV | Unknown | Unknown | PD |
| TNFAIP1 | SNV | Missense_Mutation | rs782727172 | c.814N>T | p.Arg272Cys | p.R272C | Q13829 | protein_coding | deleterious(0.04) | possibly_damaging(0.676) | TCGA-DM-A280-01 | Colorectum | colon adenocarcinoma | Female | >=65 | I/II | Unknown | Unknown | SD |
| TNFAIP1 | SNV | Missense_Mutation | novel | c.94N>T | p.Leu32Phe | p.L32F | Q13829 | protein_coding | deleterious(0) | probably_damaging(0.997) | TCGA-A5-A0G1-01 | Endometrium | uterine corpus endometrioid carcinoma | Female | >=65 | I/II | Unknown | Unknown | SD |
| Page: 1 2 3 4 |
Top |
Related drugs of malignant transformation related genes |
| Identification of chemicals and drugs interact with genes involved in malignant transfromation |
| (DGIdb 4.0) |
| Entrez ID | Symbol | Category | Interaction Types | Drug Claim Name | Drug Name | PMIDs |
| 7126 | TNFAIP1 | NA | IL-2 | ALDESLEUKIN | 9357823 |
| Page: 1 |

Copyright 2023-Present -The University of Texas Health Science Center at Houston |