
|
|||||
|
 | |
| |
| |
| |
| |
| |
|
Gene: TMX1 |
Gene summary for TMX1 |
| Gene information | Species | Human | Gene symbol | TMX1 | Gene ID | 81542 |
| Gene name | thioredoxin related transmembrane protein 1 | |
| Gene Alias | PDIA11 | |
| Cytomap | 14q22.1 | |
| Gene Type | protein-coding | GO ID | GO:0006950 | UniProtAcc | Q9H3N1 |
Top |
Malignant transformation analysis |
| Identification of the aberrant gene expression in precancerous and cancerous lesions by comparing the gene expression of stem-like cells in diseased tissues with normal stem cells |
| Entrez ID | Symbol | Replicates | Species | Organ | Tissue | Adj P-value | Log2FC | Malignancy |
| 81542 | TMX1 | LZE2T | Human | Esophagus | ESCC | 1.96e-03 | 7.21e-01 | 0.082 |
| 81542 | TMX1 | LZE4T | Human | Esophagus | ESCC | 1.01e-23 | 8.59e-01 | 0.0811 |
| 81542 | TMX1 | LZE5T | Human | Esophagus | ESCC | 3.27e-02 | 4.65e-01 | 0.0514 |
| 81542 | TMX1 | LZE7T | Human | Esophagus | ESCC | 2.70e-05 | 5.16e-01 | 0.0667 |
| 81542 | TMX1 | LZE8T | Human | Esophagus | ESCC | 1.53e-10 | 4.42e-01 | 0.067 |
| 81542 | TMX1 | LZE20T | Human | Esophagus | ESCC | 6.01e-07 | 4.01e-01 | 0.0662 |
| 81542 | TMX1 | LZE22T | Human | Esophagus | ESCC | 2.12e-04 | 8.25e-01 | 0.068 |
| 81542 | TMX1 | LZE24T | Human | Esophagus | ESCC | 1.67e-21 | 6.72e-01 | 0.0596 |
| 81542 | TMX1 | LZE6T | Human | Esophagus | ESCC | 9.21e-06 | 6.27e-01 | 0.0845 |
| 81542 | TMX1 | P1T-E | Human | Esophagus | ESCC | 3.43e-09 | 2.86e-01 | 0.0875 |
| 81542 | TMX1 | P2T-E | Human | Esophagus | ESCC | 2.93e-45 | 7.78e-01 | 0.1177 |
| 81542 | TMX1 | P4T-E | Human | Esophagus | ESCC | 5.01e-44 | 1.18e+00 | 0.1323 |
| 81542 | TMX1 | P5T-E | Human | Esophagus | ESCC | 2.40e-15 | 2.97e-01 | 0.1327 |
| 81542 | TMX1 | P8T-E | Human | Esophagus | ESCC | 2.23e-53 | 8.53e-01 | 0.0889 |
| 81542 | TMX1 | P9T-E | Human | Esophagus | ESCC | 8.88e-15 | 4.47e-01 | 0.1131 |
| 81542 | TMX1 | P10T-E | Human | Esophagus | ESCC | 4.52e-81 | 1.32e+00 | 0.116 |
| 81542 | TMX1 | P11T-E | Human | Esophagus | ESCC | 1.85e-27 | 1.24e+00 | 0.1426 |
| 81542 | TMX1 | P12T-E | Human | Esophagus | ESCC | 1.89e-60 | 1.21e+00 | 0.1122 |
| 81542 | TMX1 | P15T-E | Human | Esophagus | ESCC | 7.73e-69 | 1.81e+00 | 0.1149 |
| 81542 | TMX1 | P16T-E | Human | Esophagus | ESCC | 5.44e-62 | 1.05e+00 | 0.1153 |
| Page: 1 2 3 4 5 6 |
| Tissue | Expression Dynamics | Abbreviation |
| Esophagus |  | ESCC: Esophageal squamous cell carcinoma |
| HGIN: High-grade intraepithelial neoplasias | ||
| LGIN: Low-grade intraepithelial neoplasias | ||
| Liver | 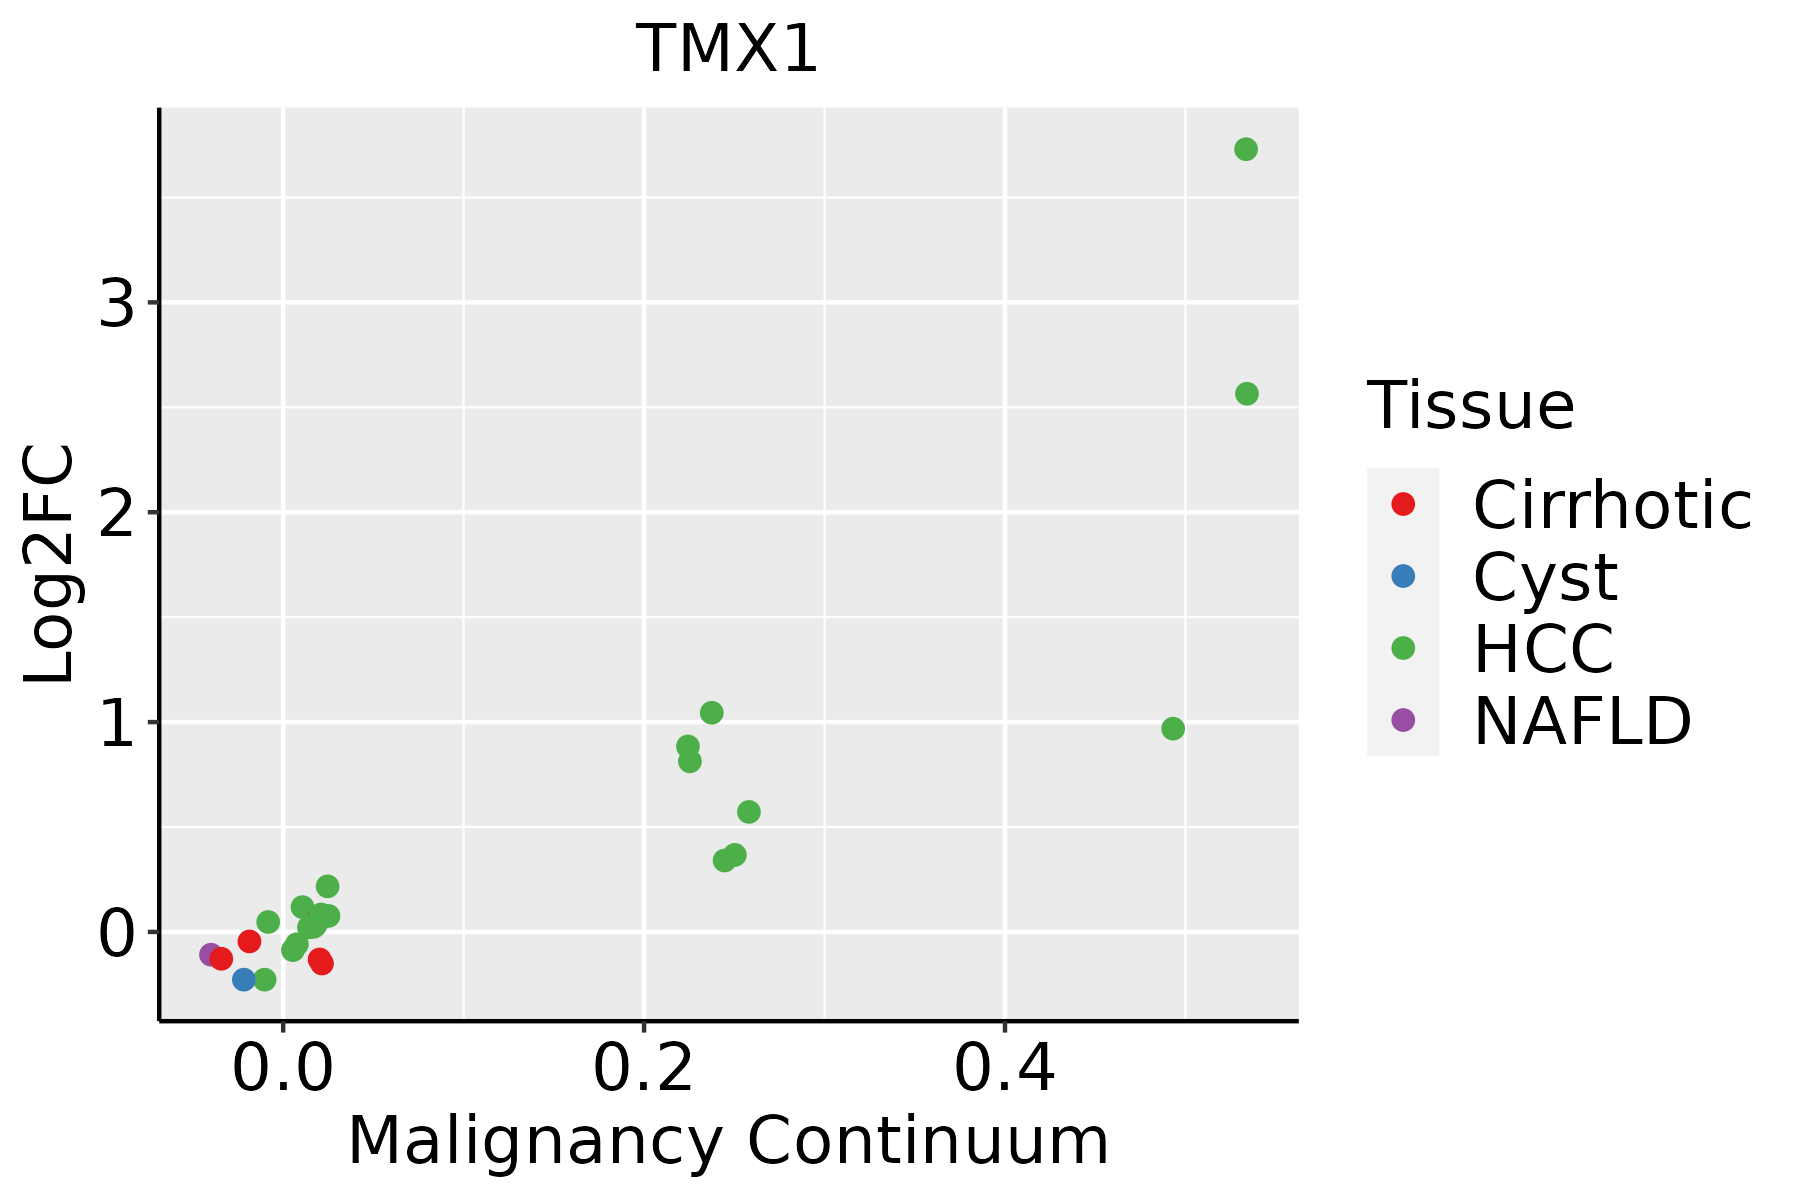 | HCC: Hepatocellular carcinoma |
| NAFLD: Non-alcoholic fatty liver disease | ||
| Oral Cavity | 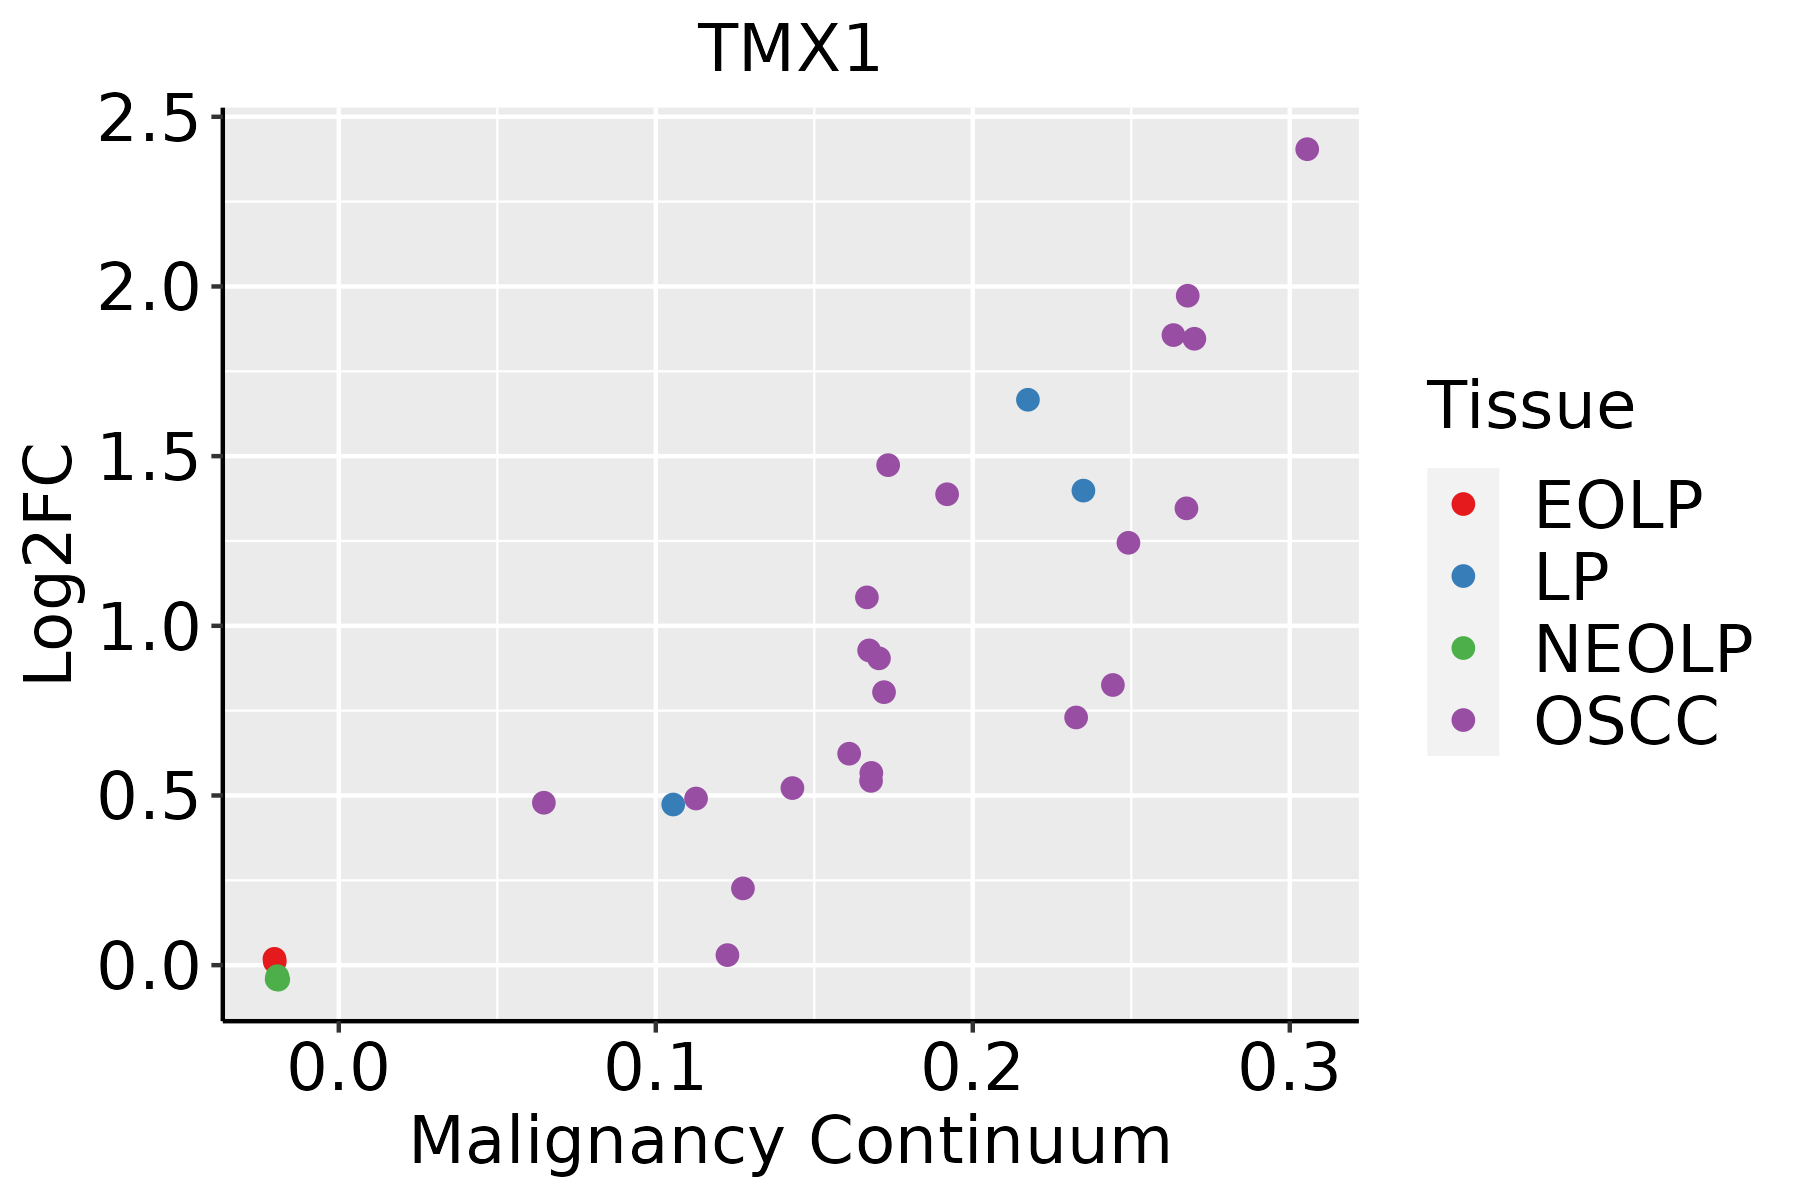 | EOLP: Erosive Oral lichen planus |
| LP: leukoplakia | ||
| NEOLP: Non-erosive oral lichen planus | ||
| OSCC: Oral squamous cell carcinoma | ||
| Skin |  | AK: Actinic keratosis |
| cSCC: Cutaneous squamous cell carcinoma | ||
| SCCIS:squamous cell carcinoma in situ | ||
| Thyroid | 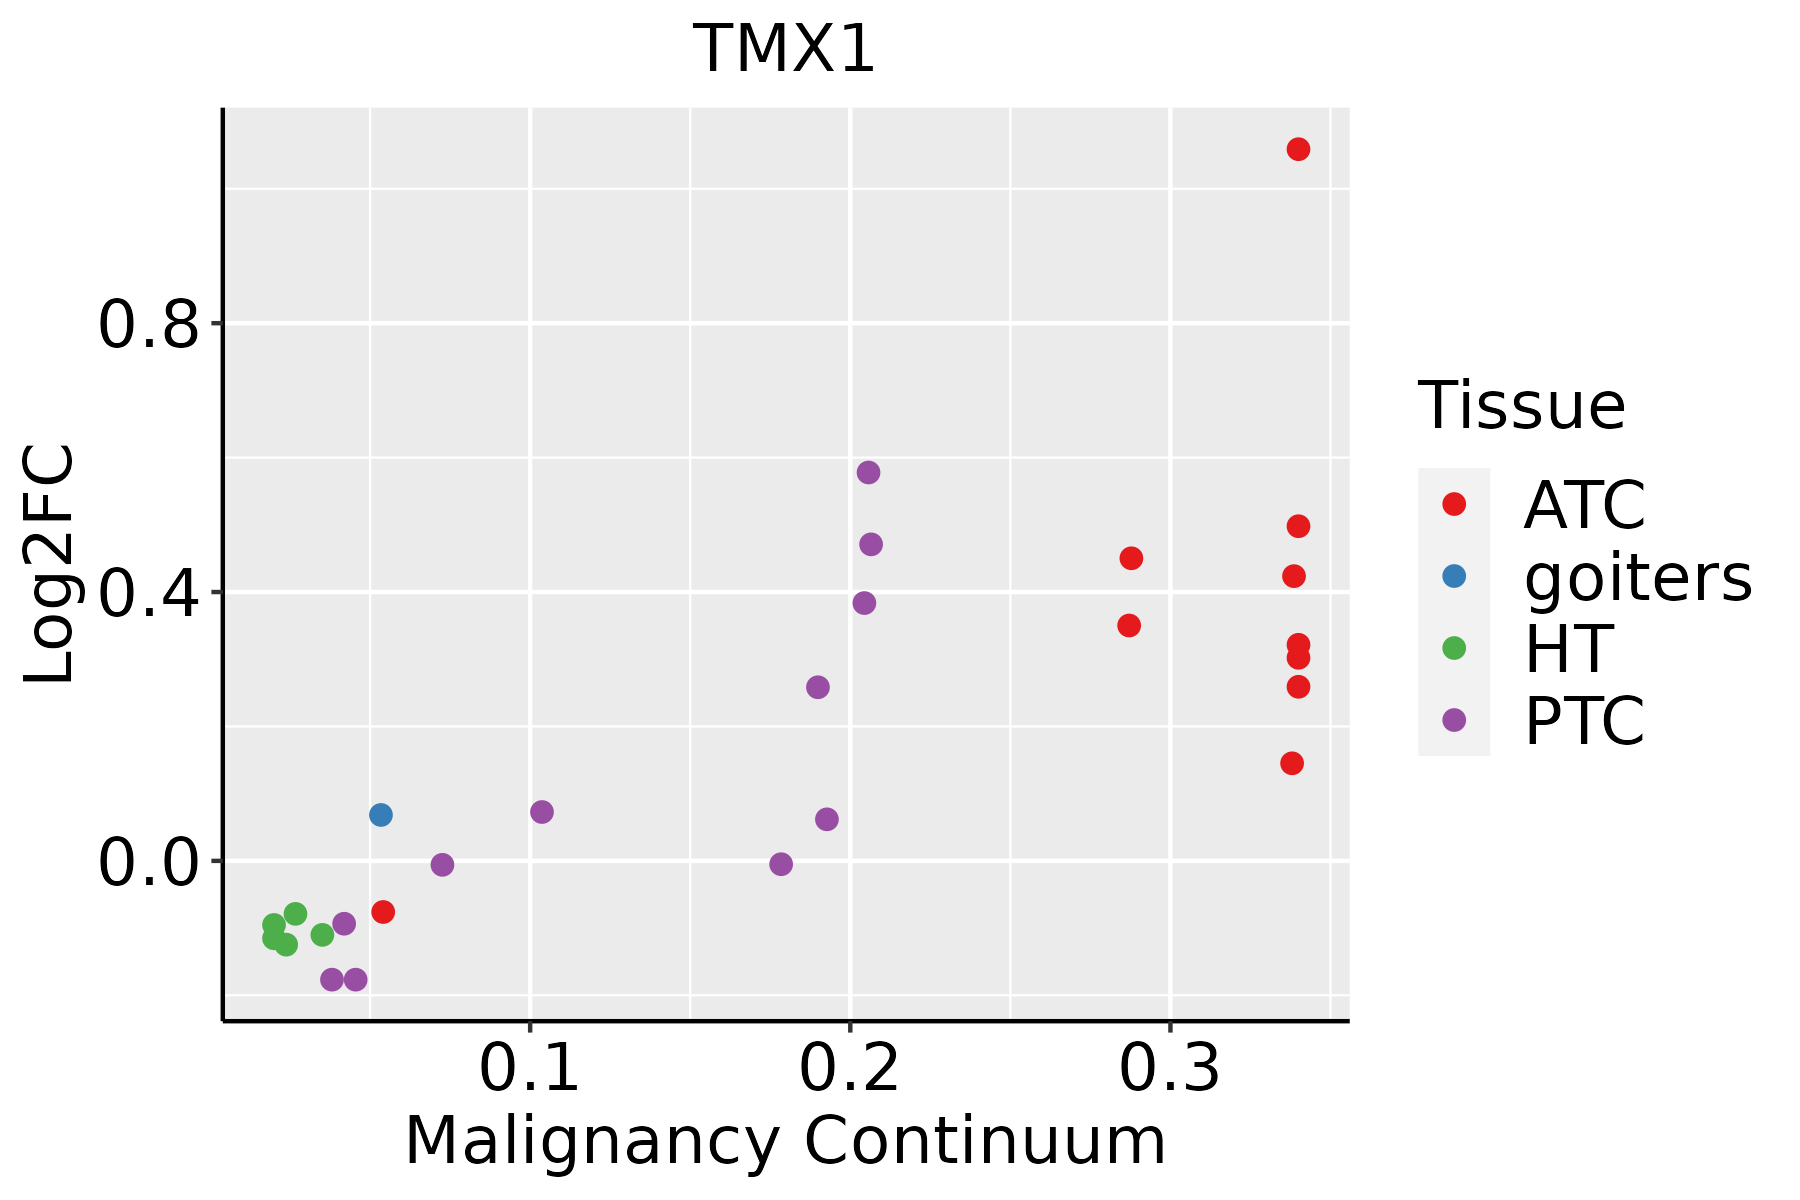 | ATC: Anaplastic thyroid cancer |
| HT: Hashimoto's thyroiditis | ||
| PTC: Papillary thyroid cancer |
| ∗log2FC in expression of this searched gene in stem-like cells from each diseased tissue sample relative to stem-like cells in normal samples in each tissue plotted against the malignancy continuum. Samples are colored based on if they are from different disease stage. |
Top |
Malignant transformation related pathway analysis |
| Find out the enriched GO biological processes and KEGG pathways involved in transition from healthy to precancer to cancer |
| Tissue | Disease Stage | Enriched GO biological Processes |
| Colorectum | AD |  |
| Colorectum | SER |  |
| Colorectum | MSS |  |
| Colorectum | MSI-H |  |
| Colorectum | FAP |  |
| ∗Top 15 enriched GO BP terms are showed in the bar plot of each disease state in each tissue. Each row represents a significant GO biological process which is colored according to the -log10(p.adjust). |
| Page: 1 2 3 4 5 6 7 8 9 |
| GO ID | Tissue | Disease Stage | Description | Gene Ratio | Bg Ratio | pvalue | p.adjust | Count |
| GO:0034976111 | Esophagus | ESCC | response to endoplasmic reticulum stress | 192/8552 | 256/18723 | 7.15e-22 | 1.30e-19 | 192 |
| GO:00349767 | Liver | Cirrhotic | response to endoplasmic reticulum stress | 130/4634 | 256/18723 | 1.72e-19 | 3.86e-17 | 130 |
| GO:003497612 | Liver | HCC | response to endoplasmic reticulum stress | 189/7958 | 256/18723 | 1.43e-24 | 4.06e-22 | 189 |
| GO:003497620 | Oral cavity | OSCC | response to endoplasmic reticulum stress | 178/7305 | 256/18723 | 2.59e-23 | 6.06e-21 | 178 |
| GO:0034976110 | Oral cavity | LP | response to endoplasmic reticulum stress | 133/4623 | 256/18723 | 3.84e-21 | 9.24e-19 | 133 |
| GO:0034976112 | Skin | cSCC | response to endoplasmic reticulum stress | 128/4864 | 256/18723 | 1.16e-16 | 1.17e-14 | 128 |
| GO:0034976113 | Thyroid | PTC | response to endoplasmic reticulum stress | 161/5968 | 256/18723 | 1.14e-24 | 3.27e-22 | 161 |
| GO:003497633 | Thyroid | ATC | response to endoplasmic reticulum stress | 167/6293 | 256/18723 | 2.62e-25 | 1.03e-22 | 167 |
| Page: 1 |
| Pathway ID | Tissue | Disease Stage | Description | Gene Ratio | Bg Ratio | pvalue | p.adjust | qvalue | Count |
| Page: 1 |
Top |
Cell-cell communication analysis |
| Identification of potential cell-cell interactions between two cell types and their ligand-receptor pairs for different disease states |
| Ligand | Receptor | LRpair | Pathway | Tissue | Disease Stage |
| Page: 1 |
Top |
Single-cell gene regulatory network inference analysis |
| Find out the significant the regulons (TFs) and the target genes of each regulon across cell types for different disease states |
| TF | Cell Type | Tissue | Disease Stage | Target Gene | RSS | Regulon Activity |
| ∗The dot plots of a searched regulon are shown for all cell subpopulations in each disease state of each tissue based on the regulon specific score inferred using pySCENIC and by calculating the average expression. |
| Page: 1 |
Top |
Somatic mutation of malignant transformation related genes |
| Annotation of somatic variants for genes involved in malignant transformation |
| Hugo Symbol | Variant Class | Variant Classification | dbSNP RS | HGVSc | HGVSp | HGVSp Short | SWISSPROT | BIOTYPE | SIFT | PolyPhen | Tumor Sample Barcode | Tissue | Histology | Sex | Age | Stage | Therapy Types | Drugs | Outcome |
| TMX1 | SNV | Missense_Mutation | novel | c.65N>T | p.Pro22Leu | p.P22L | Q9H3N1 | protein_coding | tolerated(0.27) | probably_damaging(0.942) | TCGA-A7-A3IY-01 | Breast | breast invasive carcinoma | Female | >=65 | I/II | Hormone Therapy | anastrozole | SD |
| TMX1 | SNV | Missense_Mutation | c.706G>A | p.Glu236Lys | p.E236K | Q9H3N1 | protein_coding | tolerated(0.19) | benign(0.227) | TCGA-D8-A27G-01 | Breast | breast invasive carcinoma | Female | >=65 | I/II | Unknown | Unknown | SD | |
| TMX1 | SNV | Missense_Mutation | c.597N>A | p.Met199Ile | p.M199I | Q9H3N1 | protein_coding | tolerated(0.41) | benign(0.014) | TCGA-LP-A4AV-01 | Cervix | cervical & endocervical cancer | Female | <65 | I/II | Unknown | Unknown | SD | |
| TMX1 | SNV | Missense_Mutation | rs777140042 | c.86N>A | p.Ser29Asn | p.S29N | Q9H3N1 | protein_coding | tolerated(0.23) | benign(0.03) | TCGA-A6-2686-01 | Colorectum | colon adenocarcinoma | Female | >=65 | I/II | Unknown | Unknown | SD |
| TMX1 | SNV | Missense_Mutation | novel | c.257C>T | p.Thr86Ile | p.T86I | Q9H3N1 | protein_coding | deleterious(0) | possibly_damaging(0.898) | TCGA-AA-3845-01 | Colorectum | colon adenocarcinoma | Female | >=65 | I/II | Unknown | Unknown | PD |
| TMX1 | SNV | Missense_Mutation | rs775236782 | c.242N>T | p.Ala81Val | p.A81V | Q9H3N1 | protein_coding | deleterious(0) | possibly_damaging(0.476) | TCGA-AA-A01R-01 | Colorectum | colon adenocarcinoma | Male | <65 | III/IV | Chemotherapy | 5-fluorouracil | PD |
| TMX1 | SNV | Missense_Mutation | rs369843771 | c.635G>A | p.Arg212His | p.R212H | Q9H3N1 | protein_coding | tolerated(0.89) | benign(0.001) | TCGA-CM-4746-01 | Colorectum | colon adenocarcinoma | Male | <65 | I/II | Unknown | Unknown | SD |
| TMX1 | SNV | Missense_Mutation | novel | c.500A>C | p.Asn167Thr | p.N167T | Q9H3N1 | protein_coding | tolerated(0.31) | benign(0.015) | TCGA-A5-A1OF-01 | Endometrium | uterine corpus endometrioid carcinoma | Female | <65 | I/II | Unknown | Unknown | SD |
| TMX1 | SNV | Missense_Mutation | novel | c.724G>A | p.Asp242Asn | p.D242N | Q9H3N1 | protein_coding | tolerated(0.3) | possibly_damaging(0.505) | TCGA-A5-A2K5-01 | Endometrium | uterine corpus endometrioid carcinoma | Female | >=65 | I/II | Unknown | Unknown | SD |
| TMX1 | SNV | Missense_Mutation | novel | c.322N>T | p.Asp108Tyr | p.D108Y | Q9H3N1 | protein_coding | deleterious(0) | probably_damaging(0.981) | TCGA-AP-A1DV-01 | Endometrium | uterine corpus endometrioid carcinoma | Female | <65 | I/II | Unknown | Unknown | SD |
| Page: 1 2 3 4 |
Top |
Related drugs of malignant transformation related genes |
| Identification of chemicals and drugs interact with genes involved in malignant transfromation |
| (DGIdb 4.0) |
| Entrez ID | Symbol | Category | Interaction Types | Drug Claim Name | Drug Name | PMIDs |
| Page: 1 |

Copyright 2023-Present -The University of Texas Health Science Center at Houston |