
|
|||||
|
 | |
| |
| |
| |
| |
| |
|
Gene: TMUB2 |
Gene summary for TMUB2 |
| Gene information | Species | Human | Gene symbol | TMUB2 | Gene ID | 79089 |
| Gene name | transmembrane and ubiquitin like domain containing 2 | |
| Gene Alias | FP2653 | |
| Cytomap | 17q21.31 | |
| Gene Type | protein-coding | GO ID | GO:0006508 | UniProtAcc | Q71RG4 |
Top |
Malignant transformation analysis |
| Identification of the aberrant gene expression in precancerous and cancerous lesions by comparing the gene expression of stem-like cells in diseased tissues with normal stem cells |
| Entrez ID | Symbol | Replicates | Species | Organ | Tissue | Adj P-value | Log2FC | Malignancy |
| 79089 | TMUB2 | LZE4T | Human | Esophagus | ESCC | 1.24e-09 | 2.38e-01 | 0.0811 |
| 79089 | TMUB2 | LZE7T | Human | Esophagus | ESCC | 2.58e-07 | 2.27e-01 | 0.0667 |
| 79089 | TMUB2 | LZE8T | Human | Esophagus | ESCC | 3.31e-06 | 1.48e-01 | 0.067 |
| 79089 | TMUB2 | LZE20T | Human | Esophagus | ESCC | 1.72e-09 | 1.85e-01 | 0.0662 |
| 79089 | TMUB2 | LZE22T | Human | Esophagus | ESCC | 1.01e-07 | 4.31e-01 | 0.068 |
| 79089 | TMUB2 | LZE24T | Human | Esophagus | ESCC | 7.45e-23 | 6.49e-01 | 0.0596 |
| 79089 | TMUB2 | P1T-E | Human | Esophagus | ESCC | 5.35e-09 | 3.88e-01 | 0.0875 |
| 79089 | TMUB2 | P2T-E | Human | Esophagus | ESCC | 4.40e-23 | 3.95e-01 | 0.1177 |
| 79089 | TMUB2 | P4T-E | Human | Esophagus | ESCC | 6.94e-19 | 4.32e-01 | 0.1323 |
| 79089 | TMUB2 | P5T-E | Human | Esophagus | ESCC | 1.05e-19 | 1.90e-01 | 0.1327 |
| 79089 | TMUB2 | P8T-E | Human | Esophagus | ESCC | 2.86e-25 | 4.62e-01 | 0.0889 |
| 79089 | TMUB2 | P9T-E | Human | Esophagus | ESCC | 2.45e-13 | 2.49e-01 | 0.1131 |
| 79089 | TMUB2 | P10T-E | Human | Esophagus | ESCC | 9.33e-16 | 2.01e-01 | 0.116 |
| 79089 | TMUB2 | P11T-E | Human | Esophagus | ESCC | 1.01e-10 | 7.10e-01 | 0.1426 |
| 79089 | TMUB2 | P12T-E | Human | Esophagus | ESCC | 4.49e-33 | 4.78e-01 | 0.1122 |
| 79089 | TMUB2 | P15T-E | Human | Esophagus | ESCC | 4.38e-23 | 4.54e-01 | 0.1149 |
| 79089 | TMUB2 | P16T-E | Human | Esophagus | ESCC | 8.34e-25 | 3.89e-01 | 0.1153 |
| 79089 | TMUB2 | P17T-E | Human | Esophagus | ESCC | 6.33e-07 | 3.76e-01 | 0.1278 |
| 79089 | TMUB2 | P19T-E | Human | Esophagus | ESCC | 5.50e-08 | 6.38e-01 | 0.1662 |
| 79089 | TMUB2 | P20T-E | Human | Esophagus | ESCC | 8.70e-21 | 4.59e-01 | 0.1124 |
| Page: 1 2 3 4 5 6 |
| Tissue | Expression Dynamics | Abbreviation |
| Esophagus | 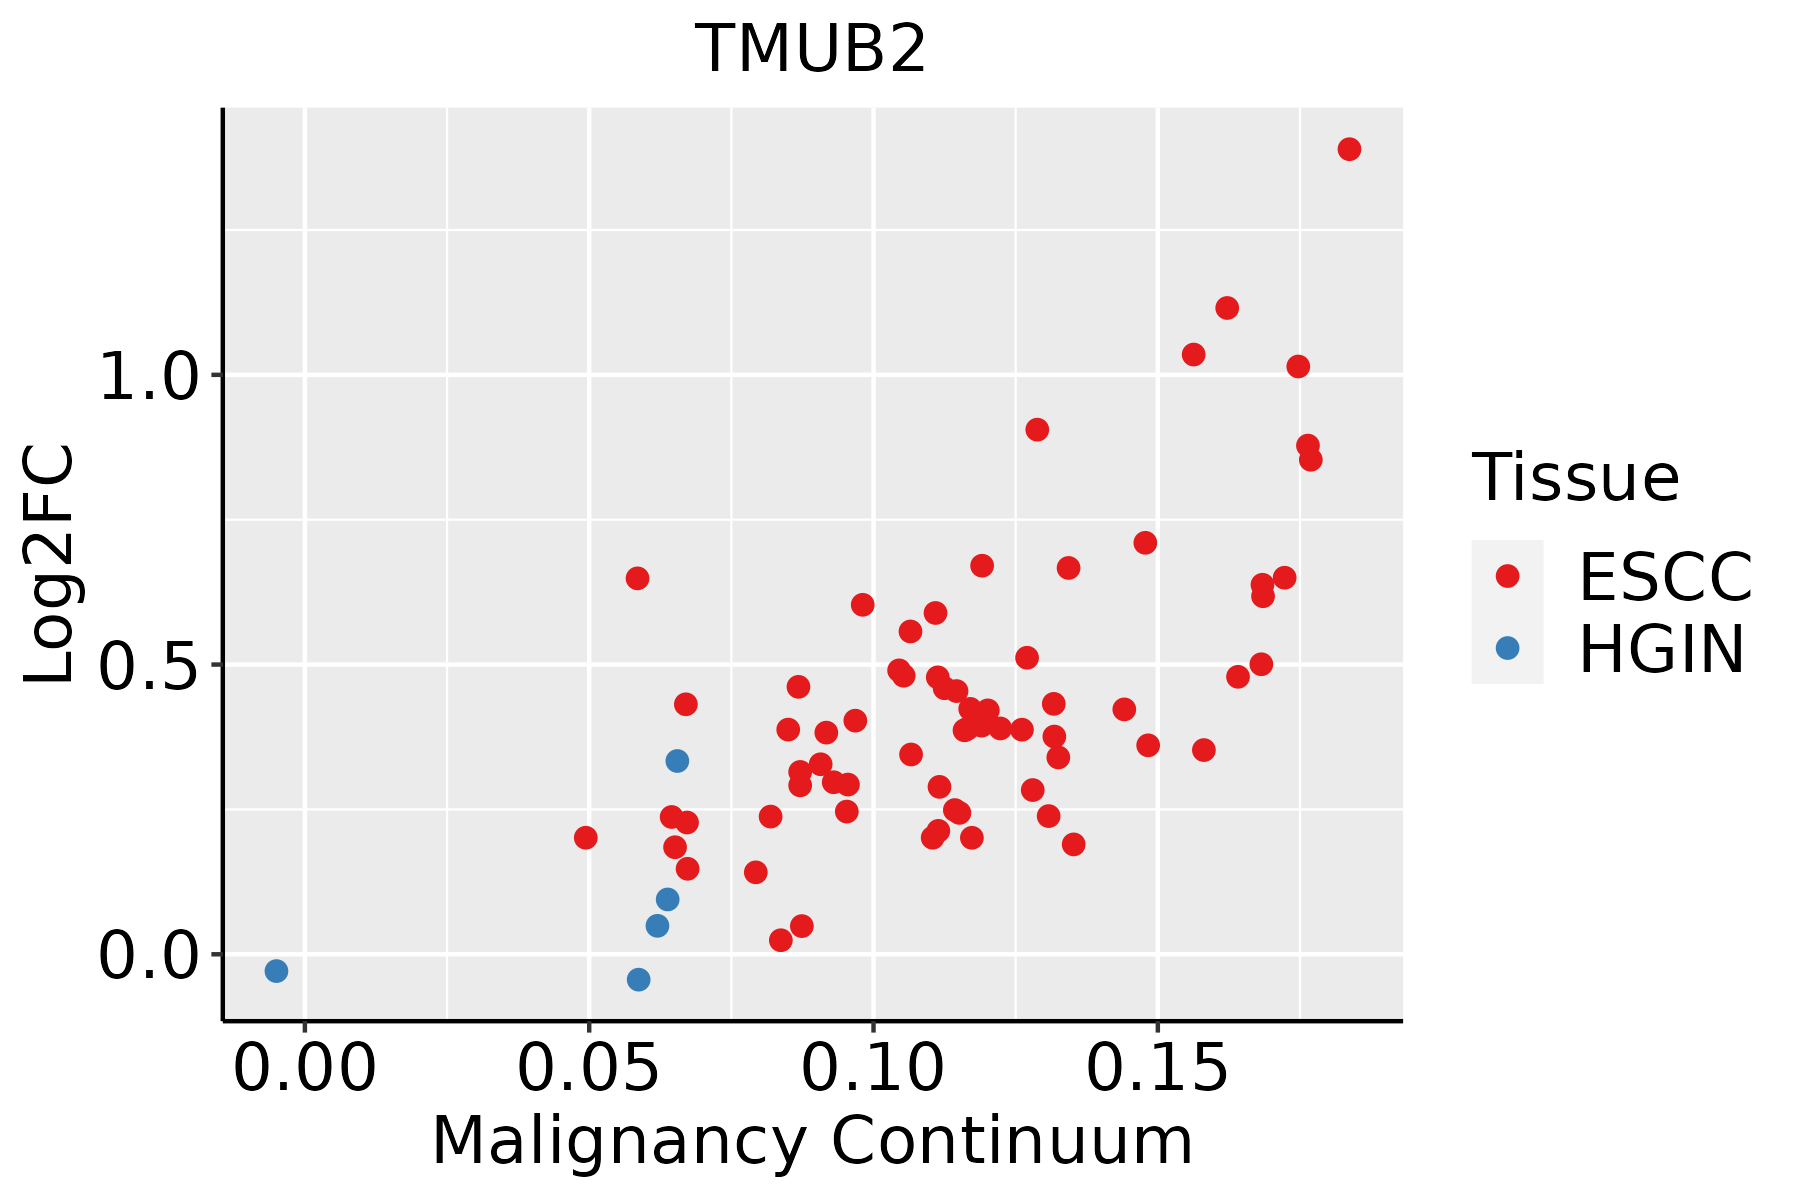 | ESCC: Esophageal squamous cell carcinoma |
| HGIN: High-grade intraepithelial neoplasias | ||
| LGIN: Low-grade intraepithelial neoplasias | ||
| Liver | 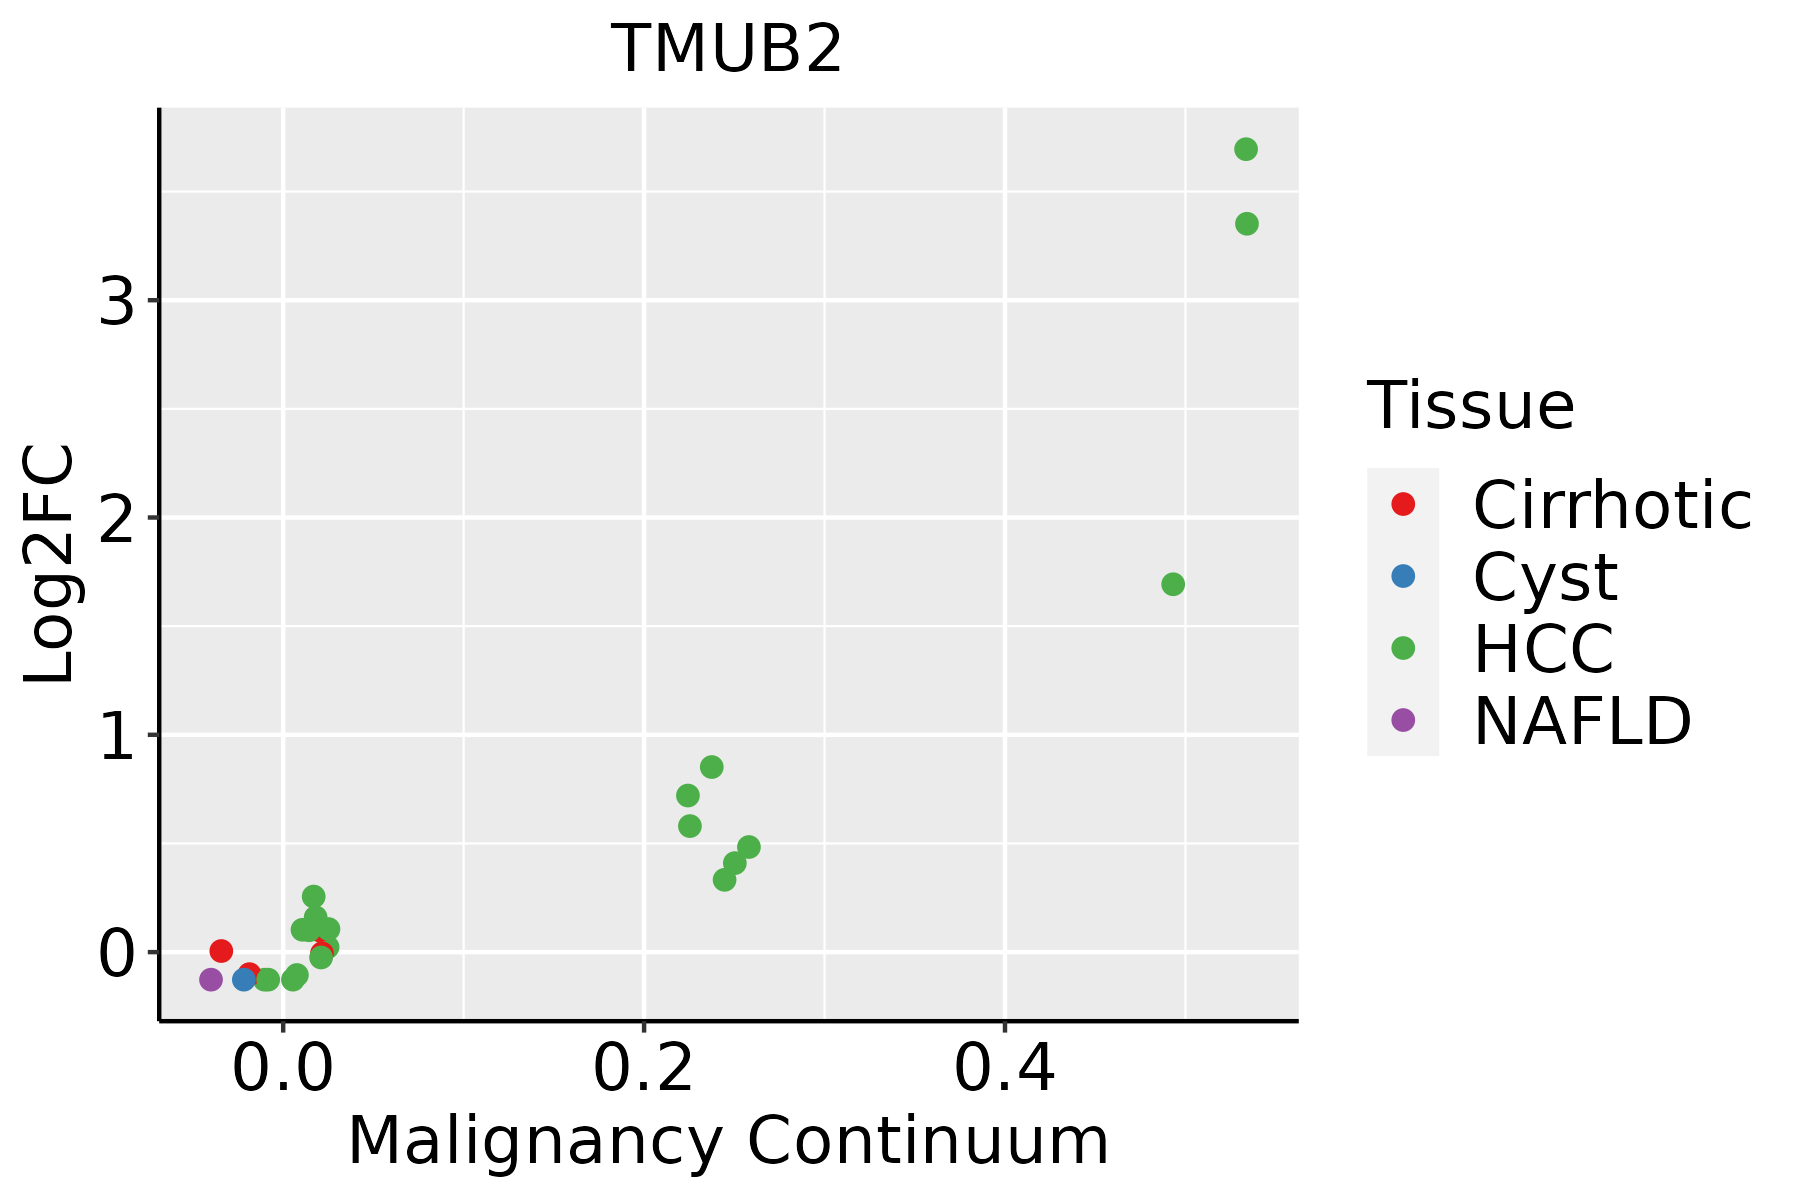 | HCC: Hepatocellular carcinoma |
| NAFLD: Non-alcoholic fatty liver disease | ||
| Oral Cavity | 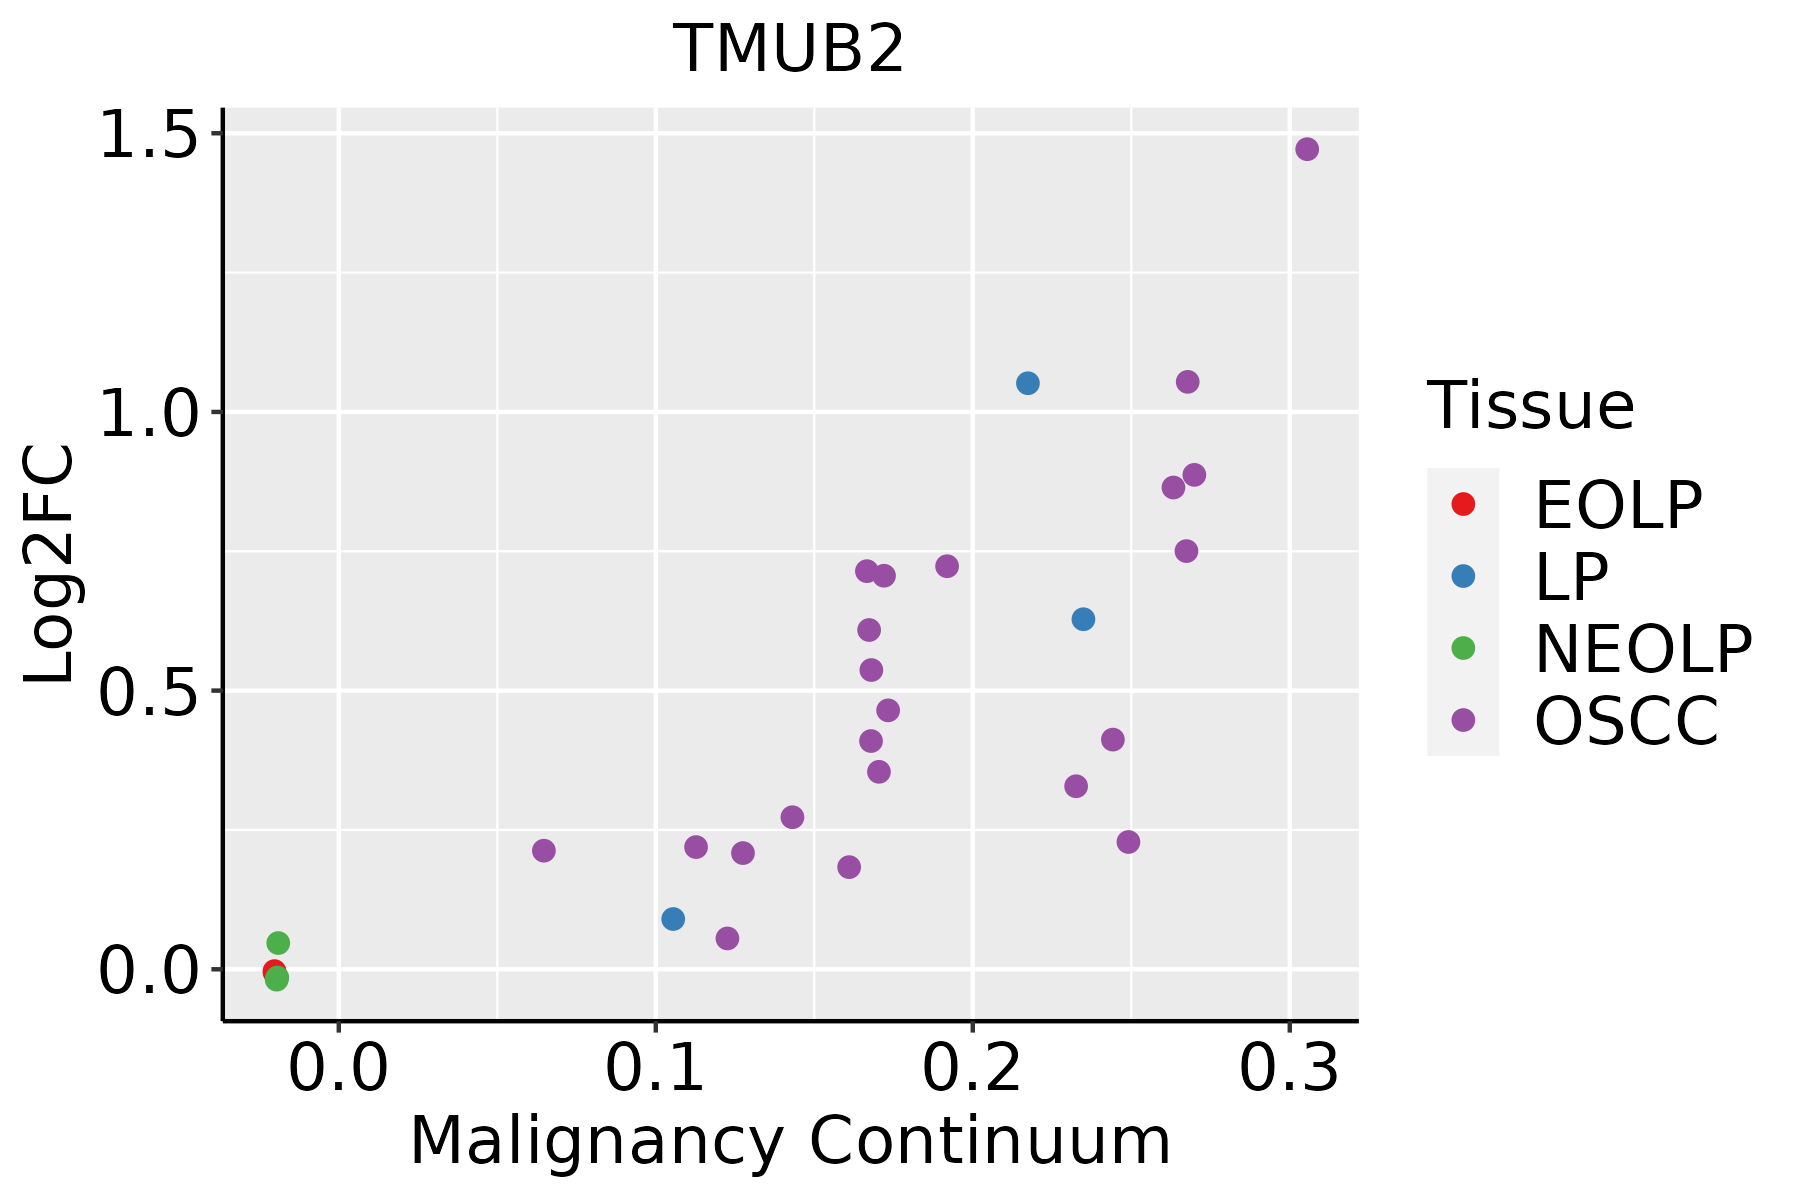 | EOLP: Erosive Oral lichen planus |
| LP: leukoplakia | ||
| NEOLP: Non-erosive oral lichen planus | ||
| OSCC: Oral squamous cell carcinoma | ||
| Skin | 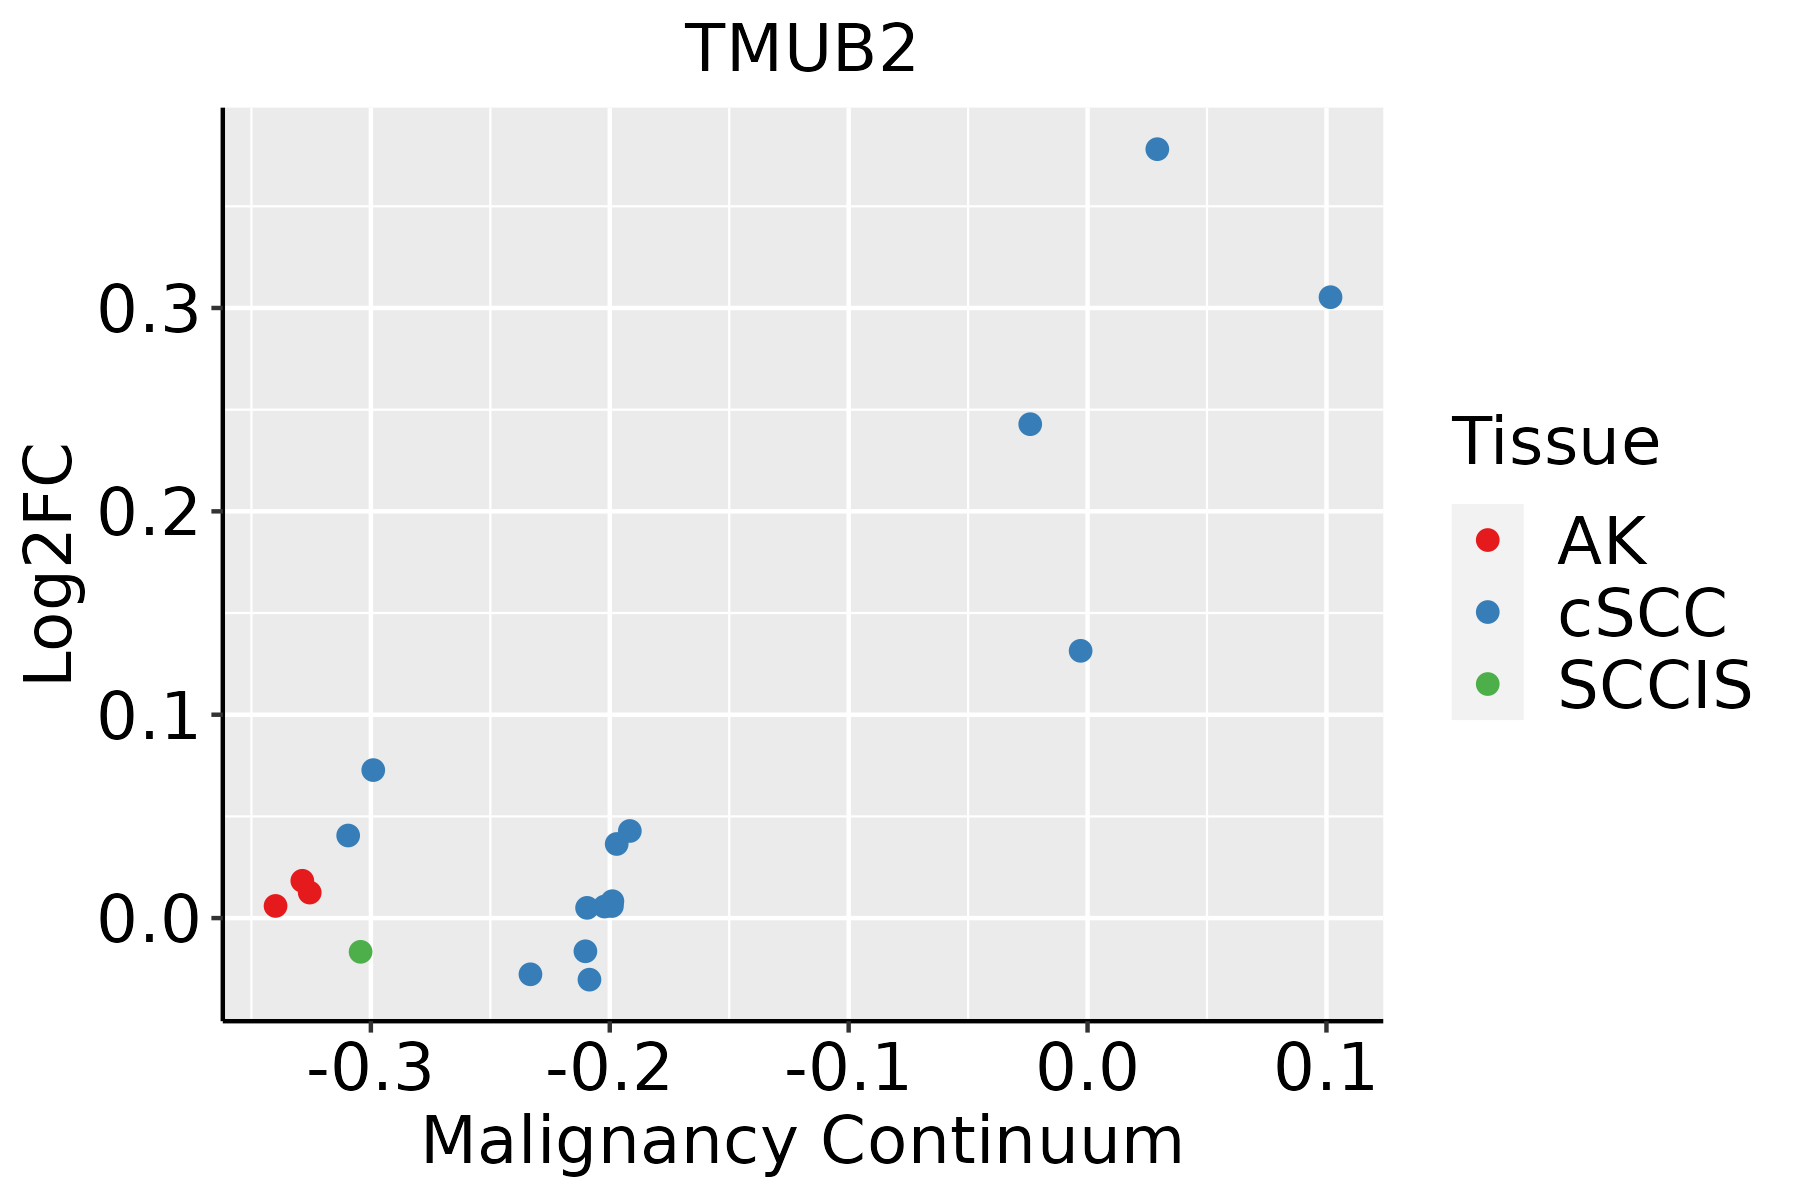 | AK: Actinic keratosis |
| cSCC: Cutaneous squamous cell carcinoma | ||
| SCCIS:squamous cell carcinoma in situ | ||
| Thyroid |  | ATC: Anaplastic thyroid cancer |
| HT: Hashimoto's thyroiditis | ||
| PTC: Papillary thyroid cancer |
| ∗log2FC in expression of this searched gene in stem-like cells from each diseased tissue sample relative to stem-like cells in normal samples in each tissue plotted against the malignancy continuum. Samples are colored based on if they are from different disease stage. |
Top |
Malignant transformation related pathway analysis |
| Find out the enriched GO biological processes and KEGG pathways involved in transition from healthy to precancer to cancer |
| Tissue | Disease Stage | Enriched GO biological Processes |
| Colorectum | AD |  |
| Colorectum | SER |  |
| Colorectum | MSS |  |
| Colorectum | MSI-H |  |
| Colorectum | FAP |  |
| ∗Top 15 enriched GO BP terms are showed in the bar plot of each disease state in each tissue. Each row represents a significant GO biological process which is colored according to the -log10(p.adjust). |
| Page: 1 2 3 4 5 6 7 8 9 |
| GO ID | Tissue | Disease Stage | Description | Gene Ratio | Bg Ratio | pvalue | p.adjust | Count |
| GO:0010498111 | Esophagus | ESCC | proteasomal protein catabolic process | 369/8552 | 490/18723 | 1.13e-41 | 1.80e-38 | 369 |
| GO:0043161111 | Esophagus | ESCC | proteasome-mediated ubiquitin-dependent protein catabolic process | 312/8552 | 412/18723 | 3.53e-36 | 4.48e-33 | 312 |
| GO:0034976111 | Esophagus | ESCC | response to endoplasmic reticulum stress | 192/8552 | 256/18723 | 7.15e-22 | 1.30e-19 | 192 |
| GO:003650315 | Esophagus | ESCC | ERAD pathway | 82/8552 | 107/18723 | 5.80e-11 | 1.84e-09 | 82 |
| GO:003043314 | Esophagus | ESCC | ubiquitin-dependent ERAD pathway | 66/8552 | 85/18723 | 1.64e-09 | 3.78e-08 | 66 |
| GO:001049812 | Liver | Cirrhotic | proteasomal protein catabolic process | 216/4634 | 490/18723 | 2.52e-21 | 9.29e-19 | 216 |
| GO:00349767 | Liver | Cirrhotic | response to endoplasmic reticulum stress | 130/4634 | 256/18723 | 1.72e-19 | 3.86e-17 | 130 |
| GO:004316112 | Liver | Cirrhotic | proteasome-mediated ubiquitin-dependent protein catabolic process | 184/4634 | 412/18723 | 4.52e-19 | 8.85e-17 | 184 |
| GO:0030433 | Liver | Cirrhotic | ubiquitin-dependent ERAD pathway | 45/4634 | 85/18723 | 2.19e-08 | 7.75e-07 | 45 |
| GO:00365032 | Liver | Cirrhotic | ERAD pathway | 53/4634 | 107/18723 | 2.58e-08 | 8.89e-07 | 53 |
| GO:001049822 | Liver | HCC | proteasomal protein catabolic process | 351/7958 | 490/18723 | 6.92e-40 | 1.46e-36 | 351 |
| GO:004316122 | Liver | HCC | proteasome-mediated ubiquitin-dependent protein catabolic process | 299/7958 | 412/18723 | 7.82e-36 | 8.27e-33 | 299 |
| GO:003497612 | Liver | HCC | response to endoplasmic reticulum stress | 189/7958 | 256/18723 | 1.43e-24 | 4.06e-22 | 189 |
| GO:003650311 | Liver | HCC | ERAD pathway | 88/7958 | 107/18723 | 2.87e-17 | 2.85e-15 | 88 |
| GO:00304331 | Liver | HCC | ubiquitin-dependent ERAD pathway | 72/7958 | 85/18723 | 9.78e-16 | 7.47e-14 | 72 |
| GO:001049820 | Oral cavity | OSCC | proteasomal protein catabolic process | 336/7305 | 490/18723 | 5.45e-41 | 8.63e-38 | 336 |
| GO:004316120 | Oral cavity | OSCC | proteasome-mediated ubiquitin-dependent protein catabolic process | 285/7305 | 412/18723 | 5.68e-36 | 5.99e-33 | 285 |
| GO:003497620 | Oral cavity | OSCC | response to endoplasmic reticulum stress | 178/7305 | 256/18723 | 2.59e-23 | 6.06e-21 | 178 |
| GO:00304334 | Oral cavity | OSCC | ubiquitin-dependent ERAD pathway | 65/7305 | 85/18723 | 2.12e-12 | 8.99e-11 | 65 |
| GO:00365035 | Oral cavity | OSCC | ERAD pathway | 76/7305 | 107/18723 | 1.76e-11 | 6.11e-10 | 76 |
| Page: 1 2 |
| Pathway ID | Tissue | Disease Stage | Description | Gene Ratio | Bg Ratio | pvalue | p.adjust | qvalue | Count |
| Page: 1 |
Top |
Cell-cell communication analysis |
| Identification of potential cell-cell interactions between two cell types and their ligand-receptor pairs for different disease states |
| Ligand | Receptor | LRpair | Pathway | Tissue | Disease Stage |
| Page: 1 |
Top |
Single-cell gene regulatory network inference analysis |
| Find out the significant the regulons (TFs) and the target genes of each regulon across cell types for different disease states |
| TF | Cell Type | Tissue | Disease Stage | Target Gene | RSS | Regulon Activity |
| ∗The dot plots of a searched regulon are shown for all cell subpopulations in each disease state of each tissue based on the regulon specific score inferred using pySCENIC and by calculating the average expression. |
| Page: 1 |
Top |
Somatic mutation of malignant transformation related genes |
| Annotation of somatic variants for genes involved in malignant transformation |
| Hugo Symbol | Variant Class | Variant Classification | dbSNP RS | HGVSc | HGVSp | HGVSp Short | SWISSPROT | BIOTYPE | SIFT | PolyPhen | Tumor Sample Barcode | Tissue | Histology | Sex | Age | Stage | Therapy Types | Drugs | Outcome |
| TMUB2 | SNV | Missense_Mutation | c.502C>T | p.Pro168Ser | p.P168S | Q71RG4 | protein_coding | tolerated(0.61) | benign(0.001) | TCGA-A8-A09K-01 | Breast | breast invasive carcinoma | Female | >=65 | I/II | Unknown | Unknown | SD | |
| TMUB2 | SNV | Missense_Mutation | novel | c.398N>T | p.Ser133Ile | p.S133I | Q71RG4 | protein_coding | tolerated(0.11) | benign(0.015) | TCGA-AC-A8OS-01 | Breast | breast invasive carcinoma | Female | >=65 | I/II | Unknown | Unknown | SD |
| TMUB2 | SNV | Missense_Mutation | c.319N>A | p.Asp107Asn | p.D107N | Q71RG4 | protein_coding | tolerated(0.06) | benign(0.15) | TCGA-Q1-A73O-01 | Cervix | cervical & endocervical cancer | Female | <65 | I/II | Chemotherapy | cisplatin | CR | |
| TMUB2 | SNV | Missense_Mutation | rs764813246 | c.866N>A | p.Arg289Gln | p.R289Q | Q71RG4 | protein_coding | tolerated(0.27) | probably_damaging(0.994) | TCGA-CA-6717-01 | Colorectum | colon adenocarcinoma | Male | <65 | I/II | Chemotherapy | oxaliplatin | CR |
| TMUB2 | SNV | Missense_Mutation | c.431N>A | p.Pro144His | p.P144H | Q71RG4 | protein_coding | deleterious(0.04) | probably_damaging(0.956) | TCGA-F4-6703-01 | Colorectum | colon adenocarcinoma | Male | <65 | I/II | Unknown | Unknown | SD | |
| TMUB2 | deletion | Frame_Shift_Del | c.716delA | p.His239ProfsTer76 | p.H239Pfs*76 | Q71RG4 | protein_coding | TCGA-DM-A28E-01 | Colorectum | colon adenocarcinoma | Female | >=65 | I/II | Unknown | Unknown | SD | |||
| TMUB2 | SNV | Missense_Mutation | rs764517813 | c.349C>T | p.Arg117Trp | p.R117W | Q71RG4 | protein_coding | deleterious(0.02) | benign(0.109) | TCGA-AJ-A2QO-01 | Endometrium | uterine corpus endometrioid carcinoma | Female | >=65 | I/II | Unknown | Unknown | SD |
| TMUB2 | SNV | Missense_Mutation | rs769881302 | c.653N>A | p.Arg218His | p.R218H | Q71RG4 | protein_coding | tolerated(0.14) | benign(0.198) | TCGA-AP-A051-01 | Endometrium | uterine corpus endometrioid carcinoma | Female | >=65 | I/II | Unknown | Unknown | SD |
| TMUB2 | SNV | Missense_Mutation | c.50G>T | p.Ser17Ile | p.S17I | Q71RG4 | protein_coding | deleterious_low_confidence(0.01) | benign(0.193) | TCGA-AP-A0LM-01 | Endometrium | uterine corpus endometrioid carcinoma | Female | <65 | III/IV | Chemotherapy | cisplatin | SD | |
| TMUB2 | SNV | Missense_Mutation | rs767177141 | c.674N>A | p.Arg225His | p.R225H | Q71RG4 | protein_coding | deleterious(0.01) | possibly_damaging(0.828) | TCGA-AX-A2HD-01 | Endometrium | uterine corpus endometrioid carcinoma | Female | >=65 | III/IV | Unknown | Unknown | SD |
| Page: 1 2 3 |
Top |
Related drugs of malignant transformation related genes |
| Identification of chemicals and drugs interact with genes involved in malignant transfromation |
| (DGIdb 4.0) |
| Entrez ID | Symbol | Category | Interaction Types | Drug Claim Name | Drug Name | PMIDs |
| Page: 1 |

Copyright 2023-Present -The University of Texas Health Science Center at Houston |