
|
|||||
|
 | |
| |
| |
| |
| |
| |
|
Gene: TMUB1 |
Gene summary for TMUB1 |
| Gene information | Species | Human | Gene symbol | TMUB1 | Gene ID | 83590 |
| Gene name | transmembrane and ubiquitin like domain containing 1 | |
| Gene Alias | C7orf21 | |
| Cytomap | 7q36.1 | |
| Gene Type | protein-coding | GO ID | GO:0006508 | UniProtAcc | A0A090N8Q3 |
Top |
Malignant transformation analysis |
| Identification of the aberrant gene expression in precancerous and cancerous lesions by comparing the gene expression of stem-like cells in diseased tissues with normal stem cells |
| Entrez ID | Symbol | Replicates | Species | Organ | Tissue | Adj P-value | Log2FC | Malignancy |
| 83590 | TMUB1 | LZE2T | Human | Esophagus | ESCC | 1.87e-03 | 6.24e-01 | 0.082 |
| 83590 | TMUB1 | LZE3D | Human | Esophagus | HGIN | 2.41e-02 | 6.07e-01 | 0.0668 |
| 83590 | TMUB1 | LZE4T | Human | Esophagus | ESCC | 3.15e-07 | 2.00e-01 | 0.0811 |
| 83590 | TMUB1 | LZE5T | Human | Esophagus | ESCC | 5.03e-03 | 2.92e-01 | 0.0514 |
| 83590 | TMUB1 | LZE20T | Human | Esophagus | ESCC | 2.35e-11 | 5.39e-01 | 0.0662 |
| 83590 | TMUB1 | LZE22D1 | Human | Esophagus | HGIN | 1.39e-08 | 3.55e-01 | 0.0595 |
| 83590 | TMUB1 | LZE22T | Human | Esophagus | ESCC | 1.26e-09 | 6.03e-01 | 0.068 |
| 83590 | TMUB1 | LZE24T | Human | Esophagus | ESCC | 1.04e-25 | 7.08e-01 | 0.0596 |
| 83590 | TMUB1 | LZE21T | Human | Esophagus | ESCC | 1.06e-04 | 2.29e-01 | 0.0655 |
| 83590 | TMUB1 | P1T-E | Human | Esophagus | ESCC | 1.51e-21 | 9.07e-01 | 0.0875 |
| 83590 | TMUB1 | P2T-E | Human | Esophagus | ESCC | 1.80e-17 | 3.35e-01 | 0.1177 |
| 83590 | TMUB1 | P4T-E | Human | Esophagus | ESCC | 4.97e-45 | 1.06e+00 | 0.1323 |
| 83590 | TMUB1 | P5T-E | Human | Esophagus | ESCC | 1.28e-57 | 1.06e+00 | 0.1327 |
| 83590 | TMUB1 | P8T-E | Human | Esophagus | ESCC | 3.64e-47 | 7.70e-01 | 0.0889 |
| 83590 | TMUB1 | P9T-E | Human | Esophagus | ESCC | 1.35e-33 | 7.63e-01 | 0.1131 |
| 83590 | TMUB1 | P10T-E | Human | Esophagus | ESCC | 6.95e-36 | 6.28e-01 | 0.116 |
| 83590 | TMUB1 | P11T-E | Human | Esophagus | ESCC | 1.29e-18 | 6.76e-01 | 0.1426 |
| 83590 | TMUB1 | P12T-E | Human | Esophagus | ESCC | 2.77e-48 | 8.25e-01 | 0.1122 |
| 83590 | TMUB1 | P15T-E | Human | Esophagus | ESCC | 3.60e-66 | 1.43e+00 | 0.1149 |
| 83590 | TMUB1 | P16T-E | Human | Esophagus | ESCC | 1.08e-18 | 4.22e-01 | 0.1153 |
| Page: 1 2 3 4 5 6 7 |
| Tissue | Expression Dynamics | Abbreviation |
| Esophagus | 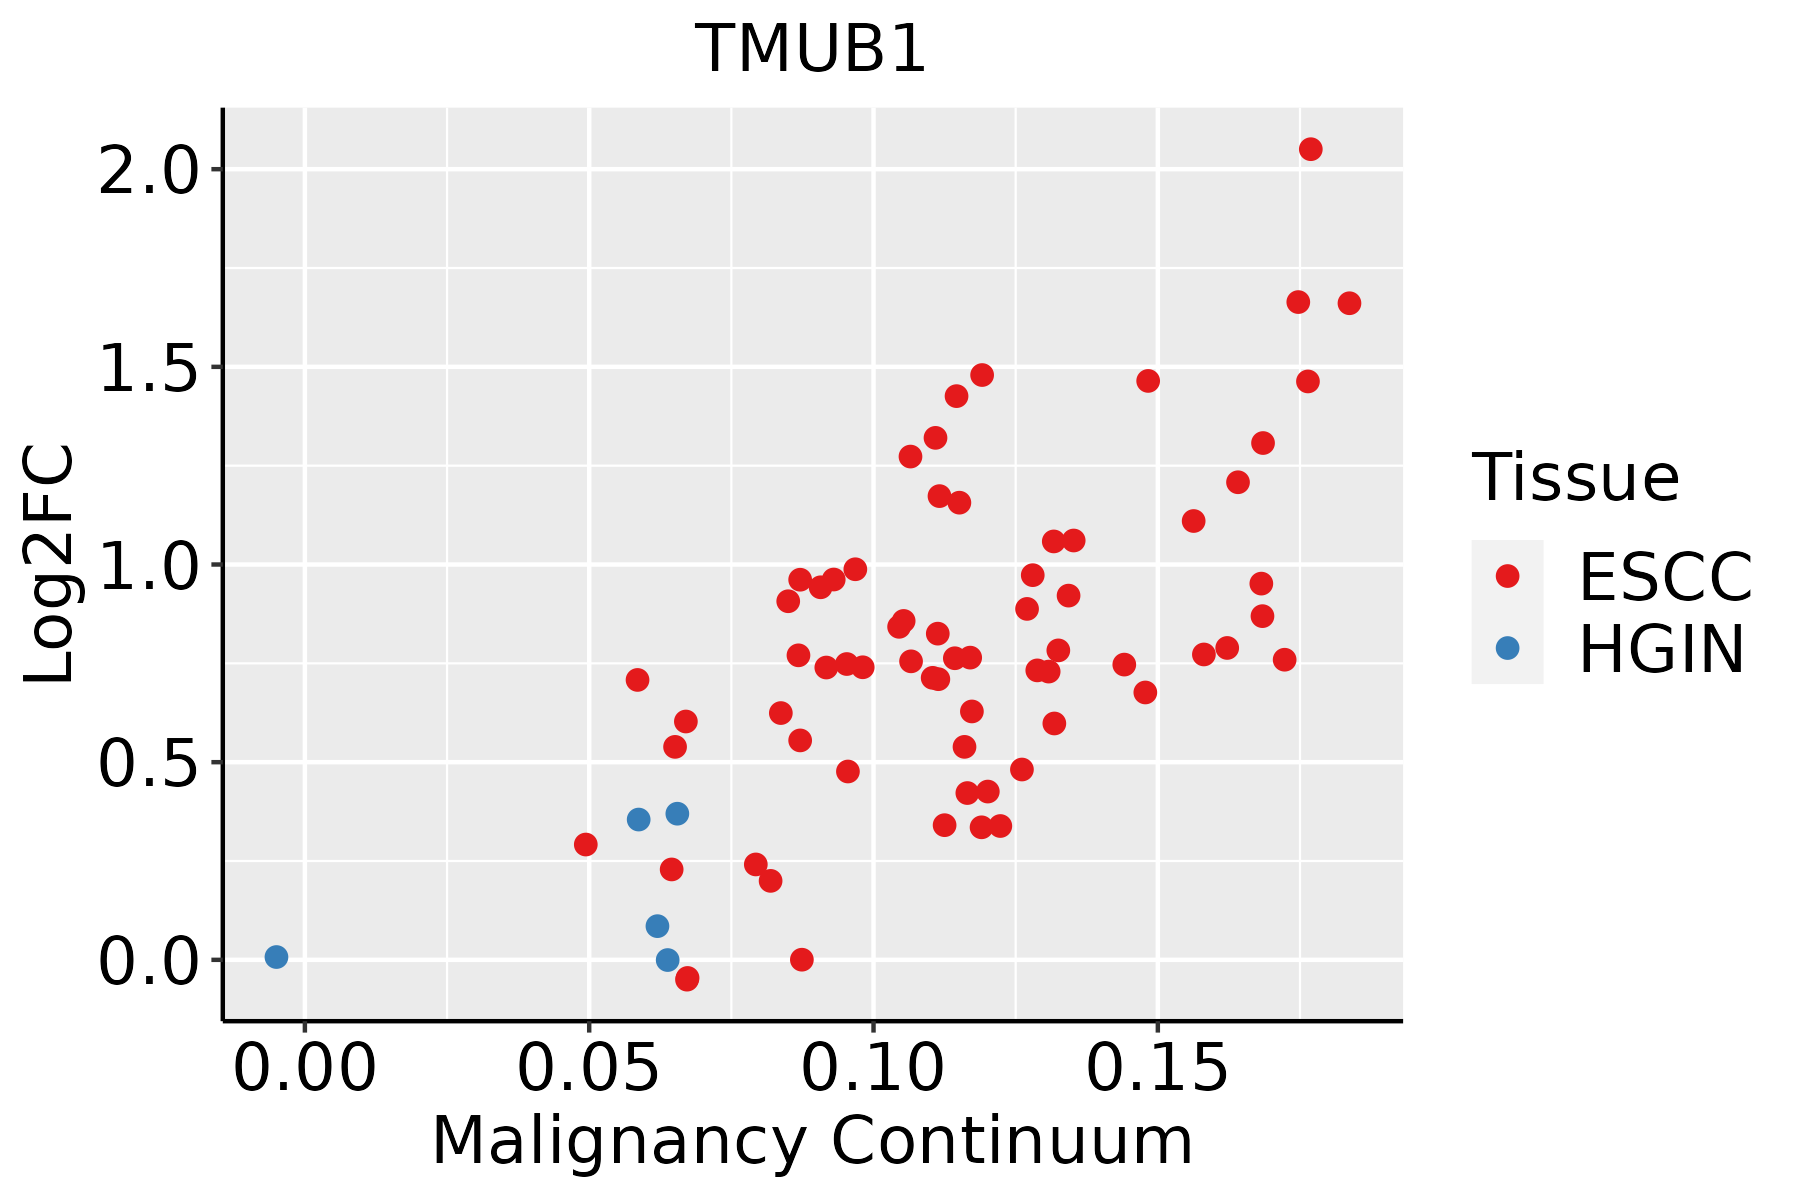 | ESCC: Esophageal squamous cell carcinoma |
| HGIN: High-grade intraepithelial neoplasias | ||
| LGIN: Low-grade intraepithelial neoplasias | ||
| Liver | 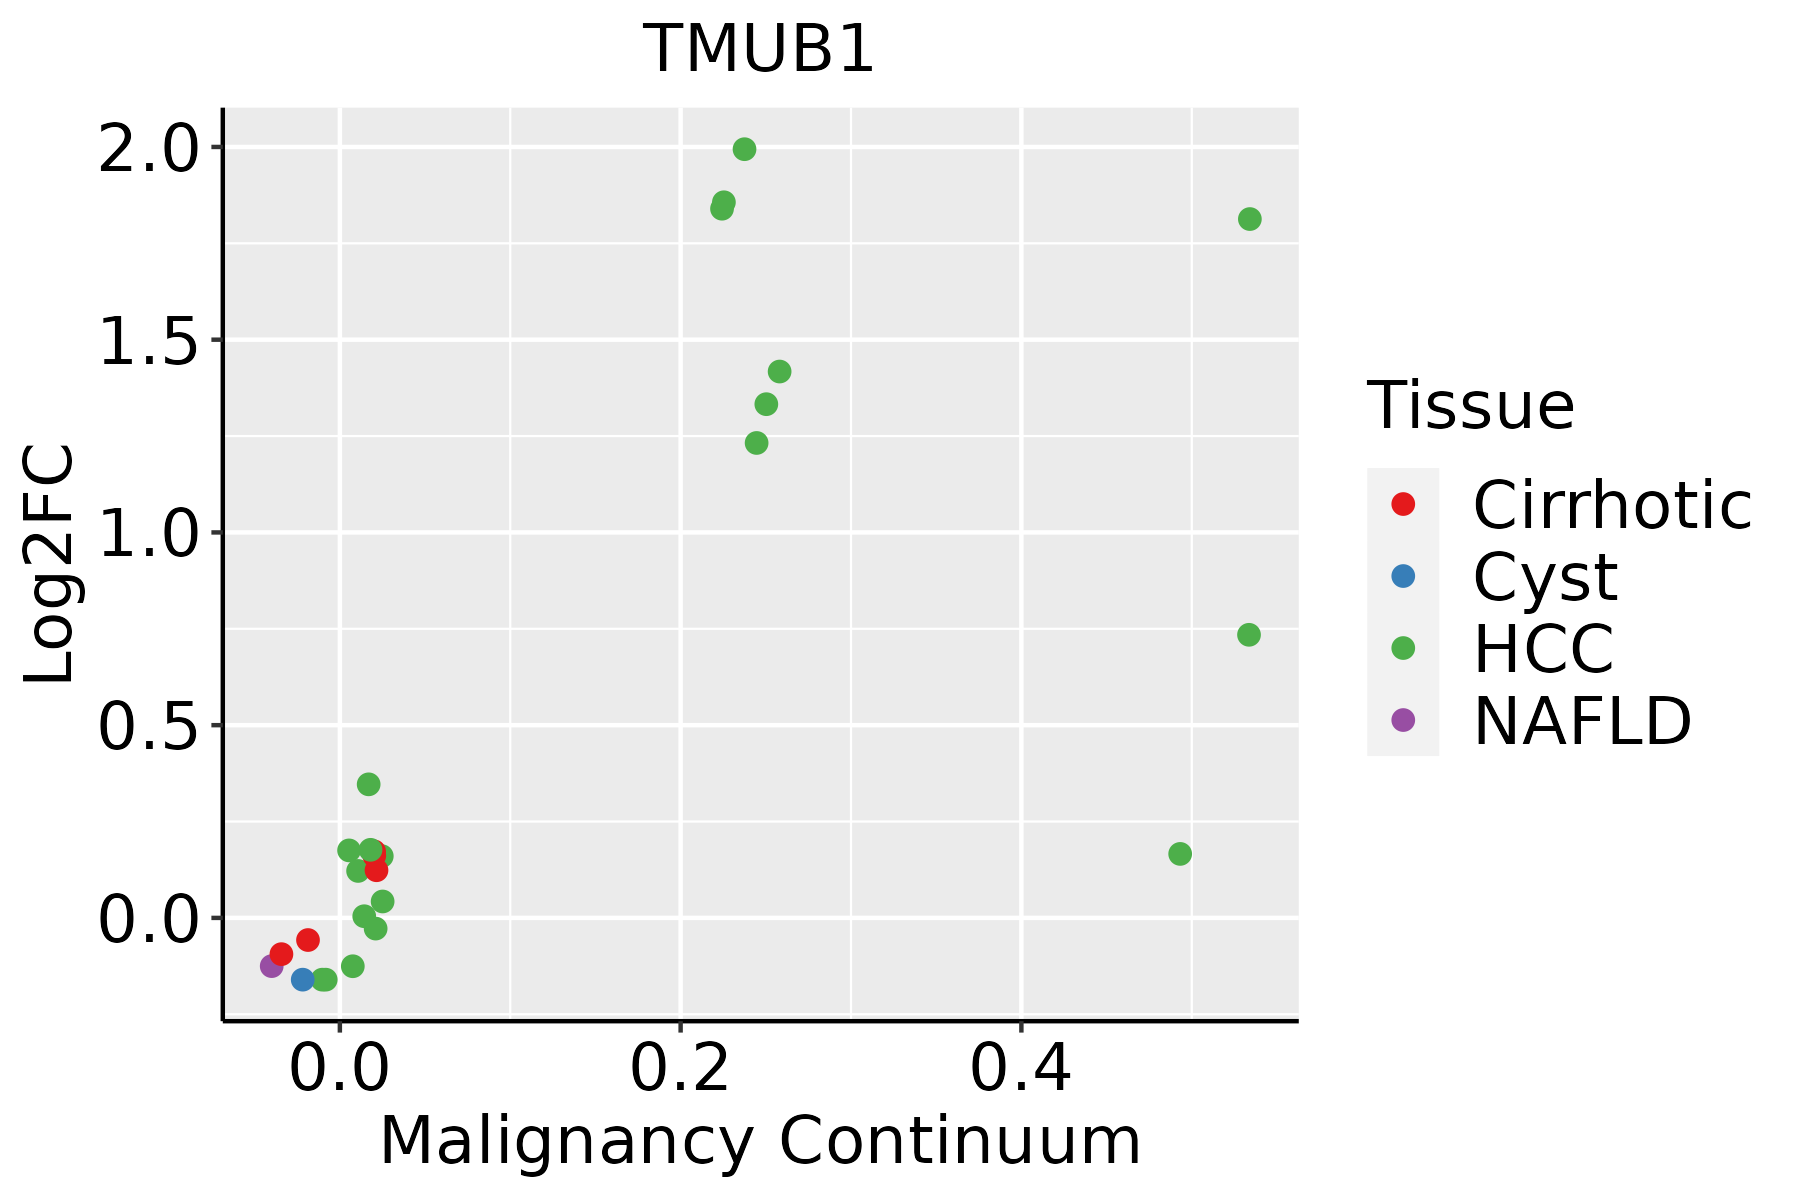 | HCC: Hepatocellular carcinoma |
| NAFLD: Non-alcoholic fatty liver disease | ||
| Oral Cavity | 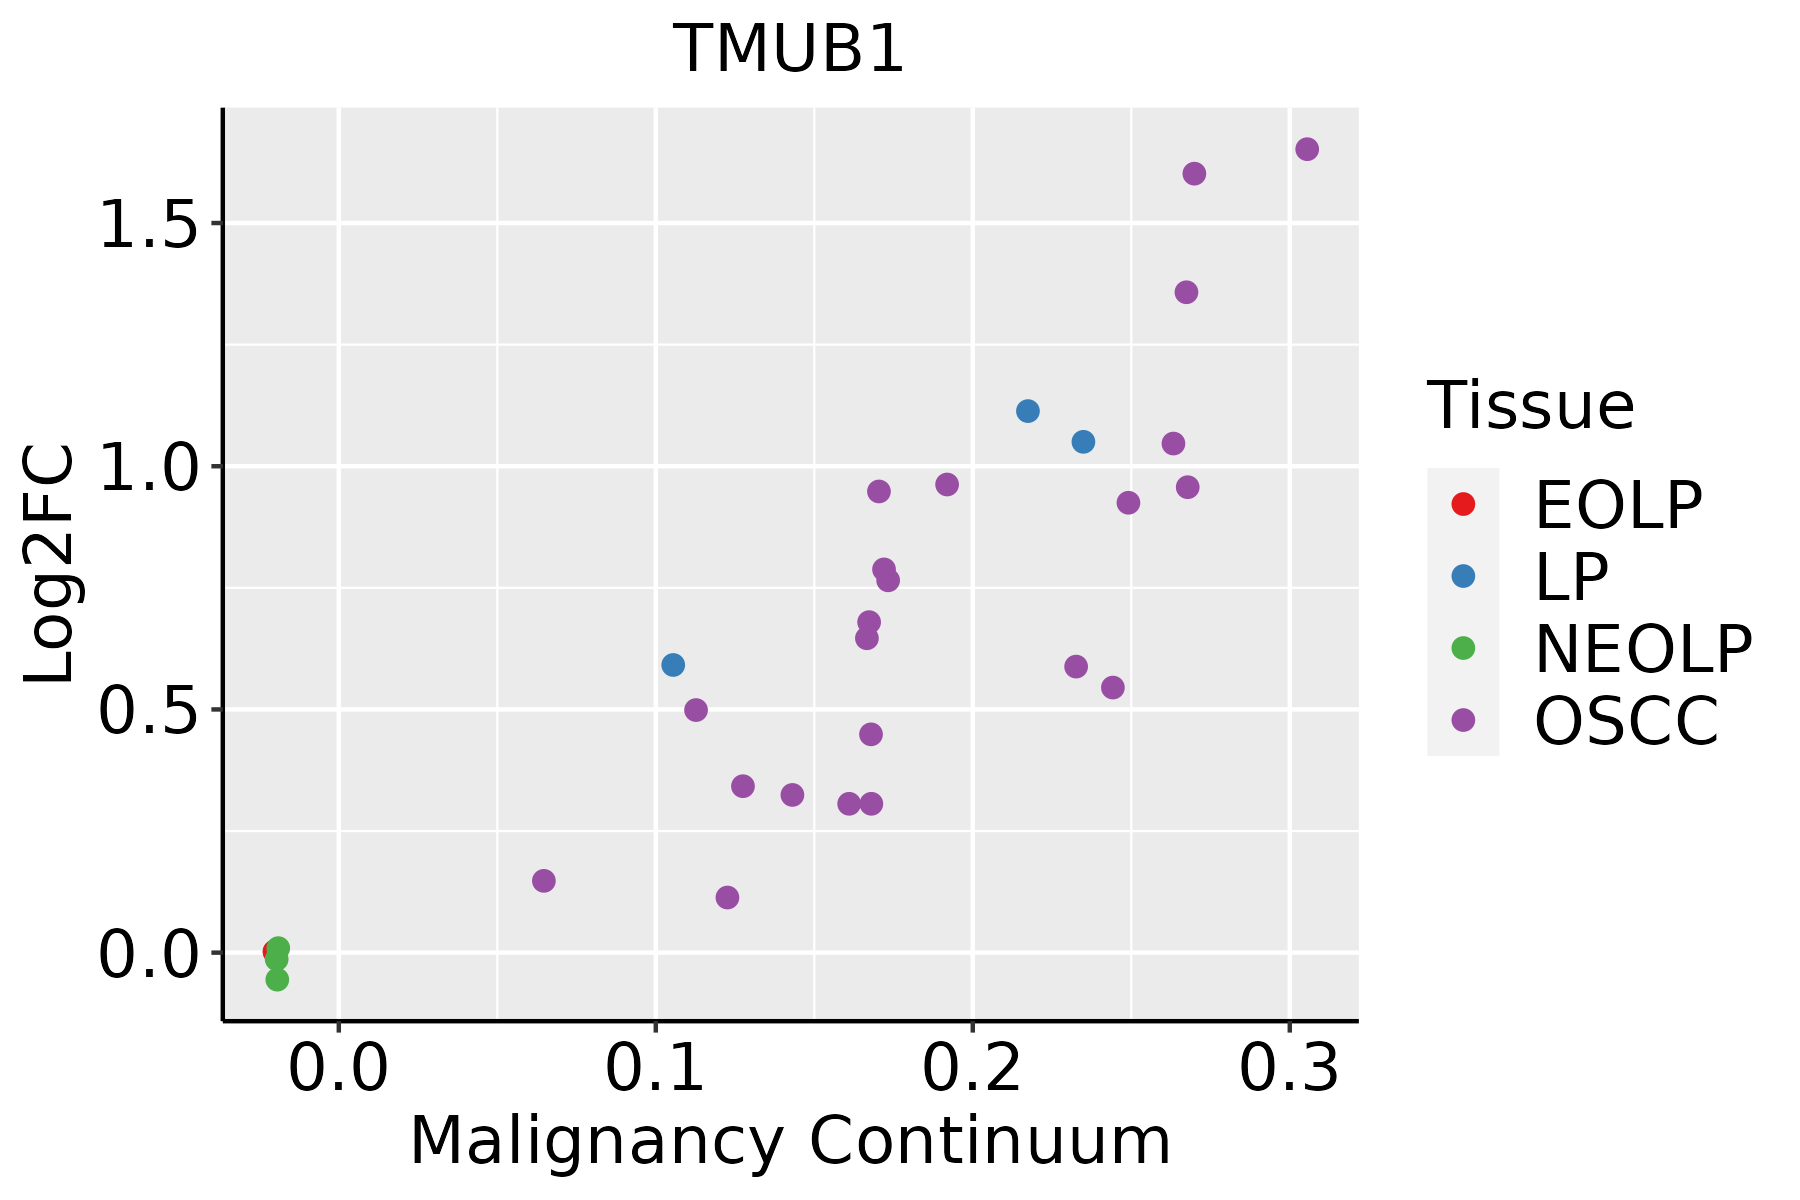 | EOLP: Erosive Oral lichen planus |
| LP: leukoplakia | ||
| NEOLP: Non-erosive oral lichen planus | ||
| OSCC: Oral squamous cell carcinoma | ||
| Skin | 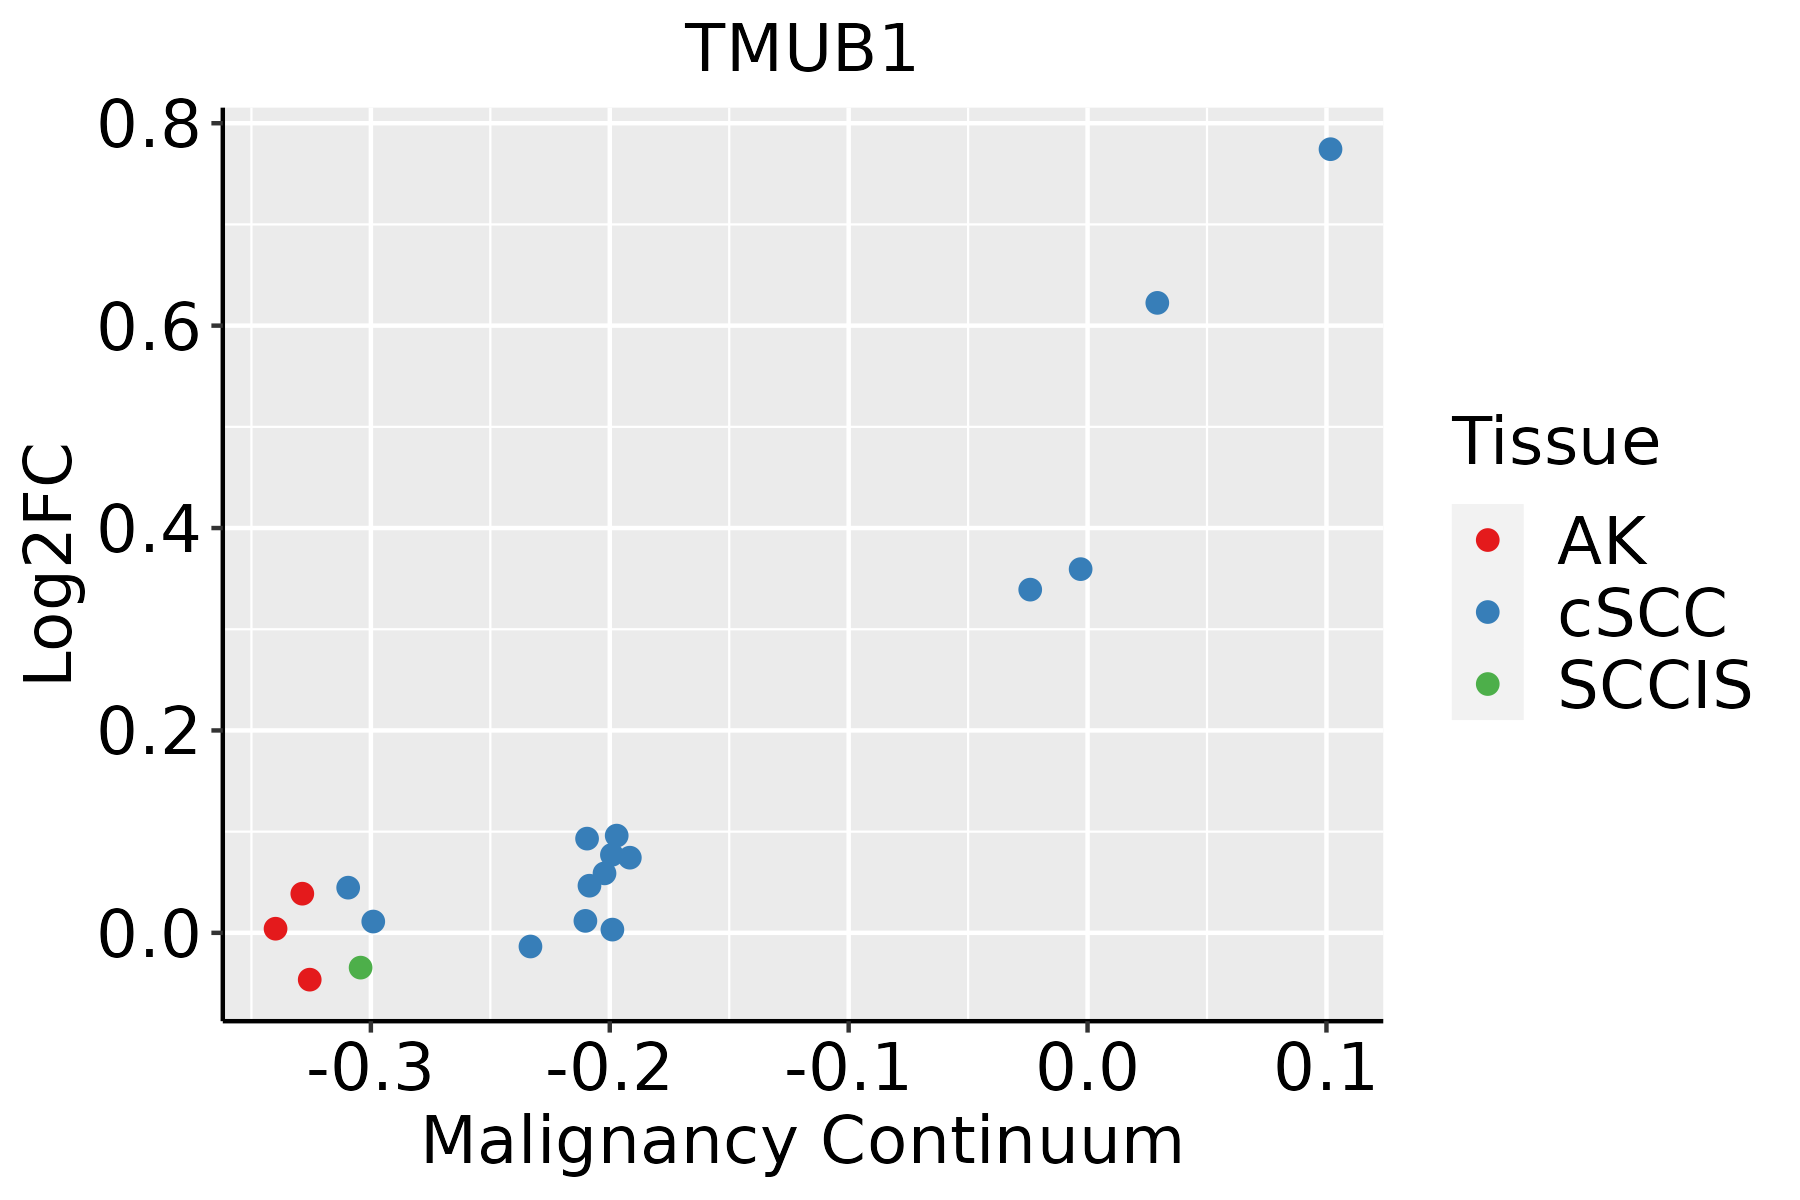 | AK: Actinic keratosis |
| cSCC: Cutaneous squamous cell carcinoma | ||
| SCCIS:squamous cell carcinoma in situ | ||
| Thyroid | 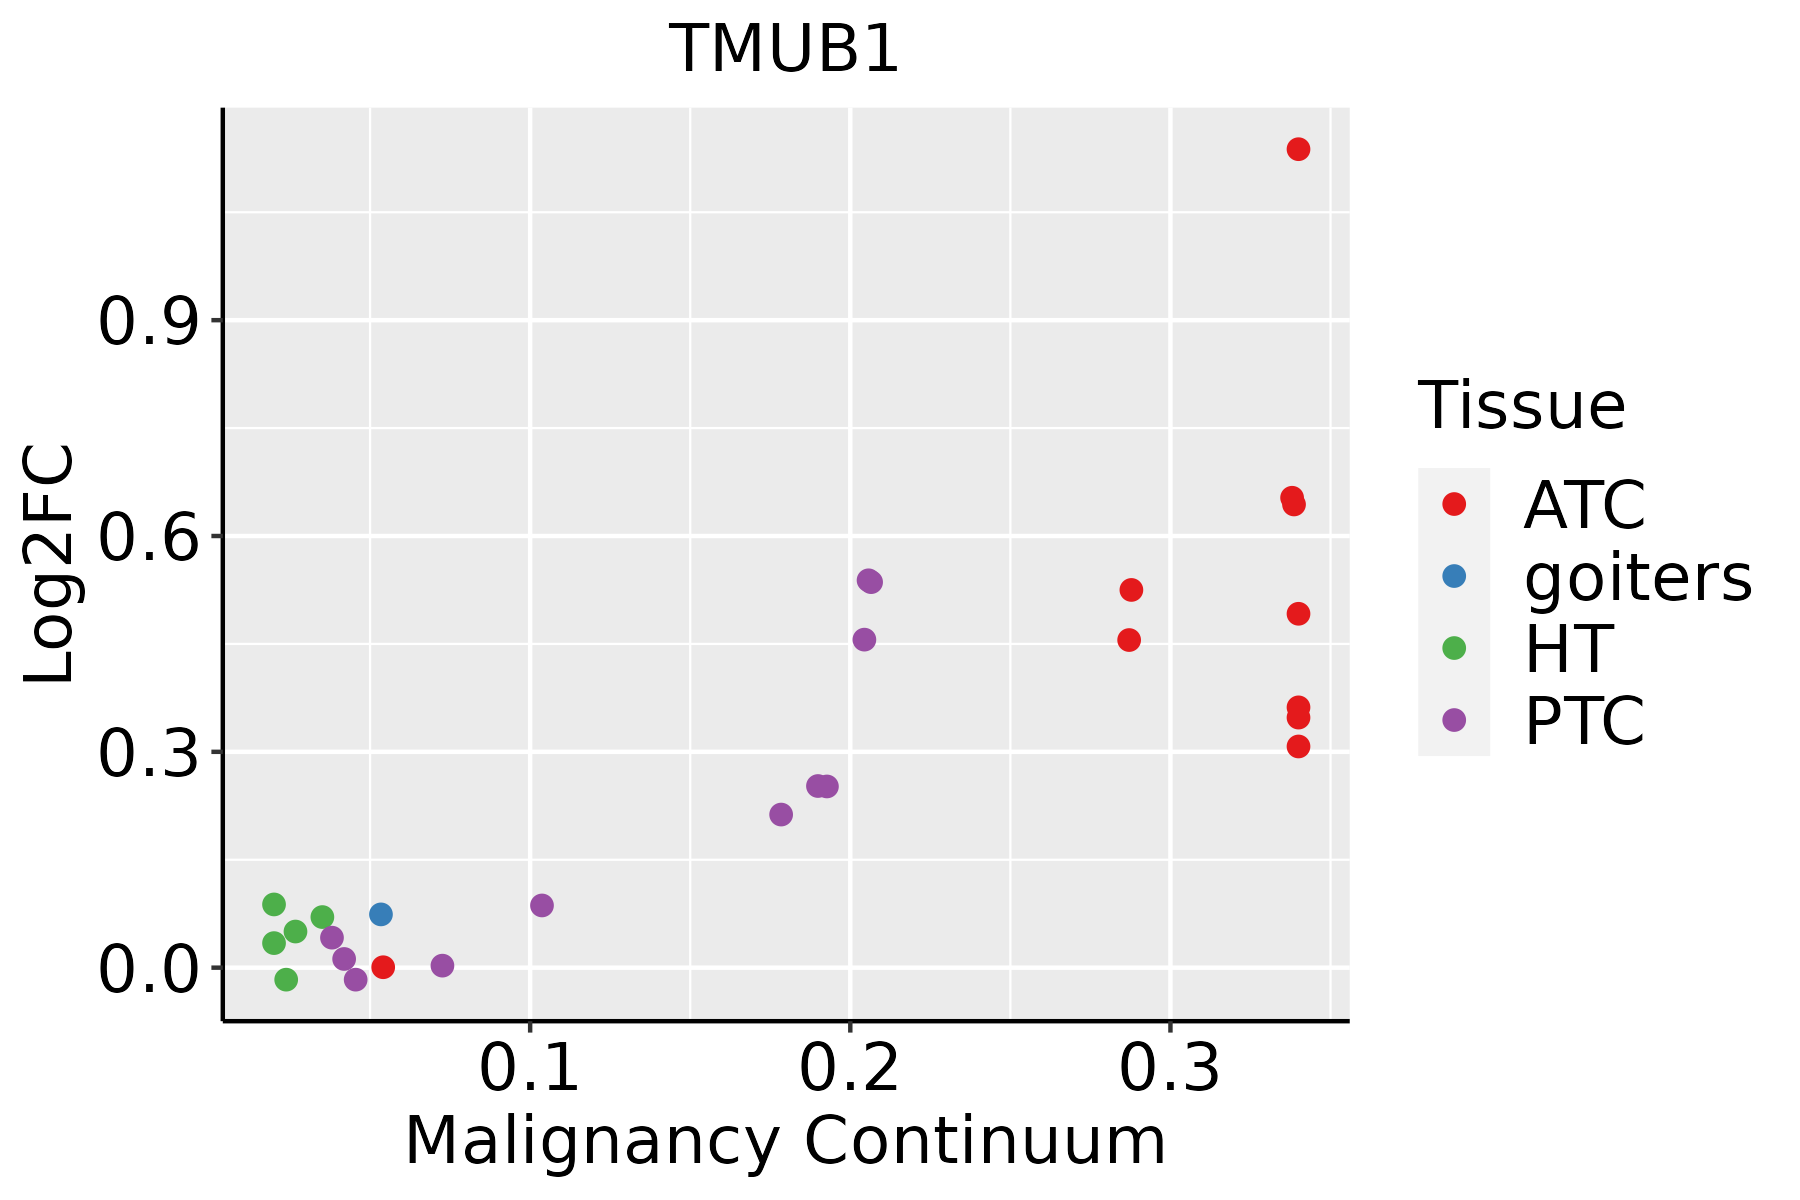 | ATC: Anaplastic thyroid cancer |
| HT: Hashimoto's thyroiditis | ||
| PTC: Papillary thyroid cancer |
| ∗log2FC in expression of this searched gene in stem-like cells from each diseased tissue sample relative to stem-like cells in normal samples in each tissue plotted against the malignancy continuum. Samples are colored based on if they are from different disease stage. |
Top |
Malignant transformation related pathway analysis |
| Find out the enriched GO biological processes and KEGG pathways involved in transition from healthy to precancer to cancer |
| Tissue | Disease Stage | Enriched GO biological Processes |
| Colorectum | AD |  |
| Colorectum | SER |  |
| Colorectum | MSS |  |
| Colorectum | MSI-H |  |
| Colorectum | FAP |  |
| ∗Top 15 enriched GO BP terms are showed in the bar plot of each disease state in each tissue. Each row represents a significant GO biological process which is colored according to the -log10(p.adjust). |
| Page: 1 2 3 4 5 6 7 8 9 |
| GO ID | Tissue | Disease Stage | Description | Gene Ratio | Bg Ratio | pvalue | p.adjust | Count |
| GO:001049826 | Esophagus | HGIN | proteasomal protein catabolic process | 139/2587 | 490/18723 | 1.20e-17 | 3.41e-15 | 139 |
| GO:004316126 | Esophagus | HGIN | proteasome-mediated ubiquitin-dependent protein catabolic process | 114/2587 | 412/18723 | 7.00e-14 | 1.20e-11 | 114 |
| GO:003497625 | Esophagus | HGIN | response to endoplasmic reticulum stress | 81/2587 | 256/18723 | 1.47e-13 | 2.32e-11 | 81 |
| GO:00365036 | Esophagus | HGIN | ERAD pathway | 27/2587 | 107/18723 | 1.15e-03 | 1.39e-02 | 27 |
| GO:00304335 | Esophagus | HGIN | ubiquitin-dependent ERAD pathway | 22/2587 | 85/18723 | 2.24e-03 | 2.31e-02 | 22 |
| GO:0010498111 | Esophagus | ESCC | proteasomal protein catabolic process | 369/8552 | 490/18723 | 1.13e-41 | 1.80e-38 | 369 |
| GO:0043161111 | Esophagus | ESCC | proteasome-mediated ubiquitin-dependent protein catabolic process | 312/8552 | 412/18723 | 3.53e-36 | 4.48e-33 | 312 |
| GO:0034976111 | Esophagus | ESCC | response to endoplasmic reticulum stress | 192/8552 | 256/18723 | 7.15e-22 | 1.30e-19 | 192 |
| GO:003650315 | Esophagus | ESCC | ERAD pathway | 82/8552 | 107/18723 | 5.80e-11 | 1.84e-09 | 82 |
| GO:003043314 | Esophagus | ESCC | ubiquitin-dependent ERAD pathway | 66/8552 | 85/18723 | 1.64e-09 | 3.78e-08 | 66 |
| GO:001049812 | Liver | Cirrhotic | proteasomal protein catabolic process | 216/4634 | 490/18723 | 2.52e-21 | 9.29e-19 | 216 |
| GO:00349767 | Liver | Cirrhotic | response to endoplasmic reticulum stress | 130/4634 | 256/18723 | 1.72e-19 | 3.86e-17 | 130 |
| GO:004316112 | Liver | Cirrhotic | proteasome-mediated ubiquitin-dependent protein catabolic process | 184/4634 | 412/18723 | 4.52e-19 | 8.85e-17 | 184 |
| GO:0030433 | Liver | Cirrhotic | ubiquitin-dependent ERAD pathway | 45/4634 | 85/18723 | 2.19e-08 | 7.75e-07 | 45 |
| GO:00365032 | Liver | Cirrhotic | ERAD pathway | 53/4634 | 107/18723 | 2.58e-08 | 8.89e-07 | 53 |
| GO:001049822 | Liver | HCC | proteasomal protein catabolic process | 351/7958 | 490/18723 | 6.92e-40 | 1.46e-36 | 351 |
| GO:004316122 | Liver | HCC | proteasome-mediated ubiquitin-dependent protein catabolic process | 299/7958 | 412/18723 | 7.82e-36 | 8.27e-33 | 299 |
| GO:003497612 | Liver | HCC | response to endoplasmic reticulum stress | 189/7958 | 256/18723 | 1.43e-24 | 4.06e-22 | 189 |
| GO:003650311 | Liver | HCC | ERAD pathway | 88/7958 | 107/18723 | 2.87e-17 | 2.85e-15 | 88 |
| GO:00304331 | Liver | HCC | ubiquitin-dependent ERAD pathway | 72/7958 | 85/18723 | 9.78e-16 | 7.47e-14 | 72 |
| Page: 1 2 3 |
| Pathway ID | Tissue | Disease Stage | Description | Gene Ratio | Bg Ratio | pvalue | p.adjust | qvalue | Count |
| Page: 1 |
Top |
Cell-cell communication analysis |
| Identification of potential cell-cell interactions between two cell types and their ligand-receptor pairs for different disease states |
| Ligand | Receptor | LRpair | Pathway | Tissue | Disease Stage |
| Page: 1 |
Top |
Single-cell gene regulatory network inference analysis |
| Find out the significant the regulons (TFs) and the target genes of each regulon across cell types for different disease states |
| TF | Cell Type | Tissue | Disease Stage | Target Gene | RSS | Regulon Activity |
| ∗The dot plots of a searched regulon are shown for all cell subpopulations in each disease state of each tissue based on the regulon specific score inferred using pySCENIC and by calculating the average expression. |
| Page: 1 |
Top |
Somatic mutation of malignant transformation related genes |
| Annotation of somatic variants for genes involved in malignant transformation |
| Hugo Symbol | Variant Class | Variant Classification | dbSNP RS | HGVSc | HGVSp | HGVSp Short | SWISSPROT | BIOTYPE | SIFT | PolyPhen | Tumor Sample Barcode | Tissue | Histology | Sex | Age | Stage | Therapy Types | Drugs | Outcome |
| TMUB1 | SNV | Missense_Mutation | novel | c.728T>C | p.Met243Thr | p.M243T | Q9BVT8 | protein_coding | tolerated(0.08) | benign(0.009) | TCGA-AA-3947-01 | Colorectum | colon adenocarcinoma | Female | <65 | I/II | Unknown | Unknown | SD |
| TMUB1 | SNV | Missense_Mutation | novel | c.548N>T | p.Pro183Leu | p.P183L | Q9BVT8 | protein_coding | deleterious(0.02) | possibly_damaging(0.551) | TCGA-A5-A2K7-01 | Endometrium | uterine corpus endometrioid carcinoma | Female | <65 | I/II | Chemotherapy | taxol | SD |
| TMUB1 | SNV | Missense_Mutation | novel | c.734N>A | p.Arg245His | p.R245H | Q9BVT8 | protein_coding | tolerated(0.13) | benign(0.015) | TCGA-B5-A0JU-01 | Endometrium | uterine corpus endometrioid carcinoma | Female | <65 | I/II | Unknown | Unknown | SD |
| TMUB1 | SNV | Missense_Mutation | novel | c.278C>T | p.Pro93Leu | p.P93L | Q9BVT8 | protein_coding | deleterious(0.02) | benign(0.005) | TCGA-B5-A3FC-01 | Endometrium | uterine corpus endometrioid carcinoma | Female | <65 | I/II | Unknown | Unknown | SD |
| TMUB1 | SNV | Missense_Mutation | novel | c.92C>T | p.Thr31Met | p.T31M | Q9BVT8 | protein_coding | deleterious(0) | benign(0.253) | TCGA-B5-A3FC-01 | Endometrium | uterine corpus endometrioid carcinoma | Female | <65 | I/II | Unknown | Unknown | SD |
| TMUB1 | SNV | Missense_Mutation | novel | c.634N>C | p.Tyr212His | p.Y212H | Q9BVT8 | protein_coding | deleterious(0) | probably_damaging(0.946) | TCGA-DI-A1BU-01 | Endometrium | uterine corpus endometrioid carcinoma | Female | <65 | I/II | Chemotherapy | paclitaxel | SD |
| TMUB1 | SNV | Missense_Mutation | novel | c.407N>C | p.Arg136Pro | p.R136P | Q9BVT8 | protein_coding | deleterious(0) | possibly_damaging(0.7) | TCGA-DD-AADI-01 | Liver | liver hepatocellular carcinoma | Female | <65 | I/II | Unknown | Unknown | SD |
| TMUB1 | SNV | Missense_Mutation | novel | c.422G>T | p.Arg141Leu | p.R141L | Q9BVT8 | protein_coding | deleterious(0.01) | probably_damaging(0.999) | TCGA-DD-AAEB-01 | Liver | liver hepatocellular carcinoma | Male | <65 | I/II | Unknown | Unknown | SD |
| TMUB1 | SNV | Missense_Mutation | c.85N>T | p.Val29Phe | p.V29F | Q9BVT8 | protein_coding | deleterious(0.02) | benign(0.125) | TCGA-05-4382-01 | Lung | lung adenocarcinoma | Male | >=65 | I/II | Unknown | Unknown | PD | |
| TMUB1 | SNV | Missense_Mutation | novel | c.190N>A | p.Gly64Arg | p.G64R | Q9BVT8 | protein_coding | tolerated(0.07) | benign(0) | TCGA-95-7562-01 | Lung | lung adenocarcinoma | Male | >=65 | I/II | Chemotherapy | cisplatin | SD |
| Page: 1 2 |
Top |
Related drugs of malignant transformation related genes |
| Identification of chemicals and drugs interact with genes involved in malignant transfromation |
| (DGIdb 4.0) |
| Entrez ID | Symbol | Category | Interaction Types | Drug Claim Name | Drug Name | PMIDs |
| Page: 1 |

Copyright 2023-Present -The University of Texas Health Science Center at Houston |