
|
|||||
|
 | |
| |
| |
| |
| |
| |
|
Gene: TMTC4 |
Gene summary for TMTC4 |
| Gene information | Species | Human | Gene symbol | TMTC4 | Gene ID | 84899 |
| Gene name | transmembrane O-mannosyltransferase targeting cadherins 4 | |
| Gene Alias | TMTC4 | |
| Cytomap | 13q32.3 | |
| Gene Type | protein-coding | GO ID | GO:0003008 | UniProtAcc | Q5T4D3 |
Top |
Malignant transformation analysis |
| Identification of the aberrant gene expression in precancerous and cancerous lesions by comparing the gene expression of stem-like cells in diseased tissues with normal stem cells |
| Entrez ID | Symbol | Replicates | Species | Organ | Tissue | Adj P-value | Log2FC | Malignancy |
| 84899 | TMTC4 | HTA11_99999965104_69814 | Human | Colorectum | MSS | 2.12e-11 | 6.85e-01 | 0.281 |
| 84899 | TMTC4 | HTA11_99999971662_82457 | Human | Colorectum | MSS | 2.67e-13 | 6.58e-01 | 0.3859 |
| 84899 | TMTC4 | A015-C-203 | Human | Colorectum | FAP | 3.93e-09 | -2.52e-01 | -0.1294 |
| 84899 | TMTC4 | A001-C-108 | Human | Colorectum | FAP | 7.05e-05 | -2.15e-01 | -0.0272 |
| 84899 | TMTC4 | A002-C-205 | Human | Colorectum | FAP | 8.08e-04 | -2.13e-01 | -0.1236 |
| 84899 | TMTC4 | A002-C-114 | Human | Colorectum | FAP | 3.18e-03 | -2.10e-01 | -0.1561 |
| 84899 | TMTC4 | A015-C-104 | Human | Colorectum | FAP | 2.63e-10 | -2.49e-01 | -0.1899 |
| 84899 | TMTC4 | A001-C-014 | Human | Colorectum | FAP | 2.27e-03 | -1.97e-01 | 0.0135 |
| 84899 | TMTC4 | A002-C-016 | Human | Colorectum | FAP | 1.38e-06 | -2.03e-01 | 0.0521 |
| 84899 | TMTC4 | A002-C-116 | Human | Colorectum | FAP | 3.09e-09 | -2.47e-01 | -0.0452 |
| 84899 | TMTC4 | A018-E-020 | Human | Colorectum | FAP | 4.70e-03 | -1.93e-01 | -0.2034 |
| 84899 | TMTC4 | F034 | Human | Colorectum | FAP | 2.39e-04 | -1.63e-01 | -0.0665 |
| 84899 | TMTC4 | CRC-3-11773 | Human | Colorectum | CRC | 6.85e-03 | -2.07e-01 | 0.2564 |
| 84899 | TMTC4 | LZE4T | Human | Esophagus | ESCC | 4.02e-04 | 1.52e-01 | 0.0811 |
| 84899 | TMTC4 | LZE7T | Human | Esophagus | ESCC | 9.80e-04 | 2.80e-01 | 0.0667 |
| 84899 | TMTC4 | LZE8T | Human | Esophagus | ESCC | 8.52e-05 | 1.23e-01 | 0.067 |
| 84899 | TMTC4 | LZE22T | Human | Esophagus | ESCC | 3.82e-02 | 1.72e-01 | 0.068 |
| 84899 | TMTC4 | LZE24T | Human | Esophagus | ESCC | 2.45e-05 | 1.43e-01 | 0.0596 |
| 84899 | TMTC4 | P1T-E | Human | Esophagus | ESCC | 5.33e-08 | 3.61e-01 | 0.0875 |
| 84899 | TMTC4 | P2T-E | Human | Esophagus | ESCC | 5.64e-08 | 1.65e-01 | 0.1177 |
| Page: 1 2 3 4 |
| Tissue | Expression Dynamics | Abbreviation |
| Colorectum (GSE201348) |  | FAP: Familial adenomatous polyposis |
| CRC: Colorectal cancer | ||
| Colorectum (HTA11) |  | AD: Adenomas |
| SER: Sessile serrated lesions | ||
| MSI-H: Microsatellite-high colorectal cancer | ||
| MSS: Microsatellite stable colorectal cancer | ||
| Esophagus | 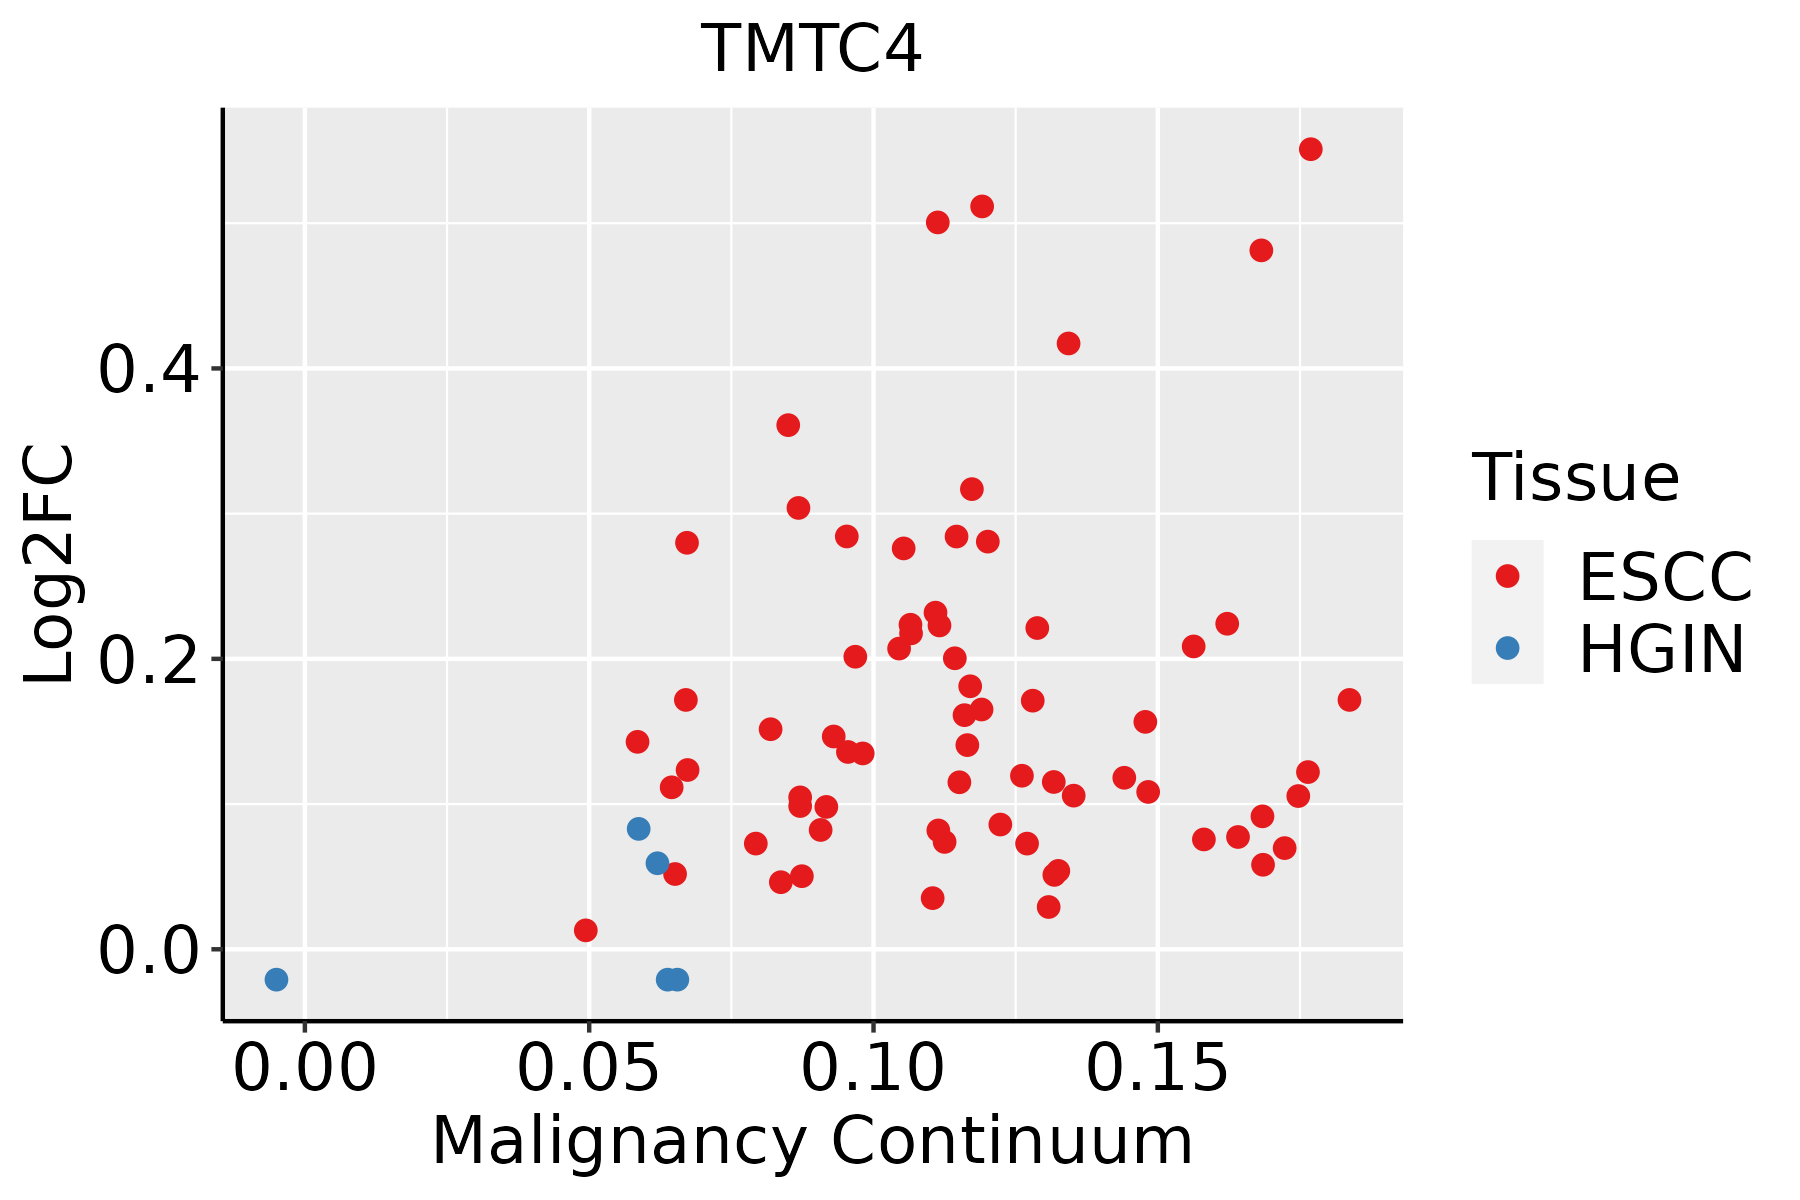 | ESCC: Esophageal squamous cell carcinoma |
| HGIN: High-grade intraepithelial neoplasias | ||
| LGIN: Low-grade intraepithelial neoplasias |
| ∗log2FC in expression of this searched gene in stem-like cells from each diseased tissue sample relative to stem-like cells in normal samples in each tissue plotted against the malignancy continuum. Samples are colored based on if they are from different disease stage. |
Top |
Malignant transformation related pathway analysis |
| Find out the enriched GO biological processes and KEGG pathways involved in transition from healthy to precancer to cancer |
| Tissue | Disease Stage | Enriched GO biological Processes |
| Colorectum | AD |  |
| Colorectum | SER |  |
| Colorectum | MSS |  |
| Colorectum | MSI-H |  |
| Colorectum | FAP |  |
| ∗Top 15 enriched GO BP terms are showed in the bar plot of each disease state in each tissue. Each row represents a significant GO biological process which is colored according to the -log10(p.adjust). |
| Page: 1 2 3 4 5 6 7 8 9 |
| GO ID | Tissue | Disease Stage | Description | Gene Ratio | Bg Ratio | pvalue | p.adjust | Count |
| GO:00349762 | Colorectum | MSS | response to endoplasmic reticulum stress | 81/3467 | 256/18723 | 2.65e-07 | 1.10e-05 | 81 |
| GO:00324692 | Colorectum | MSS | endoplasmic reticulum calcium ion homeostasis | 16/3467 | 25/18723 | 6.86e-07 | 2.48e-05 | 16 |
| GO:00359672 | Colorectum | MSS | cellular response to topologically incorrect protein | 42/3467 | 116/18723 | 4.99e-06 | 1.38e-04 | 42 |
| GO:00359662 | Colorectum | MSS | response to topologically incorrect protein | 53/3467 | 159/18723 | 5.50e-06 | 1.49e-04 | 53 |
| GO:00709972 | Colorectum | MSS | neuron death | 97/3467 | 361/18723 | 5.21e-05 | 9.31e-04 | 97 |
| GO:00069862 | Colorectum | MSS | response to unfolded protein | 44/3467 | 137/18723 | 8.99e-05 | 1.43e-03 | 44 |
| GO:00346202 | Colorectum | MSS | cellular response to unfolded protein | 33/3467 | 96/18723 | 1.58e-04 | 2.28e-03 | 33 |
| GO:00514022 | Colorectum | MSS | neuron apoptotic process | 66/3467 | 246/18723 | 7.94e-04 | 8.36e-03 | 66 |
| GO:00709974 | Colorectum | FAP | neuron death | 81/2622 | 361/18723 | 8.35e-06 | 2.46e-04 | 81 |
| GO:00349764 | Colorectum | FAP | response to endoplasmic reticulum stress | 61/2622 | 256/18723 | 1.58e-05 | 4.10e-04 | 61 |
| GO:00514024 | Colorectum | FAP | neuron apoptotic process | 55/2622 | 246/18723 | 2.42e-04 | 3.37e-03 | 55 |
| GO:00324693 | Colorectum | FAP | endoplasmic reticulum calcium ion homeostasis | 10/2622 | 25/18723 | 1.24e-03 | 1.16e-02 | 10 |
| GO:00064861 | Colorectum | FAP | protein glycosylation | 48/2622 | 226/18723 | 1.85e-03 | 1.57e-02 | 48 |
| GO:00434131 | Colorectum | FAP | macromolecule glycosylation | 48/2622 | 226/18723 | 1.85e-03 | 1.57e-02 | 48 |
| GO:00700851 | Colorectum | FAP | glycosylation | 50/2622 | 240/18723 | 2.30e-03 | 1.85e-02 | 50 |
| GO:0009101 | Colorectum | FAP | glycoprotein biosynthetic process | 63/2622 | 317/18723 | 2.31e-03 | 1.86e-02 | 63 |
| GO:00709975 | Colorectum | CRC | neuron death | 65/2078 | 361/18723 | 5.55e-05 | 1.26e-03 | 65 |
| GO:00514025 | Colorectum | CRC | neuron apoptotic process | 45/2078 | 246/18723 | 5.12e-04 | 7.21e-03 | 45 |
| GO:00324694 | Colorectum | CRC | endoplasmic reticulum calcium ion homeostasis | 9/2078 | 25/18723 | 9.76e-04 | 1.17e-02 | 9 |
| GO:0034976111 | Esophagus | ESCC | response to endoplasmic reticulum stress | 192/8552 | 256/18723 | 7.15e-22 | 1.30e-19 | 192 |
| Page: 1 2 |
| Pathway ID | Tissue | Disease Stage | Description | Gene Ratio | Bg Ratio | pvalue | p.adjust | qvalue | Count |
| Page: 1 |
Top |
Cell-cell communication analysis |
| Identification of potential cell-cell interactions between two cell types and their ligand-receptor pairs for different disease states |
| Ligand | Receptor | LRpair | Pathway | Tissue | Disease Stage |
| Page: 1 |
Top |
Single-cell gene regulatory network inference analysis |
| Find out the significant the regulons (TFs) and the target genes of each regulon across cell types for different disease states |
| TF | Cell Type | Tissue | Disease Stage | Target Gene | RSS | Regulon Activity |
| ∗The dot plots of a searched regulon are shown for all cell subpopulations in each disease state of each tissue based on the regulon specific score inferred using pySCENIC and by calculating the average expression. |
| Page: 1 |
Top |
Somatic mutation of malignant transformation related genes |
| Annotation of somatic variants for genes involved in malignant transformation |
| Hugo Symbol | Variant Class | Variant Classification | dbSNP RS | HGVSc | HGVSp | HGVSp Short | SWISSPROT | BIOTYPE | SIFT | PolyPhen | Tumor Sample Barcode | Tissue | Histology | Sex | Age | Stage | Therapy Types | Drugs | Outcome |
| TMTC4 | SNV | Missense_Mutation | novel | c.1081N>A | p.Gly361Ser | p.G361S | Q5T4D3 | protein_coding | deleterious(0) | probably_damaging(0.996) | TCGA-A7-A4SA-01 | Breast | breast invasive carcinoma | Female | <65 | I/II | Chemotherapy | doxorubicin | CR |
| TMTC4 | SNV | Missense_Mutation | novel | c.835N>C | p.Asn279His | p.N279H | Q5T4D3 | protein_coding | tolerated(0.2) | benign(0.136) | TCGA-A8-A08H-01 | Breast | breast invasive carcinoma | Female | >=65 | I/II | Unknown | Unknown | SD |
| TMTC4 | SNV | Missense_Mutation | rs779577700 | c.1379N>C | p.Leu460Pro | p.L460P | Q5T4D3 | protein_coding | tolerated(0.12) | benign(0.003) | TCGA-AN-A0FV-01 | Breast | breast invasive carcinoma | Female | <65 | I/II | Unknown | Unknown | SD |
| TMTC4 | SNV | Missense_Mutation | c.838C>T | p.Leu280Phe | p.L280F | Q5T4D3 | protein_coding | tolerated(0.77) | benign(0) | TCGA-AN-A0FW-01 | Breast | breast invasive carcinoma | Female | >=65 | III/IV | Unknown | Unknown | SD | |
| TMTC4 | SNV | Missense_Mutation | rs147952663 | c.1907A>G | p.His636Arg | p.H636R | Q5T4D3 | protein_coding | deleterious(0) | possibly_damaging(0.704) | TCGA-AO-A128-01 | Breast | breast invasive carcinoma | Female | <65 | I/II | Chemotherapy | doxorubicin | SD |
| TMTC4 | SNV | Missense_Mutation | c.1029N>T | p.Leu343Phe | p.L343F | Q5T4D3 | protein_coding | deleterious(0) | benign(0.413) | TCGA-B6-A0I9-01 | Breast | breast invasive carcinoma | Female | <65 | III/IV | Unknown | Unknown | PD | |
| TMTC4 | SNV | Missense_Mutation | rs374396567 | c.1345N>A | p.Gly449Arg | p.G449R | Q5T4D3 | protein_coding | tolerated(0.59) | benign(0.01) | TCGA-BH-A18G-01 | Breast | breast invasive carcinoma | Female | >=65 | I/II | Unknown | Unknown | SD |
| TMTC4 | SNV | Missense_Mutation | c.1541N>C | p.Lys514Thr | p.K514T | Q5T4D3 | protein_coding | tolerated(0.38) | benign(0.014) | TCGA-C8-A12M-01 | Breast | breast invasive carcinoma | Female | >=65 | I/II | Unknown | Unknown | SD | |
| TMTC4 | SNV | Missense_Mutation | c.1565G>A | p.Arg522Lys | p.R522K | Q5T4D3 | protein_coding | tolerated(1) | benign(0) | TCGA-D8-A140-01 | Breast | breast invasive carcinoma | Female | <65 | I/II | Chemotherapy | doxorubicin+cyclophosphamid | SD | |
| TMTC4 | insertion | Frame_Shift_Ins | novel | c.94_95insATTGGCACTGTGCCTACAGTAATGTGAAA | p.Pro32HisfsTer22 | p.P32Hfs*22 | Q5T4D3 | protein_coding | TCGA-A8-A07P-01 | Breast | breast invasive carcinoma | Female | >=65 | I/II | Chemotherapy | 5-fluorouracil | SD |
| Page: 1 2 3 4 5 6 7 8 |
Top |
Related drugs of malignant transformation related genes |
| Identification of chemicals and drugs interact with genes involved in malignant transfromation |
| (DGIdb 4.0) |
| Entrez ID | Symbol | Category | Interaction Types | Drug Claim Name | Drug Name | PMIDs |
| Page: 1 |

Copyright 2023-Present -The University of Texas Health Science Center at Houston |