Schematic overview of the cellular and molecular mechanisms involved in the cancer progression, including the proposed cellular and molecular mechanisms in cancer cells trajectory. AT1: alveolar type 1 cells; AT2: alveolar type 2 cells; AAH: atypical adenomatous hyperplasia; AIS: adenocarcinoma in situ; MIA: minimally invasive adenocarcinoma; IA: invasive adenocarcinoma; EMT: epithelial-mesenchymal transition

Home

Download

Statistics

Help

Contact

Center for Computational Systems Medicine
leaf

Gene summary

leaf

Malignant transformation analysis

leaf

Malignant transformation related pathway analysis

leaf

Cell-cell communication analysis

leaf

Single-cell gene regulatory network inference analysis

leaf

Somatic mutation of malignant transformation related genes

leaf

Related drugs of malignant transformation related genes

Gene: TMTC3

Gene summary for TMTC3

check button Gene summary.

Gene informationSpeciesHuman
Gene symbol

TMTC3

Gene ID

160418

Gene nametransmembrane O-mannosyltransferase targeting cadherins 3
Gene AliasLIS8
Cytomap12q21.32
Gene Typeprotein-coding
GO ID

GO:0006464

UniProtAcc

A8K321


Top

Malignant transformation analysis

check button Identification of the aberrant gene expression in precancerous and cancerous lesions by comparing the gene expression of stem-like cells in diseased tissues with normal stem cells
check button Malignant transformation involving gene list.
Entrez IDSymbolReplicatesSpeciesOrganTissueAdj P-valueLog2FCMalignancy
160418TMTC3LZE2THumanEsophagusESCC3.15e-076.74e-010.082
160418TMTC3LZE4THumanEsophagusESCC7.81e-206.80e-010.0811
160418TMTC3LZE7THumanEsophagusESCC1.04e-045.83e-010.0667
160418TMTC3LZE8THumanEsophagusESCC1.78e-043.42e-010.067
160418TMTC3LZE24THumanEsophagusESCC1.26e-102.47e-010.0596
160418TMTC3P1T-EHumanEsophagusESCC1.46e-033.35e-010.0875
160418TMTC3P2T-EHumanEsophagusESCC1.06e-599.07e-010.1177
160418TMTC3P4T-EHumanEsophagusESCC4.04e-164.55e-010.1323
160418TMTC3P5T-EHumanEsophagusESCC1.59e-102.45e-010.1327
160418TMTC3P8T-EHumanEsophagusESCC4.05e-163.36e-010.0889
160418TMTC3P9T-EHumanEsophagusESCC3.08e-082.08e-010.1131
160418TMTC3P10T-EHumanEsophagusESCC2.89e-284.69e-010.116
160418TMTC3P11T-EHumanEsophagusESCC7.91e-106.74e-010.1426
160418TMTC3P12T-EHumanEsophagusESCC1.90e-183.78e-010.1122
160418TMTC3P15T-EHumanEsophagusESCC9.54e-246.81e-010.1149
160418TMTC3P16T-EHumanEsophagusESCC3.14e-153.27e-010.1153
160418TMTC3P20T-EHumanEsophagusESCC5.28e-253.79e-010.1124
160418TMTC3P21T-EHumanEsophagusESCC3.17e-357.95e-010.1617
160418TMTC3P22T-EHumanEsophagusESCC2.68e-264.98e-010.1236
160418TMTC3P23T-EHumanEsophagusESCC5.51e-236.75e-010.108
Page: 1 2 3 4 5 

check button Transcriptomic changes along malignancy continuum.
TissueExpression DynamicsAbbreviation
EsophagusThe image shows the transcriptomic changes along malignancy continuum.log2FC in expression of this searched gene in stem-like cells from each diseased tissue sample relative to stem-like cells in normal samples in each tissue plotted against the malignancy continuum. Samples are colored based on if they are from different disease stage.
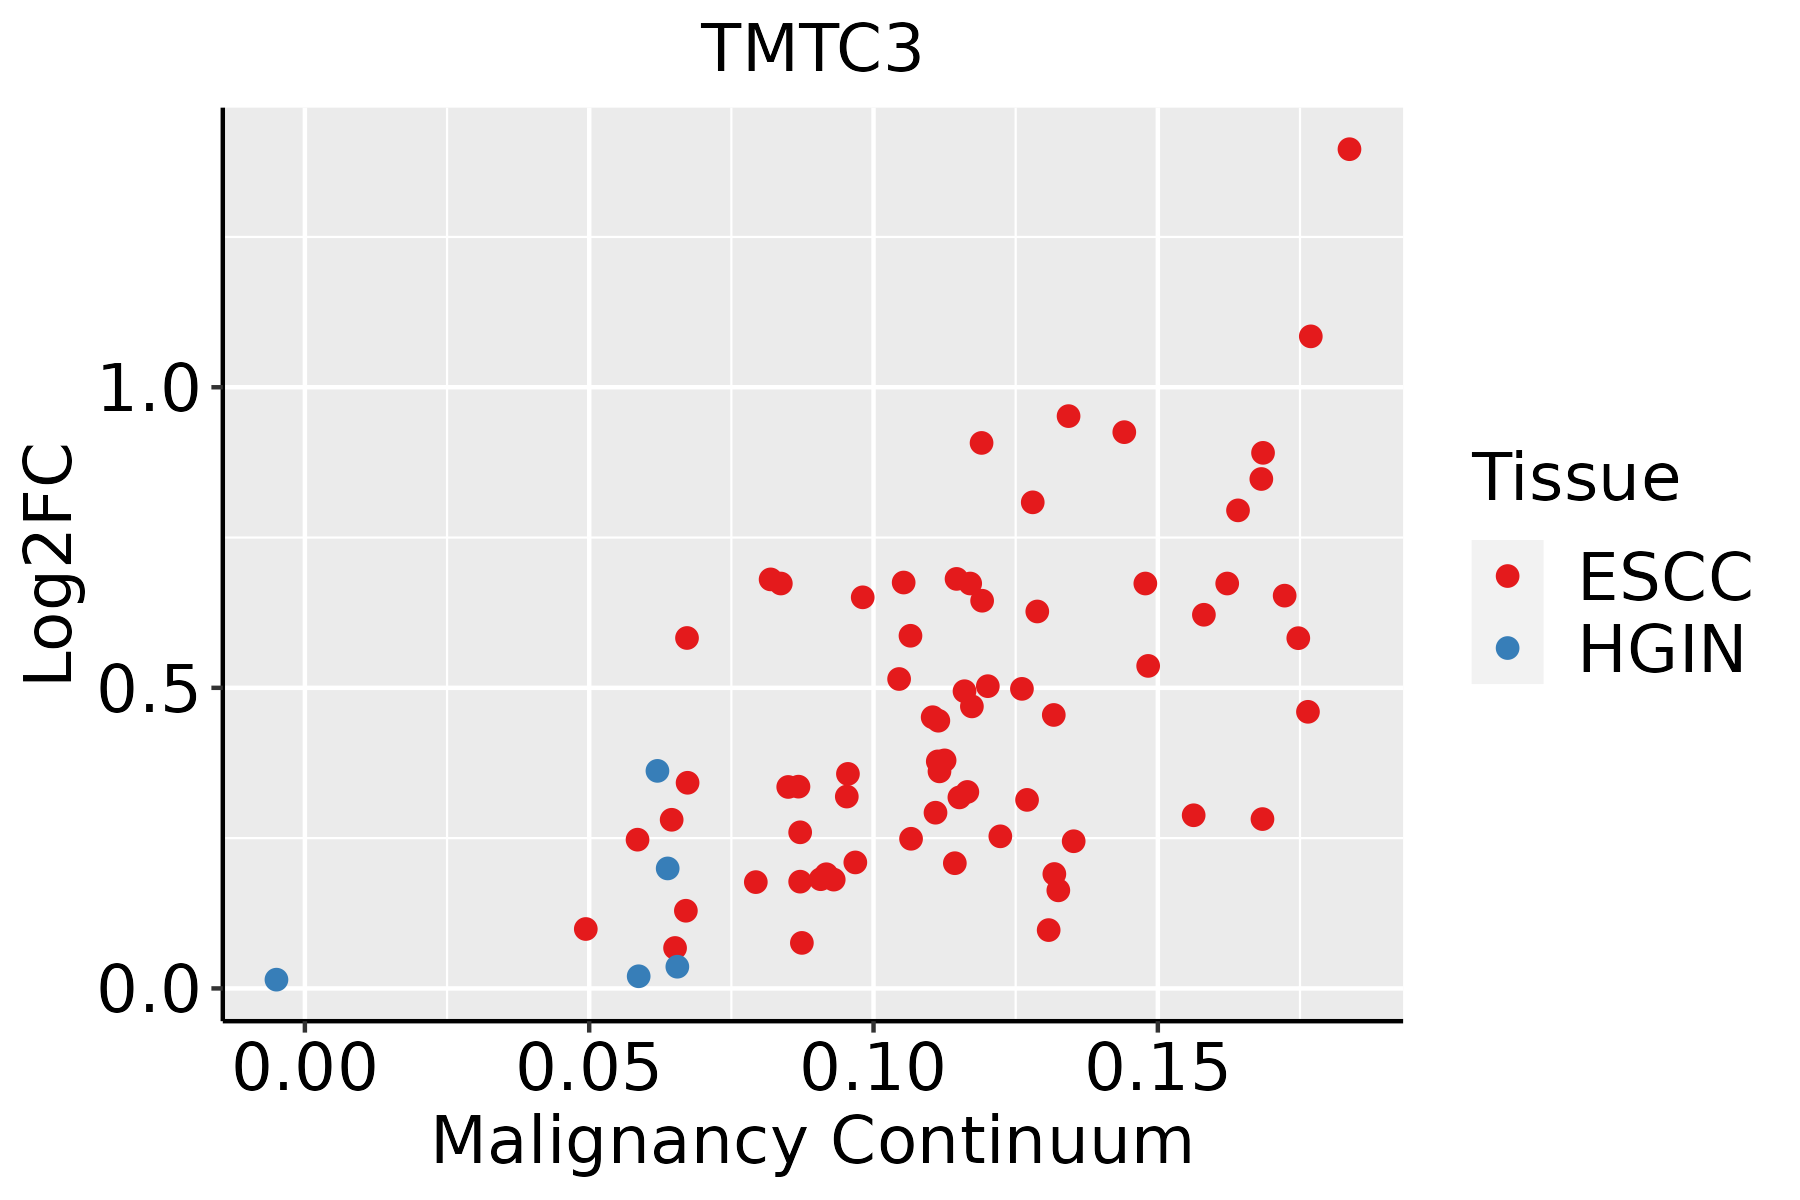
ESCC: Esophageal squamous cell carcinoma
HGIN: High-grade intraepithelial neoplasias
LGIN: Low-grade intraepithelial neoplasias
LiverThe image shows the transcriptomic changes along malignancy continuum.log2FC in expression of this searched gene in stem-like cells from each diseased tissue sample relative to stem-like cells in normal samples in each tissue plotted against the malignancy continuum. Samples are colored based on if they are from different disease stage.
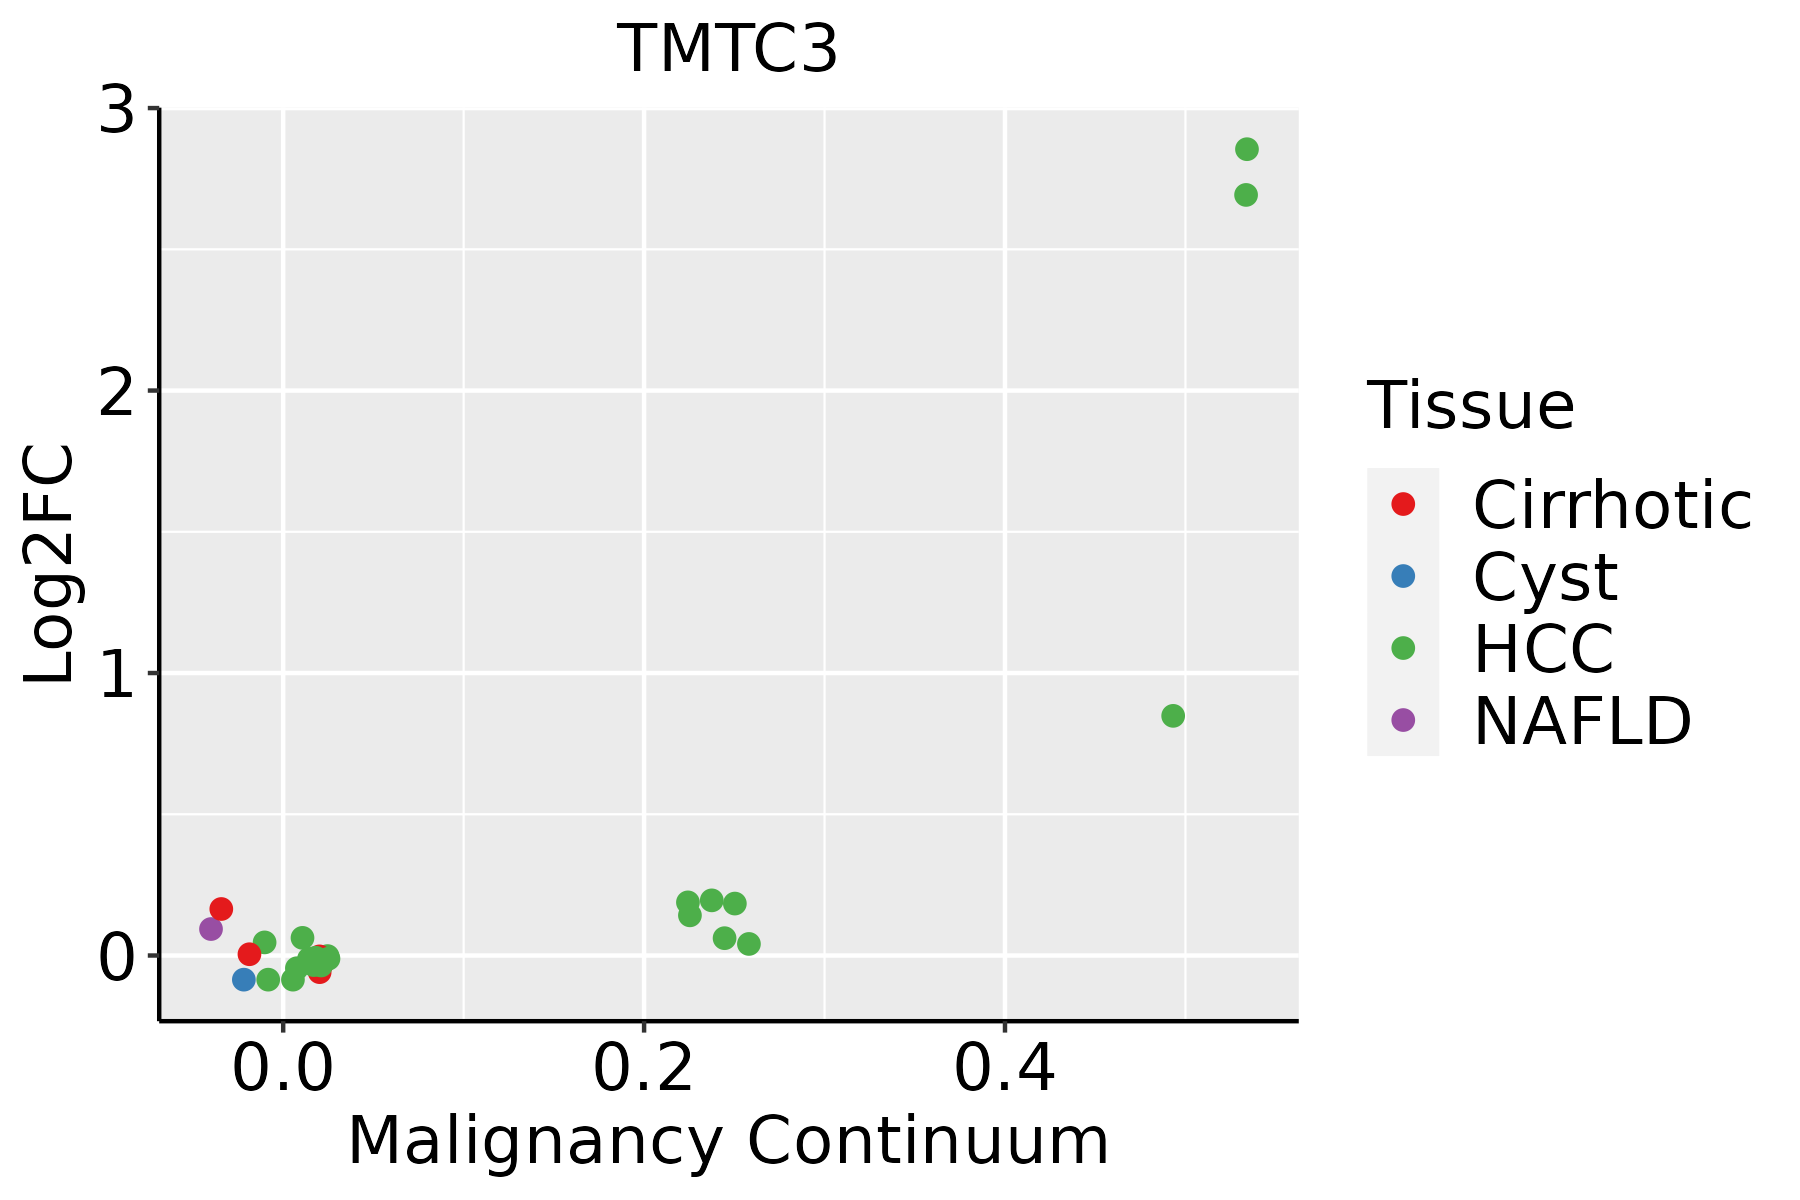
HCC: Hepatocellular carcinoma
NAFLD: Non-alcoholic fatty liver disease
Oral CavityThe image shows the transcriptomic changes along malignancy continuum.log2FC in expression of this searched gene in stem-like cells from each diseased tissue sample relative to stem-like cells in normal samples in each tissue plotted against the malignancy continuum. Samples are colored based on if they are from different disease stage.EOLP: Erosive Oral lichen planus
LP: leukoplakia
NEOLP: Non-erosive oral lichen planus
OSCC: Oral squamous cell carcinoma
SkinThe image shows the transcriptomic changes along malignancy continuum.log2FC in expression of this searched gene in stem-like cells from each diseased tissue sample relative to stem-like cells in normal samples in each tissue plotted against the malignancy continuum. Samples are colored based on if they are from different disease stage.AK: Actinic keratosis
cSCC: Cutaneous squamous cell carcinoma
SCCIS:squamous cell carcinoma in situ
ThyroidThe image shows the transcriptomic changes along malignancy continuum.log2FC in expression of this searched gene in stem-like cells from each diseased tissue sample relative to stem-like cells in normal samples in each tissue plotted against the malignancy continuum. Samples are colored based on if they are from different disease stage.ATC: Anaplastic thyroid cancer
HT: Hashimoto's thyroiditis
PTC: Papillary thyroid cancer
∗log2FC in expression of this searched gene in stem-like cells from each diseased tissue sample relative to stem-like cells in normal samples in each tissue plotted against the malignancy continuum. Samples are colored based on if they are from different disease stage.

Top

Malignant transformation related pathway analysis

check buttonFind out the enriched GO biological processes and KEGG pathways involved in transition from healthy to precancer to cancer
check button Figure of enriched GO biological processes.
TissueDisease StageEnriched GO biological Processes
ColorectumADGO analysis - Figure of enriched GO biological processes: Top 15 enriched GO BP terms are showed in the bar plot of each disease state in each tissue. Each row represents a significant GO biological process which is colored according to the -log10(p.adjust).
ColorectumSERGO analysis - Figure of enriched GO biological processes: Top 15 enriched GO BP terms are showed in the bar plot of each disease state in each tissue. Each row represents a significant GO biological process which is colored according to the -log10(p.adjust).
ColorectumMSSGO analysis - Figure of enriched GO biological processes: Top 15 enriched GO BP terms are showed in the bar plot of each disease state in each tissue. Each row represents a significant GO biological process which is colored according to the -log10(p.adjust).
ColorectumMSI-HGO analysis - Figure of enriched GO biological processes: Top 15 enriched GO BP terms are showed in the bar plot of each disease state in each tissue. Each row represents a significant GO biological process which is colored according to the -log10(p.adjust).
ColorectumFAPGO analysis - Figure of enriched GO biological processes: Top 15 enriched GO BP terms are showed in the bar plot of each disease state in each tissue. Each row represents a significant GO biological process which is colored according to the -log10(p.adjust).
∗Top 15 enriched GO BP terms are showed in the bar plot of each disease state in each tissue. Each row represents a significant GO biological process which is colored according to the -log10(p.adjust).
Page: 1 2 3 4 5 6 7 8 9 

check button Enriched GO biological processes.
GO IDTissueDisease StageDescriptionGene RatioBg Ratiopvaluep.adjustCount
GO:0010498111EsophagusESCCproteasomal protein catabolic process369/8552490/187231.13e-411.80e-38369
GO:0042176111EsophagusESCCregulation of protein catabolic process280/8552391/187238.65e-262.39e-23280
GO:0009896111EsophagusESCCpositive regulation of catabolic process332/8552492/187234.36e-239.22e-21332
GO:0034976111EsophagusESCCresponse to endoplasmic reticulum stress192/8552256/187237.15e-221.30e-19192
GO:0031331111EsophagusESCCpositive regulation of cellular catabolic process292/8552427/187238.67e-221.53e-19292
GO:1903362111EsophagusESCCregulation of cellular protein catabolic process188/8552255/187235.12e-206.62e-18188
GO:0045862111EsophagusESCCpositive regulation of proteolysis256/8552372/187237.88e-209.43e-18256
GO:1903050111EsophagusESCCregulation of proteolysis involved in cellular protein catabolic process163/8552221/187231.44e-171.27e-15163
GO:0061136111EsophagusESCCregulation of proteasomal protein catabolic process142/8552187/187232.40e-172.00e-15142
GO:0045732111EsophagusESCCpositive regulation of protein catabolic process167/8552231/187231.47e-161.14e-14167
GO:1903364111EsophagusESCCpositive regulation of cellular protein catabolic process117/8552155/187233.25e-141.66e-12117
GO:1901800110EsophagusESCCpositive regulation of proteasomal protein catabolic process91/8552114/187236.74e-143.34e-1291
GO:1903052110EsophagusESCCpositive regulation of proteolysis involved in cellular protein catabolic process101/8552133/187239.58e-134.19e-11101
GO:00091002EsophagusESCCglycoprotein metabolic process226/8552387/187232.64e-073.94e-06226
GO:00700854EsophagusESCCglycosylation144/8552240/187235.12e-065.38e-05144
GO:00064865EsophagusESCCprotein glycosylation135/8552226/187231.36e-051.24e-04135
GO:00434135EsophagusESCCmacromolecule glycosylation135/8552226/187231.36e-051.24e-04135
GO:00091012EsophagusESCCglycoprotein biosynthetic process181/8552317/187232.54e-052.15e-04181
GO:00064931EsophagusESCCprotein O-linked glycosylation51/855286/187237.54e-032.70e-0251
GO:001049822LiverHCCproteasomal protein catabolic process351/7958490/187236.92e-401.46e-36351
Page: 1 2 3 4 5 6 7 

check button Enriched KEGG pathways.
Pathway IDTissueDisease StageDescriptionGene RatioBg Ratiopvaluep.adjustqvalueCount
Page: 1 

Top

Cell-cell communication analysis

check buttonIdentification of potential cell-cell interactions between two cell types and their ligand-receptor pairs for different disease states
LigandReceptorLRpairPathwayTissueDisease Stage
Page: 1 

Top

Single-cell gene regulatory network inference analysis

check buttonFind out the significant the regulons (TFs) and the target genes of each regulon across cell types for different disease states
TFCell TypeTissueDisease StageTarget GeneRSSRegulon Activity
∗The dot plots of a searched regulon are shown for all cell subpopulations in each disease state of each tissue based on the regulon specific score inferred using pySCENIC and by calculating the average expression.
Page: 1 

Top

Somatic mutation of malignant transformation related genes

check buttonAnnotation of somatic variants for genes involved in malignant transformation
Hugo SymbolVariant ClassVariant ClassificationdbSNP RSHGVScHGVSpHGVSp ShortSWISSPROTBIOTYPESIFTPolyPhenTumor Sample BarcodeTissueHistologySexAgeStageTherapy TypesDrugsOutcome
TMTC3SNVMissense_Mutationc.1492N>Cp.Glu498Glnp.E498QQ6ZXV5protein_codingtolerated(0.09)possibly_damaging(0.785)TCGA-AC-A23H-01Breastbreast invasive carcinomaFemale>=65I/IIUnknownUnknownPD
TMTC3SNVMissense_Mutationnovelc.2245N>Ap.Gln749Lysp.Q749KQ6ZXV5protein_codingtolerated(0.73)benign(0.007)TCGA-AN-A046-01Breastbreast invasive carcinomaFemale>=65I/IIUnknownUnknownSD
TMTC3SNVMissense_Mutationc.2668A>Gp.Ile890Valp.I890VQ6ZXV5protein_codingtolerated_low_confidence(0.08)benign(0.028)TCGA-B6-A0IB-01Breastbreast invasive carcinomaFemale<65III/IVUnknownUnknownPD
TMTC3SNVMissense_Mutationnovelc.1042N>Cp.Val348Leup.V348LQ6ZXV5protein_codingtolerated(0.49)benign(0.046)TCGA-EW-A6SB-01Breastbreast invasive carcinomaFemale<65I/IIUnknownUnknownSD
TMTC3SNVMissense_Mutationrs768991210c.235N>Tp.Arg79Cysp.R79CQ6ZXV5protein_codingdeleterious(0)probably_damaging(0.999)TCGA-2W-A8YY-01Cervixcervical & endocervical cancerFemale<65I/IIChemotherapycisplatinCR
TMTC3SNVMissense_Mutationc.91N>Cp.Asp31Hisp.D31HQ6ZXV5protein_codingdeleterious(0)probably_damaging(1)TCGA-EK-A3GK-01Cervixcervical & endocervical cancerFemale<65I/IIUnknownUnknownSD
TMTC3SNVMissense_Mutationrs764794677c.2356N>Cp.Asp786Hisp.D786HQ6ZXV5protein_codingdeleterious(0.05)possibly_damaging(0.532)TCGA-IR-A3LH-01Cervixcervical & endocervical cancerFemale<65I/IIChemotherapycisplatinCR
TMTC3SNVMissense_Mutationnovelc.604N>Ap.Glu202Lysp.E202KQ6ZXV5protein_codingdeleterious(0)probably_damaging(0.939)TCGA-ZJ-AAXD-01Cervixcervical & endocervical cancerFemale<65III/IVUnknownUnknownSD
TMTC3SNVMissense_Mutationnovelc.2073N>Ap.Met691Ilep.M691IQ6ZXV5protein_codingtolerated(0.1)benign(0.006)TCGA-ZJ-AAXU-01Cervixcervical & endocervical cancerFemale<65I/IIUnknownUnknownSD
TMTC3deletionFrame_Shift_Delnovelc.1856delAp.Asn619ThrfsTer8p.N619Tfs*8Q6ZXV5protein_codingTCGA-EA-A3HU-01Cervixcervical & endocervical cancerFemale<65I/IIUnknownUnknownSD
Page: 1 2 3 4 5 6 7 8 9 10 11 

Top

Related drugs of malignant transformation related genes

check buttonIdentification of chemicals and drugs interact with genes involved in malignant transfromation
(DGIdb 4.0)
Entrez IDSymbolCategoryInteraction TypesDrug Claim NameDrug NamePMIDs
Page: 1