
|
|||||
|
 | |
| |
| |
| |
| |
| |
|
Gene: TMTC2 |
Gene summary for TMTC2 |
| Gene information | Species | Human | Gene symbol | TMTC2 | Gene ID | 160335 |
| Gene name | transmembrane O-mannosyltransferase targeting cadherins 2 | |
| Gene Alias | IBDBP1 | |
| Cytomap | 12q21.31 | |
| Gene Type | protein-coding | GO ID | GO:0006464 | UniProtAcc | B7Z639 |
Top |
Malignant transformation analysis |
| Identification of the aberrant gene expression in precancerous and cancerous lesions by comparing the gene expression of stem-like cells in diseased tissues with normal stem cells |
| Entrez ID | Symbol | Replicates | Species | Organ | Tissue | Adj P-value | Log2FC | Malignancy |
| 160335 | TMTC2 | CCI_1 | Human | Cervix | CC | 3.44e-20 | 1.20e+00 | 0.528 |
| 160335 | TMTC2 | CCI_2 | Human | Cervix | CC | 1.79e-10 | 1.51e+00 | 0.5249 |
| 160335 | TMTC2 | CCI_3 | Human | Cervix | CC | 1.15e-11 | 7.10e-01 | 0.516 |
| 160335 | TMTC2 | HTA11_1938_2000001011 | Human | Colorectum | AD | 4.56e-12 | 8.38e-01 | -0.0811 |
| 160335 | TMTC2 | HTA11_1391_2000001011 | Human | Colorectum | AD | 1.36e-03 | 6.06e-01 | -0.059 |
| 160335 | TMTC2 | HTA11_99999965062_69753 | Human | Colorectum | MSI-H | 1.13e-17 | 1.66e+00 | 0.3487 |
| 160335 | TMTC2 | HTA11_99999974143_84620 | Human | Colorectum | MSS | 1.63e-14 | -5.69e-01 | 0.3005 |
| 160335 | TMTC2 | A002-C-010 | Human | Colorectum | FAP | 2.02e-06 | 3.02e-01 | 0.242 |
| 160335 | TMTC2 | A015-C-203 | Human | Colorectum | FAP | 2.02e-27 | -5.75e-01 | -0.1294 |
| 160335 | TMTC2 | A015-C-204 | Human | Colorectum | FAP | 4.22e-03 | -3.11e-01 | -0.0228 |
| 160335 | TMTC2 | A002-C-201 | Human | Colorectum | FAP | 2.96e-07 | -2.36e-01 | 0.0324 |
| 160335 | TMTC2 | A002-C-203 | Human | Colorectum | FAP | 4.07e-02 | 2.36e-01 | 0.2786 |
| 160335 | TMTC2 | A001-C-119 | Human | Colorectum | FAP | 2.08e-08 | -5.11e-01 | -0.1557 |
| 160335 | TMTC2 | A001-C-108 | Human | Colorectum | FAP | 1.10e-10 | -2.72e-01 | -0.0272 |
| 160335 | TMTC2 | A002-C-205 | Human | Colorectum | FAP | 2.72e-21 | -5.23e-01 | -0.1236 |
| 160335 | TMTC2 | A015-C-005 | Human | Colorectum | FAP | 1.49e-04 | -4.05e-01 | -0.0336 |
| 160335 | TMTC2 | A015-C-006 | Human | Colorectum | FAP | 2.87e-14 | -5.80e-01 | -0.0994 |
| 160335 | TMTC2 | A015-C-106 | Human | Colorectum | FAP | 2.14e-04 | -2.94e-01 | -0.0511 |
| 160335 | TMTC2 | A002-C-114 | Human | Colorectum | FAP | 9.26e-19 | -5.81e-01 | -0.1561 |
| 160335 | TMTC2 | A015-C-104 | Human | Colorectum | FAP | 4.13e-27 | -5.96e-01 | -0.1899 |
| Page: 1 2 3 4 5 |
| Tissue | Expression Dynamics | Abbreviation |
| Cervix | 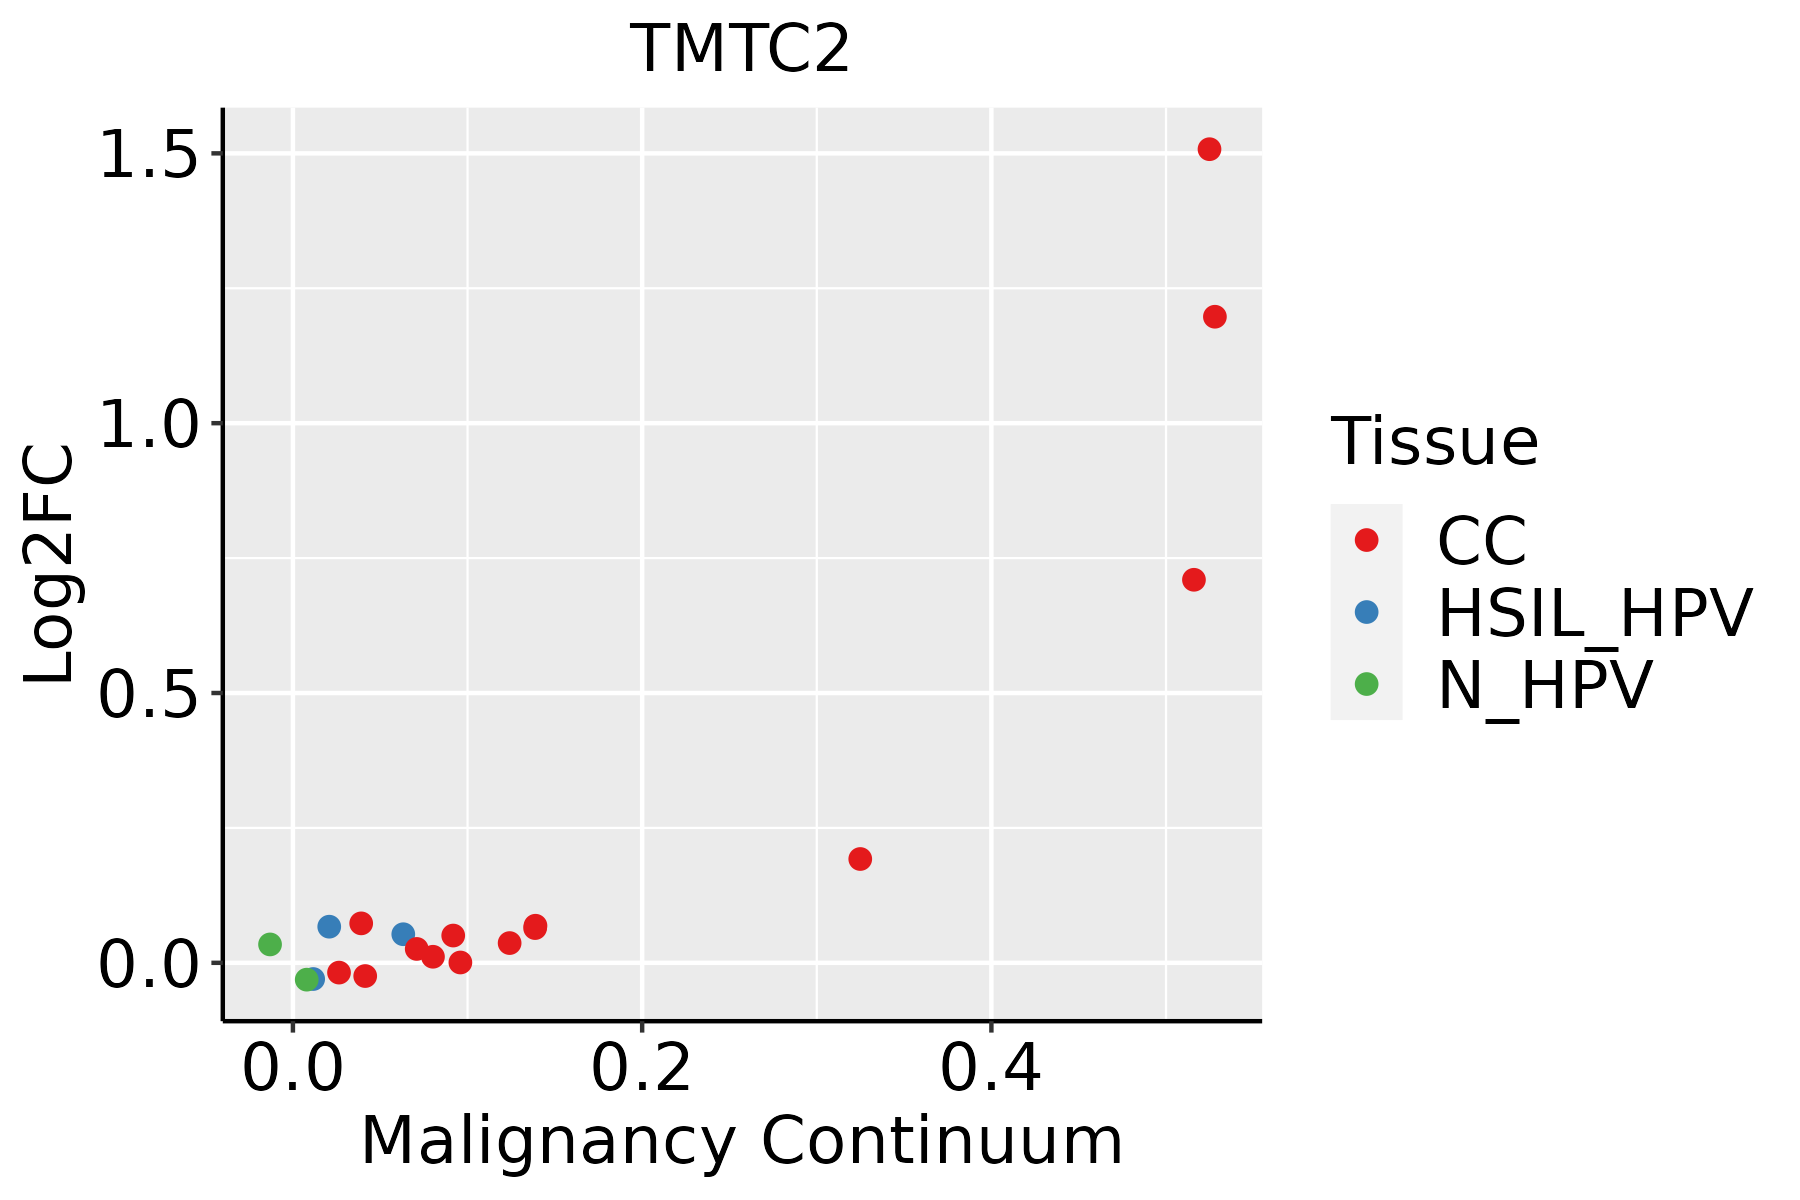 | CC: Cervix cancer |
| HSIL_HPV: HPV-infected high-grade squamous intraepithelial lesions | ||
| N_HPV: HPV-infected normal cervix | ||
| Colorectum (GSE201348) |  | FAP: Familial adenomatous polyposis |
| CRC: Colorectal cancer | ||
| Colorectum (HTA11) |  | AD: Adenomas |
| SER: Sessile serrated lesions | ||
| MSI-H: Microsatellite-high colorectal cancer | ||
| MSS: Microsatellite stable colorectal cancer | ||
| Endometrium |  | AEH: Atypical endometrial hyperplasia |
| EEC: Endometrioid Cancer | ||
| GC |  | CAG: Chronic atrophic gastritis |
| CAG with IM: Chronic atrophic gastritis with intestinal metaplasia | ||
| CSG: Chronic superficial gastritis | ||
| GC: Gastric cancer | ||
| SIM: Severe intestinal metaplasia | ||
| WIM: Wild intestinal metaplasia | ||
| Lung |  | AAH: Atypical adenomatous hyperplasia |
| AIS: Adenocarcinoma in situ | ||
| IAC: Invasive lung adenocarcinoma | ||
| MIA: Minimally invasive adenocarcinoma | ||
| Prostate | 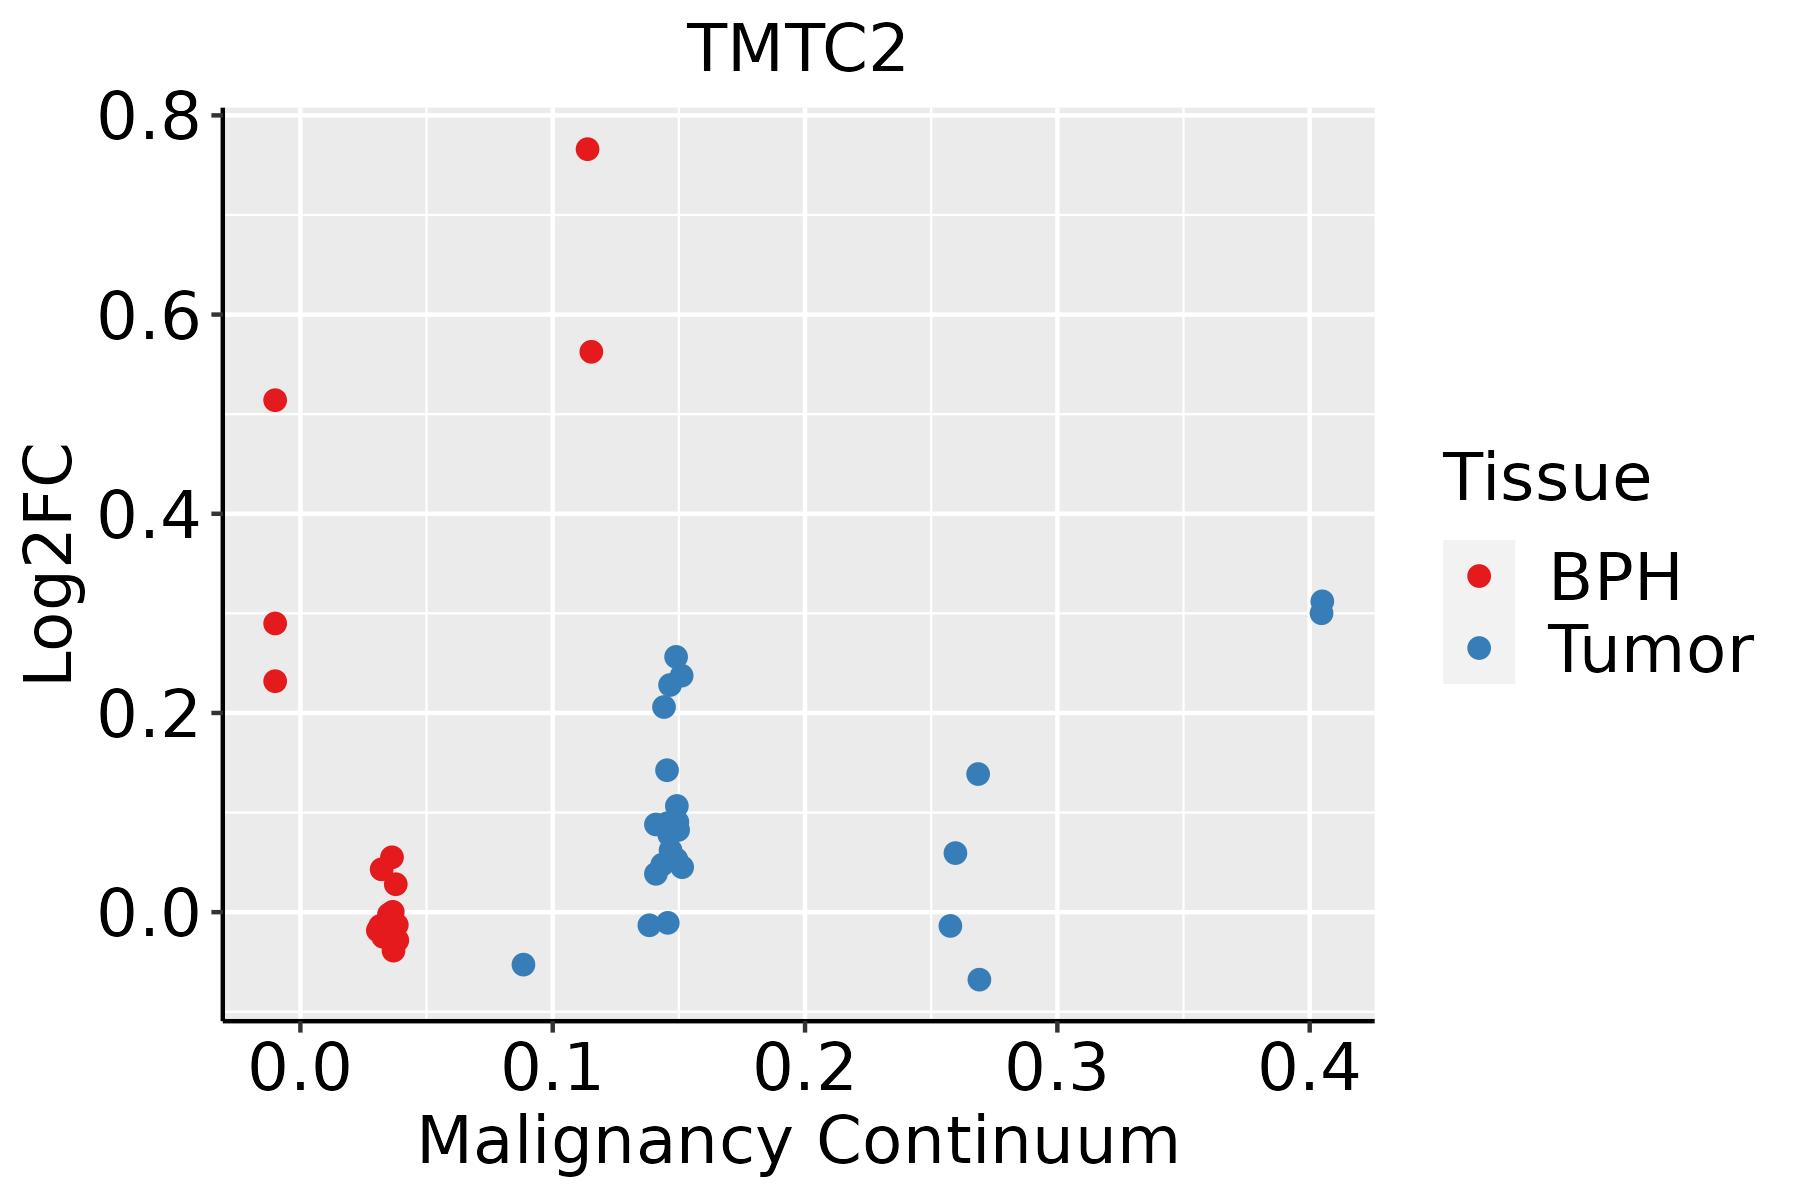 | BPH: Benign Prostatic Hyperplasia |
| ∗log2FC in expression of this searched gene in stem-like cells from each diseased tissue sample relative to stem-like cells in normal samples in each tissue plotted against the malignancy continuum. Samples are colored based on if they are from different disease stage. |
Top |
Malignant transformation related pathway analysis |
| Find out the enriched GO biological processes and KEGG pathways involved in transition from healthy to precancer to cancer |
| Tissue | Disease Stage | Enriched GO biological Processes |
| Colorectum | AD |  |
| Colorectum | SER |  |
| Colorectum | MSS |  |
| Colorectum | MSI-H |  |
| Colorectum | FAP |  |
| ∗Top 15 enriched GO BP terms are showed in the bar plot of each disease state in each tissue. Each row represents a significant GO biological process which is colored according to the -log10(p.adjust). |
| Page: 1 2 3 4 5 6 7 8 9 |
| GO ID | Tissue | Disease Stage | Description | Gene Ratio | Bg Ratio | pvalue | p.adjust | Count |
| GO:0006486 | Colorectum | AD | protein glycosylation | 64/3918 | 226/18723 | 4.86e-03 | 3.27e-02 | 64 |
| GO:0043413 | Colorectum | AD | macromolecule glycosylation | 64/3918 | 226/18723 | 4.86e-03 | 3.27e-02 | 64 |
| GO:0070085 | Colorectum | AD | glycosylation | 67/3918 | 240/18723 | 5.78e-03 | 3.67e-02 | 67 |
| GO:00064861 | Colorectum | FAP | protein glycosylation | 48/2622 | 226/18723 | 1.85e-03 | 1.57e-02 | 48 |
| GO:00434131 | Colorectum | FAP | macromolecule glycosylation | 48/2622 | 226/18723 | 1.85e-03 | 1.57e-02 | 48 |
| GO:00700851 | Colorectum | FAP | glycosylation | 50/2622 | 240/18723 | 2.30e-03 | 1.85e-02 | 50 |
| GO:0009101 | Colorectum | FAP | glycoprotein biosynthetic process | 63/2622 | 317/18723 | 2.31e-03 | 1.86e-02 | 63 |
| GO:0006493 | Lung | AIS | protein O-linked glycosylation | 17/1849 | 86/18723 | 4.04e-03 | 3.65e-02 | 17 |
| GO:00064863 | Lung | AIS | protein glycosylation | 35/1849 | 226/18723 | 4.93e-03 | 4.27e-02 | 35 |
| GO:00434133 | Lung | AIS | macromolecule glycosylation | 35/1849 | 226/18723 | 4.93e-03 | 4.27e-02 | 35 |
| Page: 1 |
| Pathway ID | Tissue | Disease Stage | Description | Gene Ratio | Bg Ratio | pvalue | p.adjust | qvalue | Count |
| Page: 1 |
Top |
Cell-cell communication analysis |
| Identification of potential cell-cell interactions between two cell types and their ligand-receptor pairs for different disease states |
| Ligand | Receptor | LRpair | Pathway | Tissue | Disease Stage |
| Page: 1 |
Top |
Single-cell gene regulatory network inference analysis |
| Find out the significant the regulons (TFs) and the target genes of each regulon across cell types for different disease states |
| TF | Cell Type | Tissue | Disease Stage | Target Gene | RSS | Regulon Activity |
| ∗The dot plots of a searched regulon are shown for all cell subpopulations in each disease state of each tissue based on the regulon specific score inferred using pySCENIC and by calculating the average expression. |
| Page: 1 |
Top |
Somatic mutation of malignant transformation related genes |
| Annotation of somatic variants for genes involved in malignant transformation |
| Hugo Symbol | Variant Class | Variant Classification | dbSNP RS | HGVSc | HGVSp | HGVSp Short | SWISSPROT | BIOTYPE | SIFT | PolyPhen | Tumor Sample Barcode | Tissue | Histology | Sex | Age | Stage | Therapy Types | Drugs | Outcome |
| TMTC2 | SNV | Missense_Mutation | c.2177N>A | p.Arg726His | p.R726H | Q8N394 | protein_coding | deleterious(0) | probably_damaging(0.974) | TCGA-AR-A24K-01 | Breast | breast invasive carcinoma | Female | <65 | I/II | Unspecific | Paclitaxel | SD | |
| TMTC2 | SNV | Missense_Mutation | c.1711N>G | p.Leu571Val | p.L571V | Q8N394 | protein_coding | tolerated(0.06) | probably_damaging(0.985) | TCGA-BH-A1F8-01 | Breast | breast invasive carcinoma | Female | >=65 | III/IV | Unknown | Unknown | PD | |
| TMTC2 | SNV | Missense_Mutation | rs780418266 | c.877N>C | p.Asp293His | p.D293H | Q8N394 | protein_coding | deleterious(0) | probably_damaging(1) | TCGA-BH-A2L8-01 | Breast | breast invasive carcinoma | Female | <65 | I/II | Chemotherapy | cytoxan | CR |
| TMTC2 | SNV | Missense_Mutation | c.2505N>C | p.Lys835Asn | p.K835N | Q8N394 | protein_coding | tolerated_low_confidence(0.08) | benign(0.015) | TCGA-E2-A150-01 | Breast | breast invasive carcinoma | Female | <65 | I/II | Chemotherapy | doxorubicin | SD | |
| TMTC2 | SNV | Missense_Mutation | c.221N>A | p.Arg74His | p.R74H | Q8N394 | protein_coding | deleterious(0) | probably_damaging(1) | TCGA-GM-A2DB-01 | Breast | breast invasive carcinoma | Female | <65 | I/II | Chemotherapy | taxol | CR | |
| TMTC2 | insertion | Nonsense_Mutation | novel | c.631_632insGTTA | p.Gln211ArgfsTer2 | p.Q211Rfs*2 | Q8N394 | protein_coding | TCGA-AR-A0U0-01 | Breast | breast invasive carcinoma | Female | >=65 | I/II | Unknown | Unknown | SD | ||
| TMTC2 | insertion | Frame_Shift_Ins | novel | c.202_203insATTCAATGTTTGTACCTTATCCACATATG | p.Leu68HisfsTer18 | p.L68Hfs*18 | Q8N394 | protein_coding | TCGA-B6-A0IN-01 | Breast | breast invasive carcinoma | Female | <65 | I/II | Unknown | Unknown | PD | ||
| TMTC2 | SNV | Missense_Mutation | novel | c.577N>T | p.Leu193Phe | p.L193F | Q8N394 | protein_coding | deleterious(0.04) | probably_damaging(0.923) | TCGA-C5-A7UI-01 | Cervix | cervical & endocervical cancer | Female | <65 | I/II | Unknown | Unknown | SD |
| TMTC2 | SNV | Missense_Mutation | c.2351A>C | p.Asn784Thr | p.N784T | Q8N394 | protein_coding | deleterious(0) | probably_damaging(0.999) | TCGA-FU-A3HZ-01 | Cervix | cervical & endocervical cancer | Female | <65 | I/II | Chemotherapy | cisplatin | CR | |
| TMTC2 | SNV | Missense_Mutation | c.474N>G | p.His158Gln | p.H158Q | Q8N394 | protein_coding | deleterious(0) | benign(0.329) | TCGA-IR-A3LA-01 | Cervix | cervical & endocervical cancer | Female | <65 | I/II | Chemotherapy | cisplatin | CR |
| Page: 1 2 3 4 5 6 7 8 9 10 11 12 |
Top |
Related drugs of malignant transformation related genes |
| Identification of chemicals and drugs interact with genes involved in malignant transfromation |
| (DGIdb 4.0) |
| Entrez ID | Symbol | Category | Interaction Types | Drug Claim Name | Drug Name | PMIDs |
| Page: 1 |

Copyright 2023-Present -The University of Texas Health Science Center at Houston |