
|
|||||
|
 | |
| |
| |
| |
| |
| |
|
Gene: TMTC1 |
Gene summary for TMTC1 |
| Gene information | Species | Human | Gene symbol | TMTC1 | Gene ID | 83857 |
| Gene name | transmembrane O-mannosyltransferase targeting cadherins 1 | |
| Gene Alias | ARG99 | |
| Cytomap | 12p11.22 | |
| Gene Type | protein-coding | GO ID | GO:0006139 | UniProtAcc | Q8IUR5 |
Top |
Malignant transformation analysis |
| Identification of the aberrant gene expression in precancerous and cancerous lesions by comparing the gene expression of stem-like cells in diseased tissues with normal stem cells |
| Entrez ID | Symbol | Replicates | Species | Organ | Tissue | Adj P-value | Log2FC | Malignancy |
| 83857 | TMTC1 | P8T-E | Human | Esophagus | ESCC | 1.72e-02 | 1.62e-01 | 0.0889 |
| 83857 | TMTC1 | P9T-E | Human | Esophagus | ESCC | 1.90e-04 | 1.39e-01 | 0.1131 |
| 83857 | TMTC1 | P10T-E | Human | Esophagus | ESCC | 3.55e-04 | 1.22e-01 | 0.116 |
| 83857 | TMTC1 | P12T-E | Human | Esophagus | ESCC | 1.00e-09 | 2.38e-01 | 0.1122 |
| 83857 | TMTC1 | P15T-E | Human | Esophagus | ESCC | 4.35e-06 | 1.68e-01 | 0.1149 |
| 83857 | TMTC1 | P16T-E | Human | Esophagus | ESCC | 6.44e-37 | 6.53e-01 | 0.1153 |
| 83857 | TMTC1 | P22T-E | Human | Esophagus | ESCC | 1.90e-07 | 1.44e-01 | 0.1236 |
| 83857 | TMTC1 | P23T-E | Human | Esophagus | ESCC | 5.16e-10 | 2.06e-01 | 0.108 |
| 83857 | TMTC1 | P26T-E | Human | Esophagus | ESCC | 4.31e-02 | 9.36e-02 | 0.1276 |
| 83857 | TMTC1 | P30T-E | Human | Esophagus | ESCC | 5.96e-19 | 5.71e-01 | 0.137 |
| 83857 | TMTC1 | P39T-E | Human | Esophagus | ESCC | 2.14e-03 | 7.62e-02 | 0.0894 |
| 83857 | TMTC1 | P40T-E | Human | Esophagus | ESCC | 7.99e-05 | 1.33e-01 | 0.109 |
| 83857 | TMTC1 | P42T-E | Human | Esophagus | ESCC | 5.08e-03 | 1.39e-01 | 0.1175 |
| 83857 | TMTC1 | P47T-E | Human | Esophagus | ESCC | 1.14e-02 | 5.99e-02 | 0.1067 |
| 83857 | TMTC1 | P48T-E | Human | Esophagus | ESCC | 2.16e-04 | 1.11e-01 | 0.0959 |
| 83857 | TMTC1 | P52T-E | Human | Esophagus | ESCC | 1.05e-14 | 2.88e-01 | 0.1555 |
| 83857 | TMTC1 | P56T-E | Human | Esophagus | ESCC | 2.21e-02 | 9.43e-01 | 0.1613 |
| 83857 | TMTC1 | P74T-E | Human | Esophagus | ESCC | 1.74e-02 | 1.60e-01 | 0.1479 |
| 83857 | TMTC1 | P107T-E | Human | Esophagus | ESCC | 3.14e-02 | 7.34e-02 | 0.171 |
| 83857 | TMTC1 | P128T-E | Human | Esophagus | ESCC | 1.75e-02 | 2.07e-01 | 0.1241 |
| Page: 1 |
| Tissue | Expression Dynamics | Abbreviation |
| Esophagus | 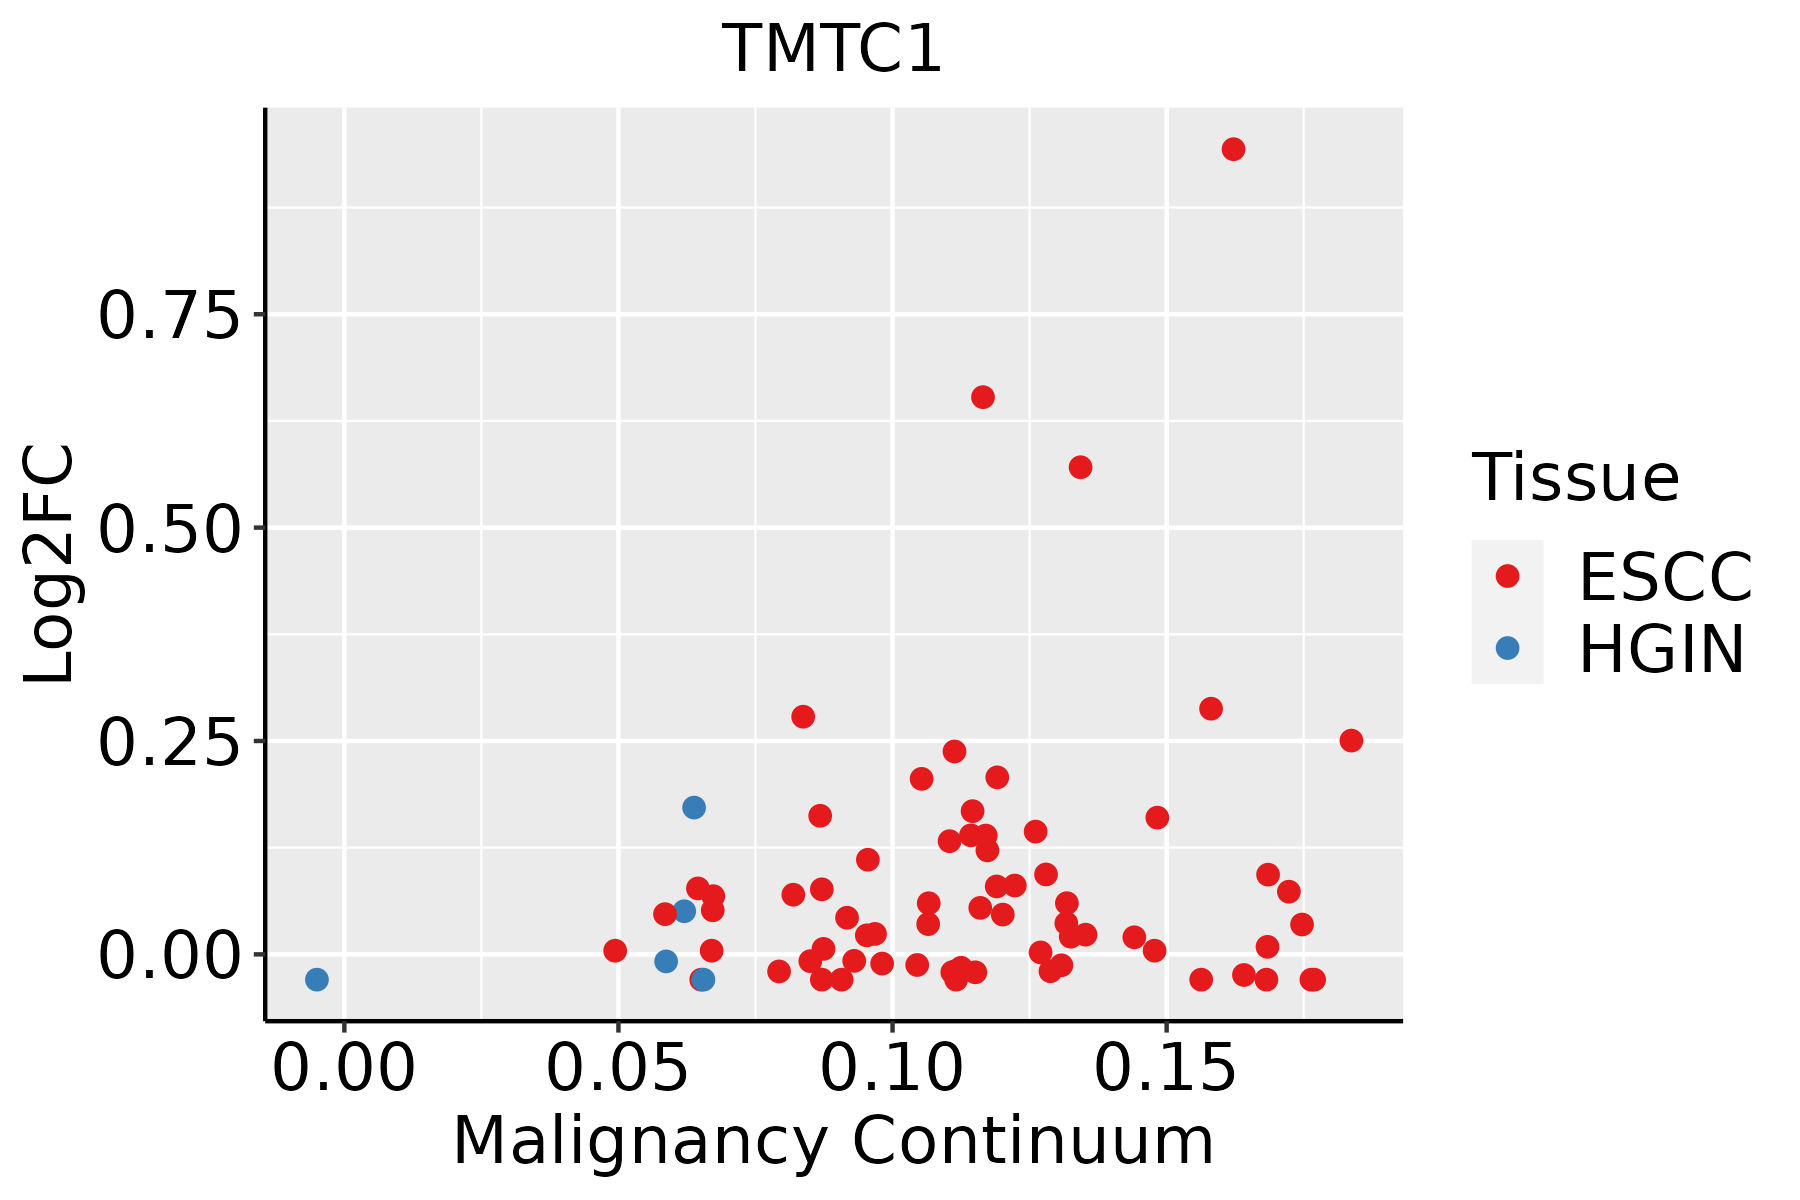 | ESCC: Esophageal squamous cell carcinoma |
| HGIN: High-grade intraepithelial neoplasias | ||
| LGIN: Low-grade intraepithelial neoplasias |
| ∗log2FC in expression of this searched gene in stem-like cells from each diseased tissue sample relative to stem-like cells in normal samples in each tissue plotted against the malignancy continuum. Samples are colored based on if they are from different disease stage. |
Top |
Malignant transformation related pathway analysis |
| Find out the enriched GO biological processes and KEGG pathways involved in transition from healthy to precancer to cancer |
| Tissue | Disease Stage | Enriched GO biological Processes |
| Colorectum | AD |  |
| Colorectum | SER |  |
| Colorectum | MSS |  |
| Colorectum | MSI-H |  |
| Colorectum | FAP |  |
| ∗Top 15 enriched GO BP terms are showed in the bar plot of each disease state in each tissue. Each row represents a significant GO biological process which is colored according to the -log10(p.adjust). |
| Page: 1 2 3 4 5 6 7 8 9 |
| GO ID | Tissue | Disease Stage | Description | Gene Ratio | Bg Ratio | pvalue | p.adjust | Count |
| GO:00091002 | Esophagus | ESCC | glycoprotein metabolic process | 226/8552 | 387/18723 | 2.64e-07 | 3.94e-06 | 226 |
| GO:00700854 | Esophagus | ESCC | glycosylation | 144/8552 | 240/18723 | 5.12e-06 | 5.38e-05 | 144 |
| GO:00064865 | Esophagus | ESCC | protein glycosylation | 135/8552 | 226/18723 | 1.36e-05 | 1.24e-04 | 135 |
| GO:00434135 | Esophagus | ESCC | macromolecule glycosylation | 135/8552 | 226/18723 | 1.36e-05 | 1.24e-04 | 135 |
| GO:00091012 | Esophagus | ESCC | glycoprotein biosynthetic process | 181/8552 | 317/18723 | 2.54e-05 | 2.15e-04 | 181 |
| GO:00064931 | Esophagus | ESCC | protein O-linked glycosylation | 51/8552 | 86/18723 | 7.54e-03 | 2.70e-02 | 51 |
| Page: 1 |
| Pathway ID | Tissue | Disease Stage | Description | Gene Ratio | Bg Ratio | pvalue | p.adjust | qvalue | Count |
| Page: 1 |
Top |
Cell-cell communication analysis |
| Identification of potential cell-cell interactions between two cell types and their ligand-receptor pairs for different disease states |
| Ligand | Receptor | LRpair | Pathway | Tissue | Disease Stage |
| Page: 1 |
Top |
Single-cell gene regulatory network inference analysis |
| Find out the significant the regulons (TFs) and the target genes of each regulon across cell types for different disease states |
| TF | Cell Type | Tissue | Disease Stage | Target Gene | RSS | Regulon Activity |
| ∗The dot plots of a searched regulon are shown for all cell subpopulations in each disease state of each tissue based on the regulon specific score inferred using pySCENIC and by calculating the average expression. |
| Page: 1 |
Top |
Somatic mutation of malignant transformation related genes |
| Annotation of somatic variants for genes involved in malignant transformation |
| Hugo Symbol | Variant Class | Variant Classification | dbSNP RS | HGVSc | HGVSp | HGVSp Short | SWISSPROT | BIOTYPE | SIFT | PolyPhen | Tumor Sample Barcode | Tissue | Histology | Sex | Age | Stage | Therapy Types | Drugs | Outcome |
| TMTC1 | SNV | Missense_Mutation | c.760C>A | p.Pro254Thr | p.P254T | Q8IUR5 | protein_coding | tolerated(0.22) | benign(0.061) | TCGA-A8-A06X-01 | Breast | breast invasive carcinoma | Female | >=65 | I/II | Unknown | Unknown | SD | |
| TMTC1 | SNV | Missense_Mutation | c.1073N>C | p.Ile358Thr | p.I358T | Q8IUR5 | protein_coding | deleterious(0.02) | benign(0.055) | TCGA-A8-A09A-01 | Breast | breast invasive carcinoma | Female | <65 | I/II | Hormone Therapy | tamoxiphen | SD | |
| TMTC1 | SNV | Missense_Mutation | novel | c.1895N>T | p.Pro632Leu | p.P632L | Q8IUR5 | protein_coding | tolerated(0.73) | possibly_damaging(0.534) | TCGA-AC-A3QQ-01 | Breast | breast invasive carcinoma | Female | <65 | I/II | Unknown | Unknown | SD |
| TMTC1 | SNV | Missense_Mutation | novel | c.329A>C | p.Asn110Thr | p.N110T | Q8IUR5 | protein_coding | tolerated(0.56) | benign(0.001) | TCGA-GM-A3NW-01 | Breast | breast invasive carcinoma | Female | <65 | I/II | Chemotherapy | fluorouracil | SD |
| TMTC1 | SNV | Missense_Mutation | novel | c.2608G>C | p.Glu870Gln | p.E870Q | Q8IUR5 | protein_coding | tolerated(0.07) | probably_damaging(0.996) | TCGA-OL-A6VQ-01 | Breast | breast invasive carcinoma | Female | <65 | I/II | Unknown | Unknown | SD |
| TMTC1 | insertion | Frame_Shift_Ins | novel | c.1895_1896insTATAA | p.Glu633IlefsTer24 | p.E633Ifs*24 | Q8IUR5 | protein_coding | TCGA-AC-A3QQ-01 | Breast | breast invasive carcinoma | Female | <65 | I/II | Unknown | Unknown | SD | ||
| TMTC1 | insertion | Nonsense_Mutation | novel | c.2036_2037insTTCCTGAACCATGTGGGAATTAGTTGTATATATCATTCC | p.Val679_Ala680insSerTerThrMetTrpGluLeuValValTyrIleIlePro | p.V679_A680insS*TMWELVVYIIP | Q8IUR5 | protein_coding | TCGA-AN-A0FX-01 | Breast | breast invasive carcinoma | Female | <65 | I/II | Unknown | Unknown | SD | ||
| TMTC1 | deletion | Frame_Shift_Del | novel | c.2396delN | p.Leu799Ter | p.L799* | Q8IUR5 | protein_coding | TCGA-D8-A27V-01 | Breast | breast invasive carcinoma | Female | <65 | I/II | Hormone Therapy | tamoxiphen | SD | ||
| TMTC1 | SNV | Missense_Mutation | rs769221124 | c.1605G>A | p.Met535Ile | p.M535I | Q8IUR5 | protein_coding | tolerated(0.39) | benign(0.033) | TCGA-VS-A8EI-01 | Cervix | cervical & endocervical cancer | Female | <65 | I/II | Chemotherapy | cisplatin | CR |
| TMTC1 | SNV | Missense_Mutation | novel | c.2144N>G | p.Ser715Cys | p.S715C | Q8IUR5 | protein_coding | deleterious(0.05) | probably_damaging(0.943) | TCGA-VS-A9V3-01 | Cervix | cervical & endocervical cancer | Female | <65 | I/II | Chemotherapy | cisplatin | PD |
| Page: 1 2 3 4 5 6 7 8 9 10 11 12 13 14 15 16 |
Top |
Related drugs of malignant transformation related genes |
| Identification of chemicals and drugs interact with genes involved in malignant transfromation |
| (DGIdb 4.0) |
| Entrez ID | Symbol | Category | Interaction Types | Drug Claim Name | Drug Name | PMIDs |
| Page: 1 |

Copyright 2023-Present -The University of Texas Health Science Center at Houston |