
|
|||||
|
 | |
| |
| |
| |
| |
| |
|
Gene: TMPRSS4 |
Gene summary for TMPRSS4 |
| Gene information | Species | Human | Gene symbol | TMPRSS4 | Gene ID | 56649 |
| Gene name | transmembrane serine protease 4 | |
| Gene Alias | CAP2 | |
| Cytomap | 11q23.3 | |
| Gene Type | protein-coding | GO ID | GO:0006508 | UniProtAcc | Q9NRS4 |
Top |
Malignant transformation analysis |
| Identification of the aberrant gene expression in precancerous and cancerous lesions by comparing the gene expression of stem-like cells in diseased tissues with normal stem cells |
| Entrez ID | Symbol | Replicates | Species | Organ | Tissue | Adj P-value | Log2FC | Malignancy |
| 56649 | TMPRSS4 | CA_HPV_2 | Human | Cervix | CC | 2.95e-04 | 2.88e-01 | 0.0391 |
| 56649 | TMPRSS4 | HSIL_HPV_1 | Human | Cervix | HSIL_HPV | 2.04e-02 | -1.35e-01 | 0.0116 |
| 56649 | TMPRSS4 | CCI_1 | Human | Cervix | CC | 2.20e-09 | 1.04e+00 | 0.528 |
| 56649 | TMPRSS4 | CCI_2 | Human | Cervix | CC | 1.33e-02 | 6.81e-01 | 0.5249 |
| 56649 | TMPRSS4 | Tumor | Human | Cervix | CC | 6.25e-09 | 3.82e-01 | 0.1241 |
| 56649 | TMPRSS4 | sample3 | Human | Cervix | CC | 1.23e-38 | 6.78e-01 | 0.1387 |
| 56649 | TMPRSS4 | H2 | Human | Cervix | HSIL_HPV | 2.84e-18 | 5.51e-01 | 0.0632 |
| 56649 | TMPRSS4 | T3 | Human | Cervix | CC | 2.61e-30 | 6.52e-01 | 0.1389 |
| 56649 | TMPRSS4 | HTA11_3410_2000001011 | Human | Colorectum | AD | 1.44e-09 | -4.88e-01 | 0.0155 |
| 56649 | TMPRSS4 | HTA11_1938_2000001011 | Human | Colorectum | AD | 1.18e-10 | 7.91e-01 | -0.0811 |
| 56649 | TMPRSS4 | HTA11_78_2000001011 | Human | Colorectum | AD | 4.74e-05 | 5.99e-01 | -0.1088 |
| 56649 | TMPRSS4 | HTA11_347_2000001011 | Human | Colorectum | AD | 4.29e-39 | 1.17e+00 | -0.1954 |
| 56649 | TMPRSS4 | HTA11_411_2000001011 | Human | Colorectum | SER | 3.04e-09 | 1.22e+00 | -0.2602 |
| 56649 | TMPRSS4 | HTA11_83_2000001011 | Human | Colorectum | SER | 5.90e-04 | 6.26e-01 | -0.1526 |
| 56649 | TMPRSS4 | HTA11_696_2000001011 | Human | Colorectum | AD | 8.79e-07 | 5.71e-01 | -0.1464 |
| 56649 | TMPRSS4 | HTA11_1391_2000001011 | Human | Colorectum | AD | 1.07e-02 | 5.84e-01 | -0.059 |
| 56649 | TMPRSS4 | HTA11_99999965062_69753 | Human | Colorectum | MSI-H | 1.60e-02 | 8.79e-01 | 0.3487 |
| 56649 | TMPRSS4 | HTA11_99999971662_82457 | Human | Colorectum | MSS | 1.54e-13 | 9.52e-01 | 0.3859 |
| 56649 | TMPRSS4 | F007 | Human | Colorectum | FAP | 1.60e-08 | -5.12e-01 | 0.1176 |
| 56649 | TMPRSS4 | A002-C-010 | Human | Colorectum | FAP | 2.88e-10 | -4.21e-01 | 0.242 |
| Page: 1 2 3 4 5 6 7 8 |
| Tissue | Expression Dynamics | Abbreviation |
| Cervix |  | CC: Cervix cancer |
| HSIL_HPV: HPV-infected high-grade squamous intraepithelial lesions | ||
| N_HPV: HPV-infected normal cervix | ||
| Colorectum (GSE201348) |  | FAP: Familial adenomatous polyposis |
| CRC: Colorectal cancer | ||
| Colorectum (HTA11) | 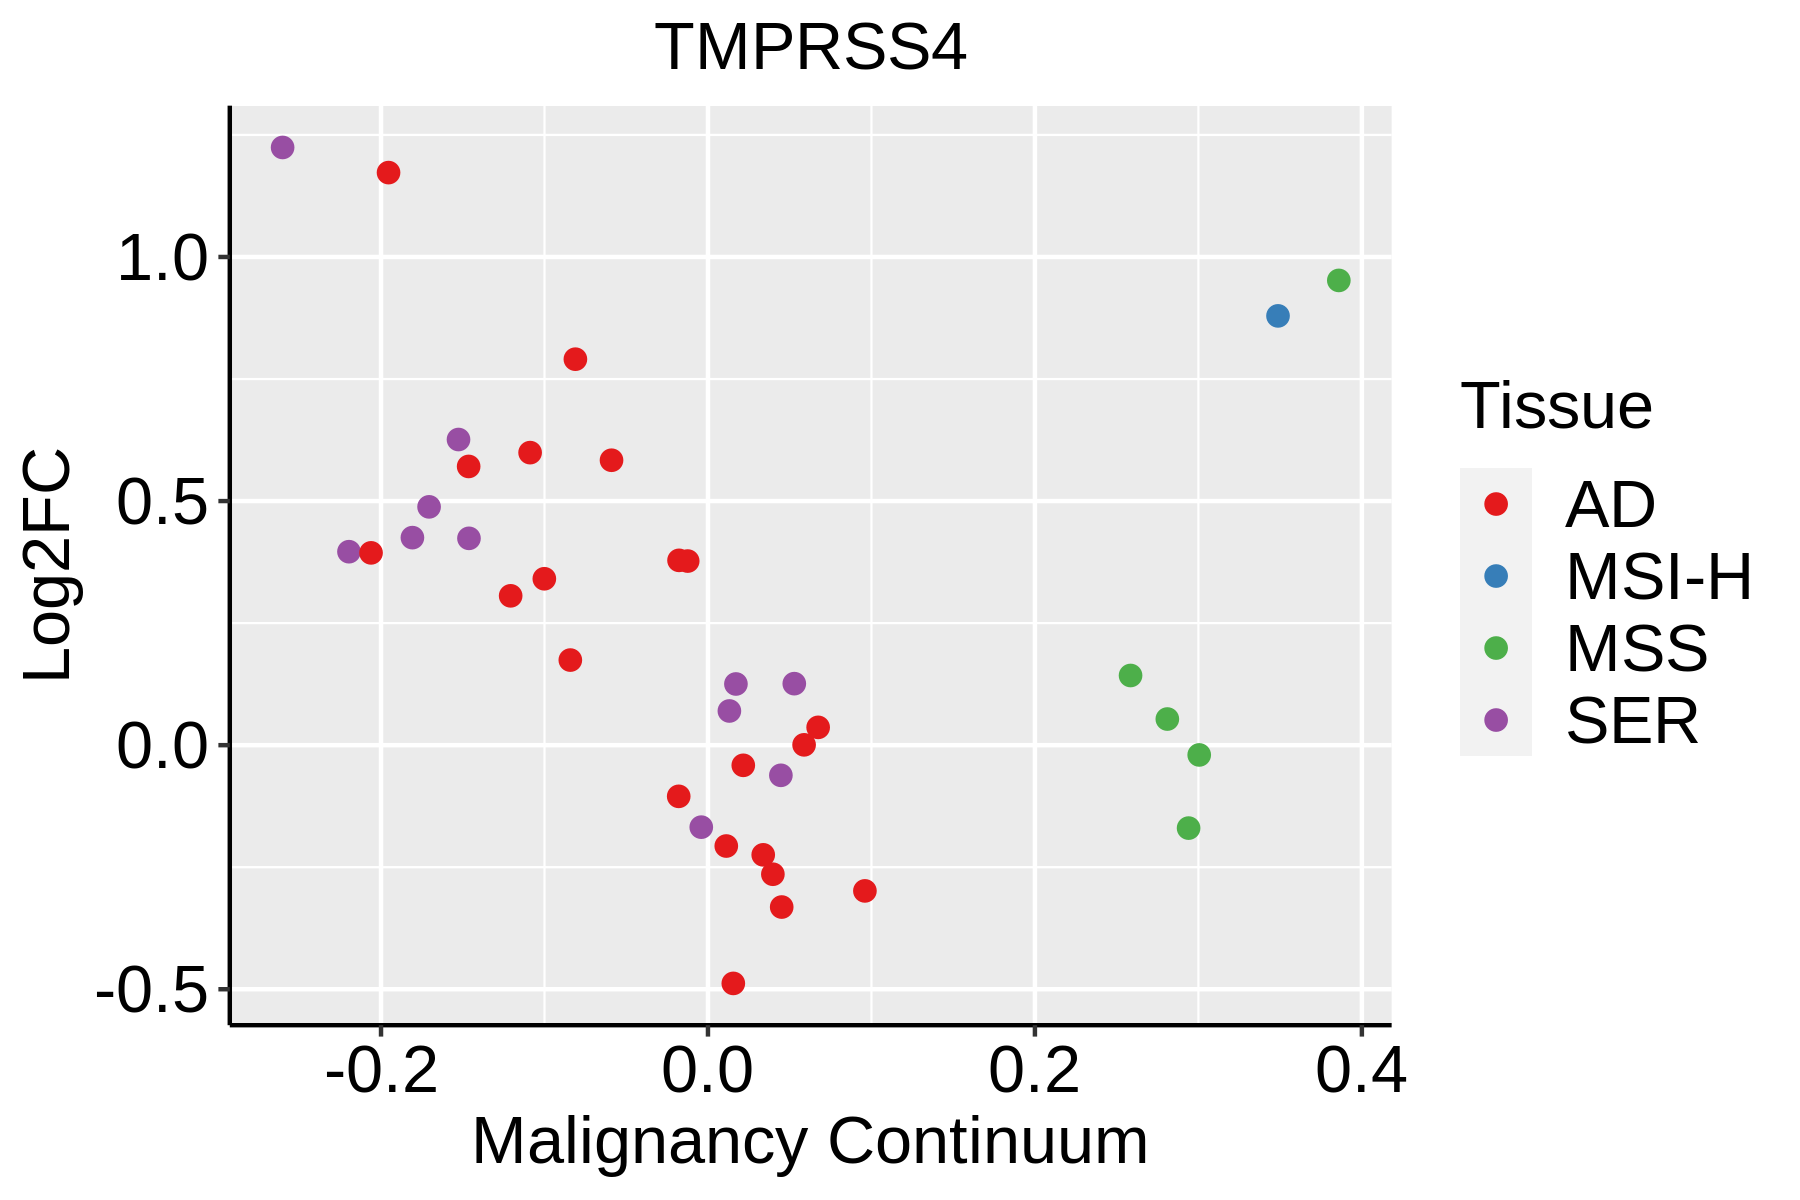 | AD: Adenomas |
| SER: Sessile serrated lesions | ||
| MSI-H: Microsatellite-high colorectal cancer | ||
| MSS: Microsatellite stable colorectal cancer | ||
| Endometrium | 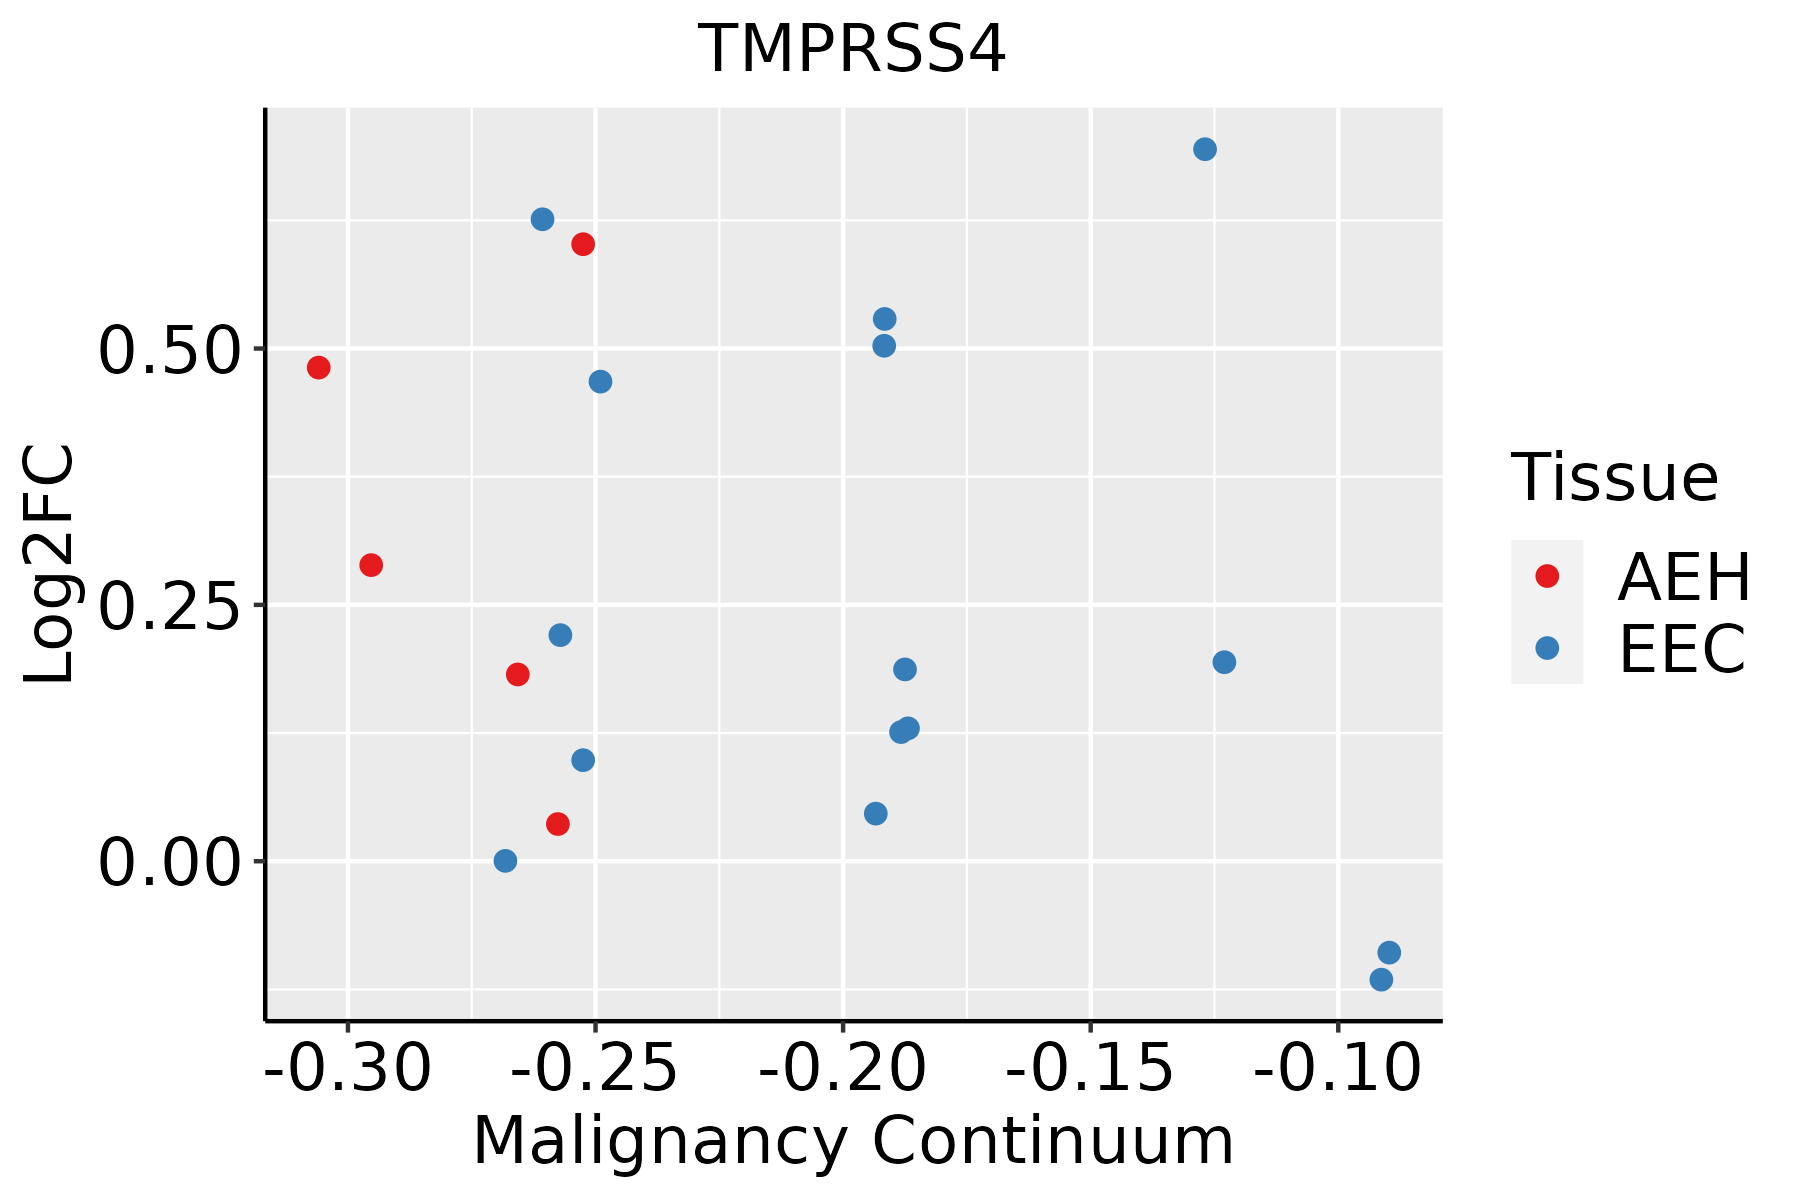 | AEH: Atypical endometrial hyperplasia |
| EEC: Endometrioid Cancer | ||
| Esophagus |  | ESCC: Esophageal squamous cell carcinoma |
| HGIN: High-grade intraepithelial neoplasias | ||
| LGIN: Low-grade intraepithelial neoplasias | ||
| Lung | 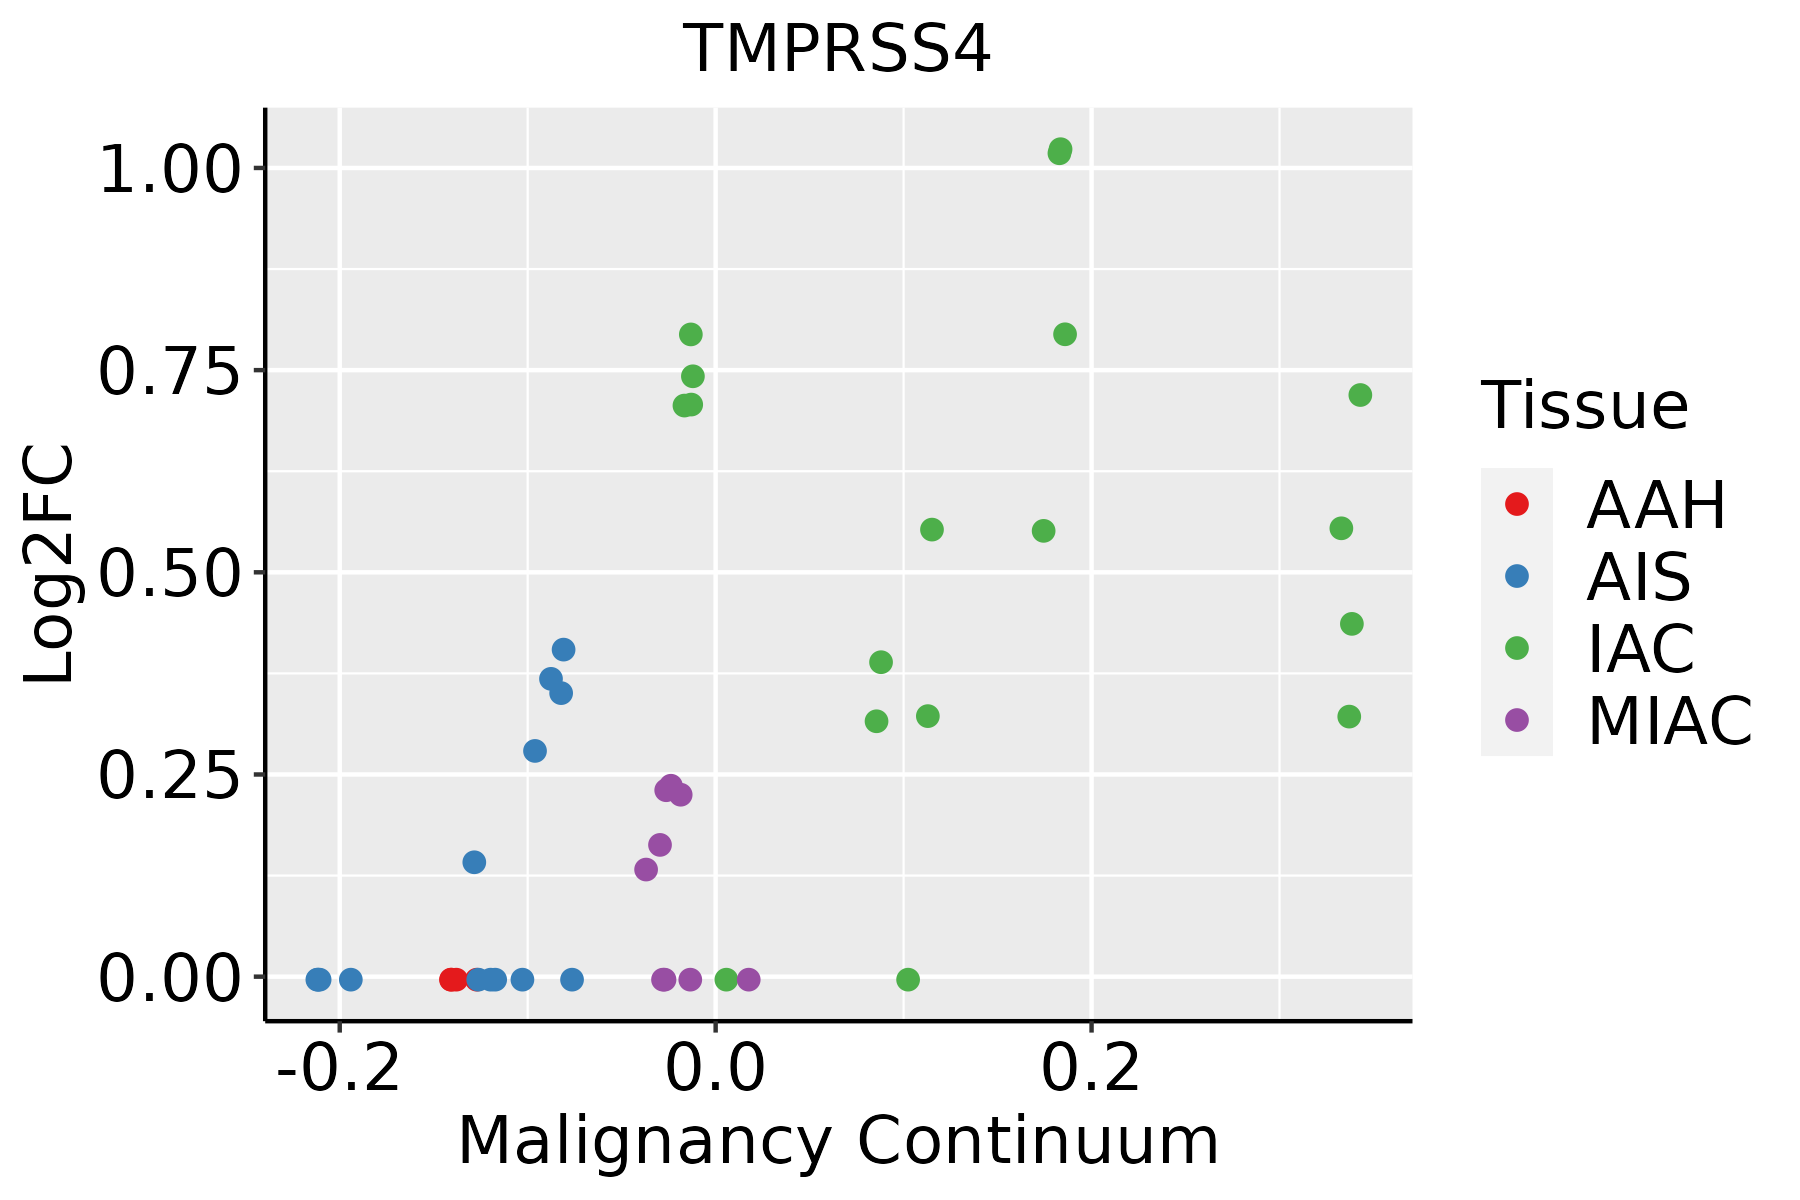 | AAH: Atypical adenomatous hyperplasia |
| AIS: Adenocarcinoma in situ | ||
| IAC: Invasive lung adenocarcinoma | ||
| MIA: Minimally invasive adenocarcinoma | ||
| Oral Cavity | 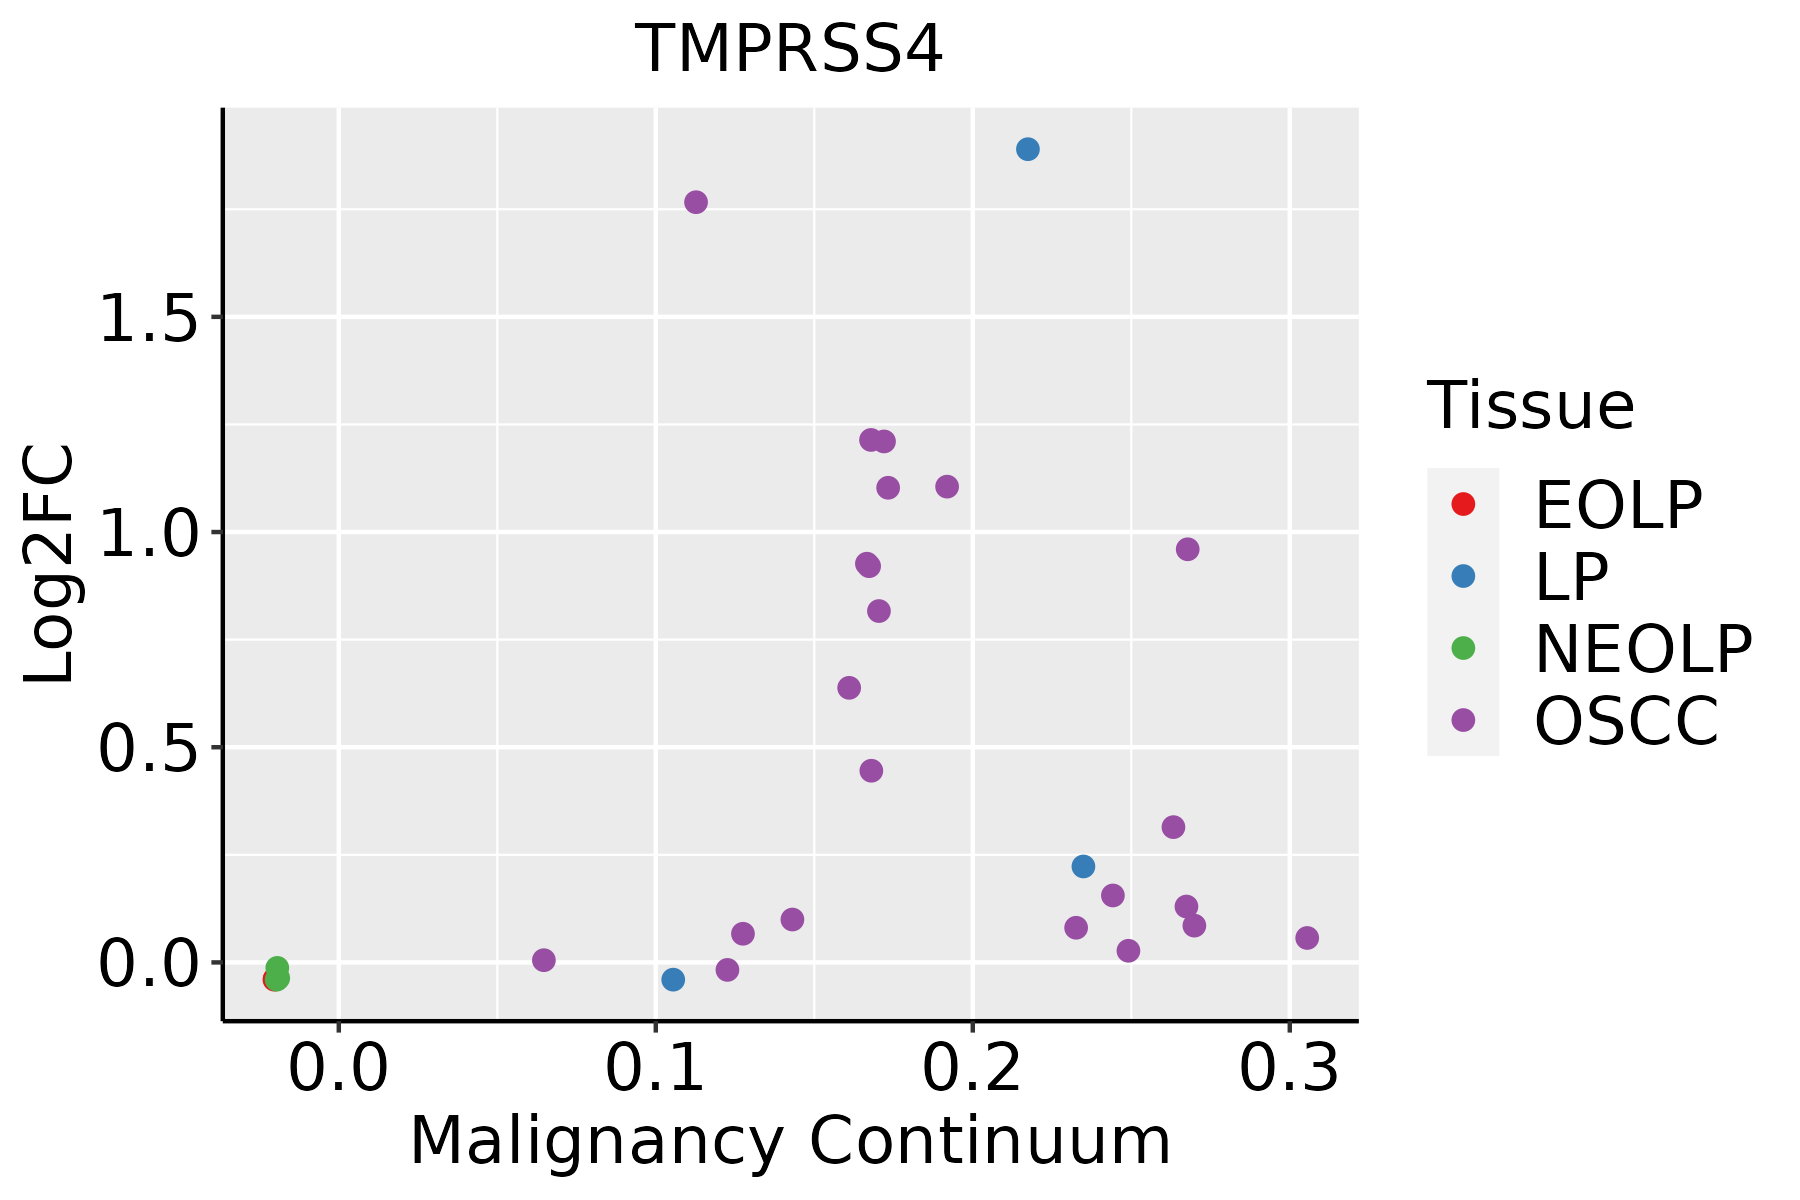 | EOLP: Erosive Oral lichen planus |
| LP: leukoplakia | ||
| NEOLP: Non-erosive oral lichen planus | ||
| OSCC: Oral squamous cell carcinoma | ||
| Thyroid |  | ATC: Anaplastic thyroid cancer |
| HT: Hashimoto's thyroiditis | ||
| PTC: Papillary thyroid cancer |
| ∗log2FC in expression of this searched gene in stem-like cells from each diseased tissue sample relative to stem-like cells in normal samples in each tissue plotted against the malignancy continuum. Samples are colored based on if they are from different disease stage. |
Top |
Malignant transformation related pathway analysis |
| Find out the enriched GO biological processes and KEGG pathways involved in transition from healthy to precancer to cancer |
| Tissue | Disease Stage | Enriched GO biological Processes |
| Colorectum | AD |  |
| Colorectum | SER |  |
| Colorectum | MSS |  |
| Colorectum | MSI-H |  |
| Colorectum | FAP |  |
| ∗Top 15 enriched GO BP terms are showed in the bar plot of each disease state in each tissue. Each row represents a significant GO biological process which is colored according to the -log10(p.adjust). |
| Page: 1 2 3 4 5 6 7 8 9 |
| GO ID | Tissue | Disease Stage | Description | Gene Ratio | Bg Ratio | pvalue | p.adjust | Count |
| GO:001603210 | Cervix | CC | viral process | 109/2311 | 415/18723 | 5.40e-15 | 6.46e-12 | 109 |
| GO:001905810 | Cervix | CC | viral life cycle | 87/2311 | 317/18723 | 2.20e-13 | 1.20e-10 | 87 |
| GO:005212610 | Cervix | CC | movement in host environment | 52/2311 | 175/18723 | 7.03e-10 | 8.76e-08 | 52 |
| GO:004440910 | Cervix | CC | entry into host | 47/2311 | 151/18723 | 8.45e-10 | 1.03e-07 | 47 |
| GO:005170110 | Cervix | CC | biological process involved in interaction with host | 57/2311 | 203/18723 | 1.18e-09 | 1.41e-07 | 57 |
| GO:004671810 | Cervix | CC | viral entry into host cell | 44/2311 | 144/18723 | 5.47e-09 | 5.03e-07 | 44 |
| GO:004440310 | Cervix | CC | biological process involved in symbiotic interaction | 71/2311 | 290/18723 | 7.94e-09 | 6.98e-07 | 71 |
| GO:005079210 | Cervix | CC | regulation of viral process | 38/2311 | 164/18723 | 8.12e-05 | 1.10e-03 | 38 |
| GO:190390010 | Cervix | CC | regulation of viral life cycle | 33/2311 | 148/18723 | 4.86e-04 | 4.76e-03 | 33 |
| GO:00523728 | Cervix | CC | modulation by symbiont of entry into host | 15/2311 | 49/18723 | 5.81e-04 | 5.52e-03 | 15 |
| GO:00516048 | Cervix | CC | protein maturation | 56/2311 | 294/18723 | 5.90e-04 | 5.59e-03 | 56 |
| GO:004390310 | Cervix | CC | regulation of biological process involved in symbiotic interaction | 19/2311 | 72/18723 | 9.11e-04 | 7.81e-03 | 19 |
| GO:00465988 | Cervix | CC | positive regulation of viral entry into host cell | 5/2311 | 11/18723 | 6.92e-03 | 3.74e-02 | 5 |
| GO:00752948 | Cervix | CC | positive regulation by symbiont of entry into host | 5/2311 | 11/18723 | 6.92e-03 | 3.74e-02 | 5 |
| GO:004440915 | Cervix | HSIL_HPV | entry into host | 24/737 | 151/18723 | 5.42e-09 | 7.61e-07 | 24 |
| GO:005212615 | Cervix | HSIL_HPV | movement in host environment | 25/737 | 175/18723 | 2.41e-08 | 2.18e-06 | 25 |
| GO:001905815 | Cervix | HSIL_HPV | viral life cycle | 35/737 | 317/18723 | 3.94e-08 | 3.17e-06 | 35 |
| GO:004440315 | Cervix | HSIL_HPV | biological process involved in symbiotic interaction | 33/737 | 290/18723 | 4.67e-08 | 3.59e-06 | 33 |
| GO:004671815 | Cervix | HSIL_HPV | viral entry into host cell | 22/737 | 144/18723 | 4.88e-08 | 3.62e-06 | 22 |
| GO:001603215 | Cervix | HSIL_HPV | viral process | 41/737 | 415/18723 | 6.43e-08 | 4.49e-06 | 41 |
| Page: 1 2 3 4 5 6 7 8 9 10 11 12 13 |
| Pathway ID | Tissue | Disease Stage | Description | Gene Ratio | Bg Ratio | pvalue | p.adjust | qvalue | Count |
| hsa0516414 | Cervix | CC | Influenza A | 43/1267 | 171/8465 | 3.03e-04 | 1.64e-03 | 9.68e-04 | 43 |
| hsa0516415 | Cervix | CC | Influenza A | 43/1267 | 171/8465 | 3.03e-04 | 1.64e-03 | 9.68e-04 | 43 |
| hsa0516422 | Cervix | HSIL_HPV | Influenza A | 23/459 | 171/8465 | 4.65e-05 | 6.48e-04 | 5.24e-04 | 23 |
| hsa0516432 | Cervix | HSIL_HPV | Influenza A | 23/459 | 171/8465 | 4.65e-05 | 6.48e-04 | 5.24e-04 | 23 |
| hsa0516420 | Esophagus | HGIN | Influenza A | 42/1383 | 171/8465 | 3.41e-03 | 2.54e-02 | 2.02e-02 | 42 |
| hsa05164110 | Esophagus | HGIN | Influenza A | 42/1383 | 171/8465 | 3.41e-03 | 2.54e-02 | 2.02e-02 | 42 |
| hsa0516425 | Esophagus | ESCC | Influenza A | 122/4205 | 171/8465 | 5.01e-09 | 4.79e-08 | 2.45e-08 | 122 |
| hsa0516435 | Esophagus | ESCC | Influenza A | 122/4205 | 171/8465 | 5.01e-09 | 4.79e-08 | 2.45e-08 | 122 |
| hsa0516412 | Lung | IAC | Influenza A | 35/1053 | 171/8465 | 1.82e-03 | 1.00e-02 | 6.66e-03 | 35 |
| hsa0516413 | Lung | IAC | Influenza A | 35/1053 | 171/8465 | 1.82e-03 | 1.00e-02 | 6.66e-03 | 35 |
| hsa0516418 | Oral cavity | OSCC | Influenza A | 116/3704 | 171/8465 | 1.23e-10 | 1.78e-09 | 9.08e-10 | 116 |
| hsa0516419 | Oral cavity | OSCC | Influenza A | 116/3704 | 171/8465 | 1.23e-10 | 1.78e-09 | 9.08e-10 | 116 |
| hsa0516424 | Oral cavity | LP | Influenza A | 80/2418 | 171/8465 | 2.56e-07 | 3.41e-06 | 2.20e-06 | 80 |
| hsa0516434 | Oral cavity | LP | Influenza A | 80/2418 | 171/8465 | 2.56e-07 | 3.41e-06 | 2.20e-06 | 80 |
| Page: 1 |
Top |
Cell-cell communication analysis |
| Identification of potential cell-cell interactions between two cell types and their ligand-receptor pairs for different disease states |
| Ligand | Receptor | LRpair | Pathway | Tissue | Disease Stage |
| Page: 1 |
Top |
Single-cell gene regulatory network inference analysis |
| Find out the significant the regulons (TFs) and the target genes of each regulon across cell types for different disease states |
| TF | Cell Type | Tissue | Disease Stage | Target Gene | RSS | Regulon Activity |
| ∗The dot plots of a searched regulon are shown for all cell subpopulations in each disease state of each tissue based on the regulon specific score inferred using pySCENIC and by calculating the average expression. |
| Page: 1 |
Top |
Somatic mutation of malignant transformation related genes |
| Annotation of somatic variants for genes involved in malignant transformation |
| Hugo Symbol | Variant Class | Variant Classification | dbSNP RS | HGVSc | HGVSp | HGVSp Short | SWISSPROT | BIOTYPE | SIFT | PolyPhen | Tumor Sample Barcode | Tissue | Histology | Sex | Age | Stage | Therapy Types | Drugs | Outcome |
| TMPRSS4 | SNV | Missense_Mutation | c.1186N>A | p.Asp396Asn | p.D396N | Q9NRS4 | protein_coding | tolerated(0.29) | possibly_damaging(0.505) | TCGA-A2-A0YT-01 | Breast | breast invasive carcinoma | Female | <65 | III/IV | Hormone Therapy | arimidex | SD | |
| TMPRSS4 | SNV | Missense_Mutation | c.295N>C | p.Gly99Arg | p.G99R | Q9NRS4 | protein_coding | tolerated(0.11) | benign(0.003) | TCGA-AN-A0XU-01 | Breast | breast invasive carcinoma | Female | <65 | I/II | Unknown | Unknown | SD | |
| TMPRSS4 | SNV | Missense_Mutation | novel | c.1109T>G | p.Met370Arg | p.M370R | Q9NRS4 | protein_coding | deleterious(0) | probably_damaging(0.997) | TCGA-AO-A0J9-01 | Breast | breast invasive carcinoma | Female | <65 | III/IV | Chemotherapy | cyclophosphamide | PD |
| TMPRSS4 | SNV | Missense_Mutation | rs781599975 | c.673N>A | p.Asp225Asn | p.D225N | Q9NRS4 | protein_coding | tolerated(0.97) | benign(0.003) | TCGA-E9-A1R0-01 | Breast | breast invasive carcinoma | Female | <65 | I/II | Chemotherapy | cyclophosphamide | SD |
| TMPRSS4 | SNV | Missense_Mutation | novel | c.1037N>T | p.Ala346Val | p.A346V | Q9NRS4 | protein_coding | deleterious(0) | possibly_damaging(0.632) | TCGA-2W-A8YY-01 | Cervix | cervical & endocervical cancer | Female | <65 | I/II | Chemotherapy | cisplatin | CR |
| TMPRSS4 | SNV | Missense_Mutation | rs774877636 | c.341N>G | p.Gln114Arg | p.Q114R | Q9NRS4 | protein_coding | deleterious(0.03) | probably_damaging(0.999) | TCGA-AD-6895-01 | Colorectum | colon adenocarcinoma | Male | >=65 | III/IV | Unknown | Unknown | SD |
| TMPRSS4 | SNV | Missense_Mutation | c.523N>T | p.Arg175Cys | p.R175C | Q9NRS4 | protein_coding | deleterious(0) | benign(0.394) | TCGA-AG-A002-01 | Colorectum | rectum adenocarcinoma | Male | <65 | I/II | Unknown | Unknown | SD | |
| TMPRSS4 | SNV | Missense_Mutation | rs144820624 | c.524N>A | p.Arg175His | p.R175H | Q9NRS4 | protein_coding | tolerated(0.17) | benign(0) | TCGA-A5-A0G2-01 | Endometrium | uterine corpus endometrioid carcinoma | Female | <65 | III/IV | Unknown | Unknown | SD |
| TMPRSS4 | SNV | Missense_Mutation | rs762712812 | c.1289N>G | p.Tyr430Cys | p.Y430C | Q9NRS4 | protein_coding | deleterious(0) | possibly_damaging(0.784) | TCGA-A5-A2K5-01 | Endometrium | uterine corpus endometrioid carcinoma | Female | >=65 | I/II | Unknown | Unknown | SD |
| TMPRSS4 | SNV | Missense_Mutation | novel | c.939C>A | p.Phe313Leu | p.F313L | Q9NRS4 | protein_coding | deleterious(0.01) | benign(0.406) | TCGA-AJ-A5DW-01 | Endometrium | uterine corpus endometrioid carcinoma | Female | <65 | I/II | Unknown | Unknown | SD |
| Page: 1 2 3 4 |
Top |
Related drugs of malignant transformation related genes |
| Identification of chemicals and drugs interact with genes involved in malignant transfromation |
| (DGIdb 4.0) |
| Entrez ID | Symbol | Category | Interaction Types | Drug Claim Name | Drug Name | PMIDs |
| Page: 1 |

Copyright 2023-Present -The University of Texas Health Science Center at Houston |