| Tissue | Expression Dynamics | Abbreviation |
| Colorectum (GSE201348) |  | FAP: Familial adenomatous polyposis |
| CRC: Colorectal cancer |
| Colorectum (HTA11) |  | AD: Adenomas |
| SER: Sessile serrated lesions |
| MSI-H: Microsatellite-high colorectal cancer |
| MSS: Microsatellite stable colorectal cancer |
| Esophagus |  | ESCC: Esophageal squamous cell carcinoma |
| HGIN: High-grade intraepithelial neoplasias |
| LGIN: Low-grade intraepithelial neoplasias |
| GC | 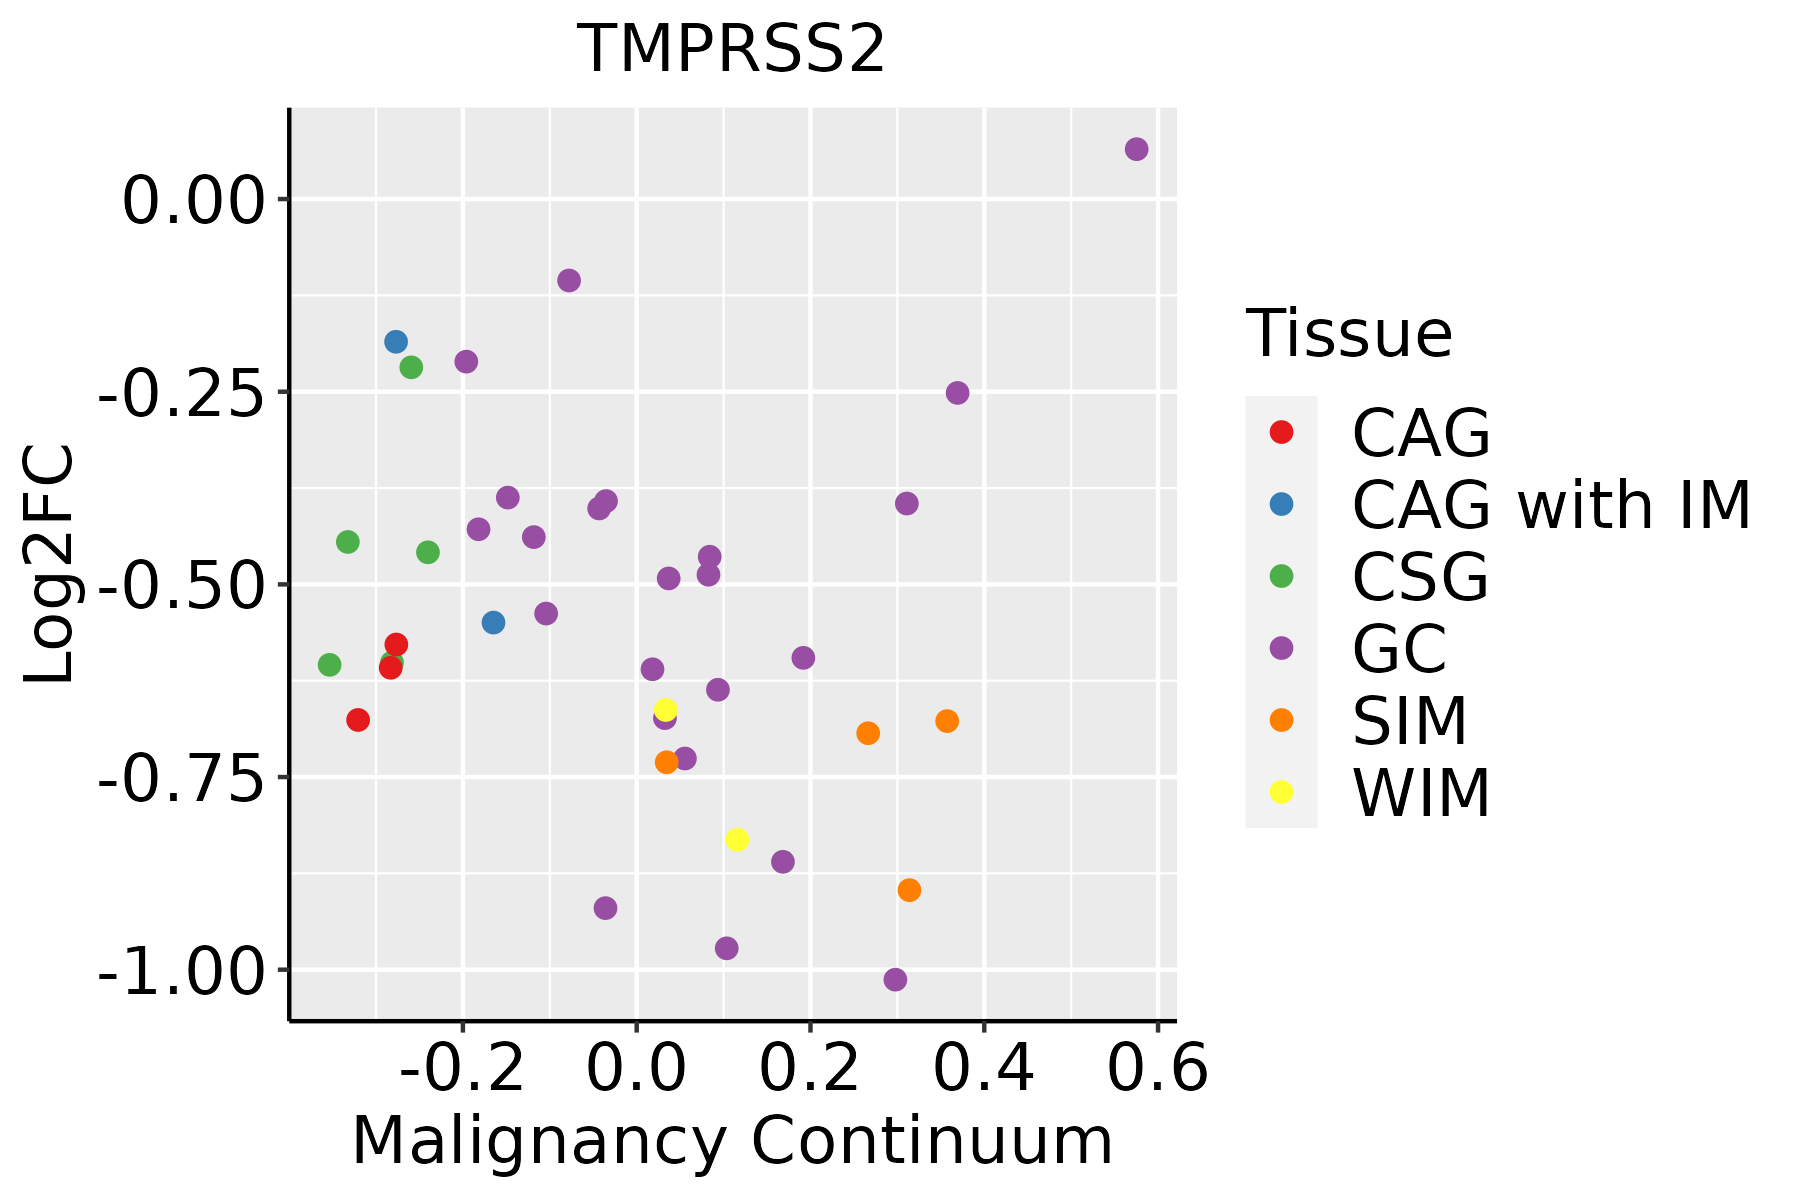 | CAG: Chronic atrophic gastritis |
| CAG with IM: Chronic atrophic gastritis with intestinal metaplasia |
| CSG: Chronic superficial gastritis |
| GC: Gastric cancer |
| SIM: Severe intestinal metaplasia |
| WIM: Wild intestinal metaplasia |
| Lung |  | AAH: Atypical adenomatous hyperplasia |
| AIS: Adenocarcinoma in situ |
| IAC: Invasive lung adenocarcinoma |
| MIA: Minimally invasive adenocarcinoma |
| Prostate |  | BPH: Benign Prostatic Hyperplasia |
| GO ID | Tissue | Disease Stage | Description | Gene Ratio | Bg Ratio | pvalue | p.adjust | Count |
| GO:0016032 | Colorectum | AD | viral process | 168/3918 | 415/18723 | 4.67e-20 | 3.66e-17 | 168 |
| GO:0019058 | Colorectum | AD | viral life cycle | 119/3918 | 317/18723 | 6.18e-12 | 8.23e-10 | 119 |
| GO:0044403 | Colorectum | AD | biological process involved in symbiotic interaction | 99/3918 | 290/18723 | 1.02e-07 | 4.93e-06 | 99 |
| GO:0051701 | Colorectum | AD | biological process involved in interaction with host | 73/3918 | 203/18723 | 5.08e-07 | 1.88e-05 | 73 |
| GO:0048524 | Colorectum | AD | positive regulation of viral process | 31/3918 | 65/18723 | 1.33e-06 | 4.23e-05 | 31 |
| GO:0052126 | Colorectum | AD | movement in host environment | 63/3918 | 175/18723 | 2.85e-06 | 8.11e-05 | 63 |
| GO:0050792 | Colorectum | AD | regulation of viral process | 59/3918 | 164/18723 | 5.95e-06 | 1.52e-04 | 59 |
| GO:0046718 | Colorectum | AD | viral entry into host cell | 51/3918 | 144/18723 | 3.99e-05 | 7.16e-04 | 51 |
| GO:1903900 | Colorectum | AD | regulation of viral life cycle | 51/3918 | 148/18723 | 9.01e-05 | 1.38e-03 | 51 |
| GO:0044409 | Colorectum | AD | entry into host | 51/3918 | 151/18723 | 1.60e-04 | 2.21e-03 | 51 |
| GO:0051604 | Colorectum | AD | protein maturation | 85/3918 | 294/18723 | 6.73e-04 | 6.91e-03 | 85 |
| GO:1903902 | Colorectum | AD | positive regulation of viral life cycle | 14/3918 | 29/18723 | 9.40e-04 | 8.92e-03 | 14 |
| GO:0016485 | Colorectum | AD | protein processing | 63/3918 | 225/18723 | 6.77e-03 | 4.19e-02 | 63 |
| GO:00160321 | Colorectum | SER | viral process | 118/2897 | 415/18723 | 8.36e-12 | 1.65e-09 | 118 |
| GO:00190581 | Colorectum | SER | viral life cycle | 87/2897 | 317/18723 | 2.82e-08 | 1.94e-06 | 87 |
| GO:00517011 | Colorectum | SER | biological process involved in interaction with host | 55/2897 | 203/18723 | 1.42e-05 | 4.38e-04 | 55 |
| GO:00516041 | Colorectum | SER | protein maturation | 73/2897 | 294/18723 | 1.82e-05 | 5.38e-04 | 73 |
| GO:00444031 | Colorectum | SER | biological process involved in symbiotic interaction | 72/2897 | 290/18723 | 2.08e-05 | 6.02e-04 | 72 |
| GO:00521261 | Colorectum | SER | movement in host environment | 47/2897 | 175/18723 | 7.30e-05 | 1.64e-03 | 47 |
| GO:00507921 | Colorectum | SER | regulation of viral process | 43/2897 | 164/18723 | 2.57e-04 | 4.31e-03 | 43 |
| Pathway ID | Tissue | Disease Stage | Description | Gene Ratio | Bg Ratio | pvalue | p.adjust | qvalue | Count |
| hsa05171 | Colorectum | AD | Coronavirus disease - COVID-19 | 113/2092 | 232/8465 | 9.90e-16 | 2.55e-14 | 1.63e-14 | 113 |
| hsa051711 | Colorectum | AD | Coronavirus disease - COVID-19 | 113/2092 | 232/8465 | 9.90e-16 | 2.55e-14 | 1.63e-14 | 113 |
| hsa051712 | Colorectum | SER | Coronavirus disease - COVID-19 | 98/1580 | 232/8465 | 3.33e-17 | 8.50e-16 | 6.17e-16 | 98 |
| hsa051713 | Colorectum | SER | Coronavirus disease - COVID-19 | 98/1580 | 232/8465 | 3.33e-17 | 8.50e-16 | 6.17e-16 | 98 |
| hsa051718 | Colorectum | FAP | Coronavirus disease - COVID-19 | 78/1404 | 232/8465 | 9.94e-11 | 1.11e-08 | 6.73e-09 | 78 |
| hsa052152 | Colorectum | FAP | Prostate cancer | 28/1404 | 97/8465 | 1.67e-03 | 8.57e-03 | 5.21e-03 | 28 |
| hsa05202 | Colorectum | FAP | Transcriptional misregulation in cancer | 45/1404 | 193/8465 | 9.19e-03 | 3.33e-02 | 2.03e-02 | 45 |
| hsa051719 | Colorectum | FAP | Coronavirus disease - COVID-19 | 78/1404 | 232/8465 | 9.94e-11 | 1.11e-08 | 6.73e-09 | 78 |
| hsa052153 | Colorectum | FAP | Prostate cancer | 28/1404 | 97/8465 | 1.67e-03 | 8.57e-03 | 5.21e-03 | 28 |
| hsa052021 | Colorectum | FAP | Transcriptional misregulation in cancer | 45/1404 | 193/8465 | 9.19e-03 | 3.33e-02 | 2.03e-02 | 45 |
| hsa0517110 | Colorectum | CRC | Coronavirus disease - COVID-19 | 74/1091 | 232/8465 | 1.66e-14 | 2.78e-12 | 1.88e-12 | 74 |
| hsa052154 | Colorectum | CRC | Prostate cancer | 21/1091 | 97/8465 | 1.08e-02 | 4.74e-02 | 3.21e-02 | 21 |
| hsa0517111 | Colorectum | CRC | Coronavirus disease - COVID-19 | 74/1091 | 232/8465 | 1.66e-14 | 2.78e-12 | 1.88e-12 | 74 |
| hsa052155 | Colorectum | CRC | Prostate cancer | 21/1091 | 97/8465 | 1.08e-02 | 4.74e-02 | 3.21e-02 | 21 |
| hsa0516425 | Esophagus | ESCC | Influenza A | 122/4205 | 171/8465 | 5.01e-09 | 4.79e-08 | 2.45e-08 | 122 |
| hsa05171211 | Esophagus | ESCC | Coronavirus disease - COVID-19 | 156/4205 | 232/8465 | 3.18e-08 | 2.68e-07 | 1.37e-07 | 156 |
| hsa0521516 | Esophagus | ESCC | Prostate cancer | 72/4205 | 97/8465 | 6.12e-07 | 4.10e-06 | 2.10e-06 | 72 |
| hsa052028 | Esophagus | ESCC | Transcriptional misregulation in cancer | 116/4205 | 193/8465 | 2.08e-03 | 5.95e-03 | 3.05e-03 | 116 |
| hsa0516435 | Esophagus | ESCC | Influenza A | 122/4205 | 171/8465 | 5.01e-09 | 4.79e-08 | 2.45e-08 | 122 |
| hsa05171310 | Esophagus | ESCC | Coronavirus disease - COVID-19 | 156/4205 | 232/8465 | 3.18e-08 | 2.68e-07 | 1.37e-07 | 156 |
| Hugo Symbol | Variant Class | Variant Classification | dbSNP RS | HGVSc | HGVSp | HGVSp Short | SWISSPROT | BIOTYPE | SIFT | PolyPhen | Tumor Sample Barcode | Tissue | Histology | Sex | Age | Stage | Therapy Types | Drugs | Outcome |
| TMPRSS2 | insertion | Frame_Shift_Ins | novel | c.699_700insGCACCTGTAGTCACTGAGAACCCGGGGGGTGTGCC | p.Ser234AlafsTer16 | p.S234Afs*16 | O15393 | protein_coding | | | TCGA-A8-A06O-01 | Breast | breast invasive carcinoma | Female | <65 | I/II | Hormone Therapy | letrozole | SD |
| TMPRSS2 | insertion | Frame_Shift_Ins | novel | c.1563_1564insACAA | p.Tyr522ThrfsTer38 | p.Y522Tfs*38 | O15393 | protein_coding | | | TCGA-AN-A0FN-01 | Breast | breast invasive carcinoma | Female | <65 | I/II | Unknown | Unknown | SD |
| TMPRSS2 | insertion | Frame_Shift_Ins | novel | c.1561_1562insATCACTCCCTGCTTCTATCTTCAGTATCTCCTCA | p.Ile521AsnfsTer49 | p.I521Nfs*49 | O15393 | protein_coding | | | TCGA-AN-A0FN-01 | Breast | breast invasive carcinoma | Female | <65 | I/II | Unknown | Unknown | SD |
| TMPRSS2 | SNV | Missense_Mutation | rs185312677 | c.1306N>A | p.Ala436Thr | p.A436T | O15393 | protein_coding | tolerated(0.35) | possibly_damaging(0.844) | TCGA-2W-A8YY-01 | Cervix | cervical & endocervical cancer | Female | <65 | I/II | Chemotherapy | cisplatin | CR |
| TMPRSS2 | SNV | Missense_Mutation | rs375223866 | c.91N>A | p.Asp31Asn | p.D31N | O15393 | protein_coding | tolerated_low_confidence(0.08) | possibly_damaging(0.801) | TCGA-2W-A8YY-01 | Cervix | cervical & endocervical cancer | Female | <65 | I/II | Chemotherapy | cisplatin | CR |
| TMPRSS2 | SNV | Missense_Mutation | novel | c.864N>A | p.Ser288Arg | p.S288R | O15393 | protein_coding | tolerated(0.49) | benign(0.003) | TCGA-EA-A410-01 | Cervix | cervical & endocervical cancer | Female | <65 | I/II | Unknown | Unknown | SD |
| TMPRSS2 | SNV | Missense_Mutation | novel | c.1024N>T | p.Pro342Ser | p.P342S | O15393 | protein_coding | deleterious(0.01) | possibly_damaging(0.864) | TCGA-VS-A94Y-01 | Cervix | cervical & endocervical cancer | Female | <65 | I/II | Chemotherapy | cisplatin | PD |
| TMPRSS2 | SNV | Missense_Mutation | rs757262240 | c.655C>T | p.Arg219Trp | p.R219W | O15393 | protein_coding | deleterious(0.03) | benign(0.109) | TCGA-A6-5660-01 | Colorectum | colon adenocarcinoma | Male | >=65 | III/IV | Ancillary | leucovorin | SD |
| TMPRSS2 | SNV | Missense_Mutation | | c.1039G>A | p.Ala347Thr | p.A347T | O15393 | protein_coding | deleterious(0.01) | benign(0.193) | TCGA-A6-A565-01 | Colorectum | colon adenocarcinoma | Female | <65 | III/IV | Unspecific | 5FU | PD |
| TMPRSS2 | SNV | Missense_Mutation | rs757634613 | c.955G>A | p.Gly319Arg | p.G319R | O15393 | protein_coding | deleterious(0.01) | possibly_damaging(0.855) | TCGA-AA-3514-01 | Colorectum | colon adenocarcinoma | Female | >=65 | I/II | Unknown | Unknown | SD |
| Entrez ID | Symbol | Category | Interaction Types | Drug Claim Name | Drug Name | PMIDs |
| 7113 | TMPRSS2 | CLINICALLY ACTIONABLE, PROTEASE, DRUGGABLE GENOME, ENZYME | inhibitor | 178103048 | CAMOSTAT | |
| 7113 | TMPRSS2 | CLINICALLY ACTIONABLE, PROTEASE, DRUGGABLE GENOME, ENZYME | inhibitor | 252166870 | | |
| 7113 | TMPRSS2 | CLINICALLY ACTIONABLE, PROTEASE, DRUGGABLE GENOME, ENZYME | inhibitor | 405067326 | | |
| 7113 | TMPRSS2 | CLINICALLY ACTIONABLE, PROTEASE, DRUGGABLE GENOME, ENZYME | inhibitor | 178101079 | NAFAMOSTAT | |


