
|
|||||
|
 | |
| |
| |
| |
| |
| |
|
Gene: TMPRSS13 |
Gene summary for TMPRSS13 |
| Gene information | Species | Human | Gene symbol | TMPRSS13 | Gene ID | 84000 |
| Gene name | transmembrane serine protease 13 | |
| Gene Alias | MSP | |
| Cytomap | 11q23.3 | |
| Gene Type | protein-coding | GO ID | GO:0006508 | UniProtAcc | E9PRA0 |
Top |
Malignant transformation analysis |
| Identification of the aberrant gene expression in precancerous and cancerous lesions by comparing the gene expression of stem-like cells in diseased tissues with normal stem cells |
| Entrez ID | Symbol | Replicates | Species | Organ | Tissue | Adj P-value | Log2FC | Malignancy |
| 84000 | TMPRSS13 | P2T-E | Human | Esophagus | ESCC | 2.27e-04 | 7.63e-02 | 0.1177 |
| 84000 | TMPRSS13 | P4T-E | Human | Esophagus | ESCC | 1.02e-14 | 3.81e-01 | 0.1323 |
| 84000 | TMPRSS13 | P5T-E | Human | Esophagus | ESCC | 1.24e-04 | 1.01e-01 | 0.1327 |
| 84000 | TMPRSS13 | P10T-E | Human | Esophagus | ESCC | 1.62e-04 | 7.74e-02 | 0.116 |
| 84000 | TMPRSS13 | P12T-E | Human | Esophagus | ESCC | 4.42e-05 | 1.84e-01 | 0.1122 |
| 84000 | TMPRSS13 | P15T-E | Human | Esophagus | ESCC | 1.48e-03 | 1.01e-01 | 0.1149 |
| 84000 | TMPRSS13 | P22T-E | Human | Esophagus | ESCC | 7.58e-04 | 3.56e-02 | 0.1236 |
| 84000 | TMPRSS13 | P23T-E | Human | Esophagus | ESCC | 1.67e-06 | 1.76e-01 | 0.108 |
| 84000 | TMPRSS13 | P26T-E | Human | Esophagus | ESCC | 7.82e-46 | 8.62e-01 | 0.1276 |
| 84000 | TMPRSS13 | P27T-E | Human | Esophagus | ESCC | 8.16e-08 | 1.45e-01 | 0.1055 |
| 84000 | TMPRSS13 | P30T-E | Human | Esophagus | ESCC | 6.55e-07 | 3.47e-01 | 0.137 |
| 84000 | TMPRSS13 | P39T-E | Human | Esophagus | ESCC | 2.14e-03 | 9.62e-02 | 0.0894 |
| 84000 | TMPRSS13 | P47T-E | Human | Esophagus | ESCC | 4.85e-03 | 1.42e-01 | 0.1067 |
| 84000 | TMPRSS13 | P48T-E | Human | Esophagus | ESCC | 1.14e-02 | 3.98e-02 | 0.0959 |
| 84000 | TMPRSS13 | P57T-E | Human | Esophagus | ESCC | 3.25e-05 | 1.37e-01 | 0.0926 |
| 84000 | TMPRSS13 | P61T-E | Human | Esophagus | ESCC | 1.33e-05 | 1.77e-01 | 0.099 |
| 84000 | TMPRSS13 | P62T-E | Human | Esophagus | ESCC | 1.57e-02 | 1.15e-01 | 0.1302 |
| 84000 | TMPRSS13 | P74T-E | Human | Esophagus | ESCC | 1.89e-33 | 8.50e-01 | 0.1479 |
| 84000 | TMPRSS13 | P75T-E | Human | Esophagus | ESCC | 2.15e-04 | 2.22e-01 | 0.1125 |
| 84000 | TMPRSS13 | P79T-E | Human | Esophagus | ESCC | 3.28e-04 | 1.66e-01 | 0.1154 |
| Page: 1 2 |
| Tissue | Expression Dynamics | Abbreviation |
| Esophagus | 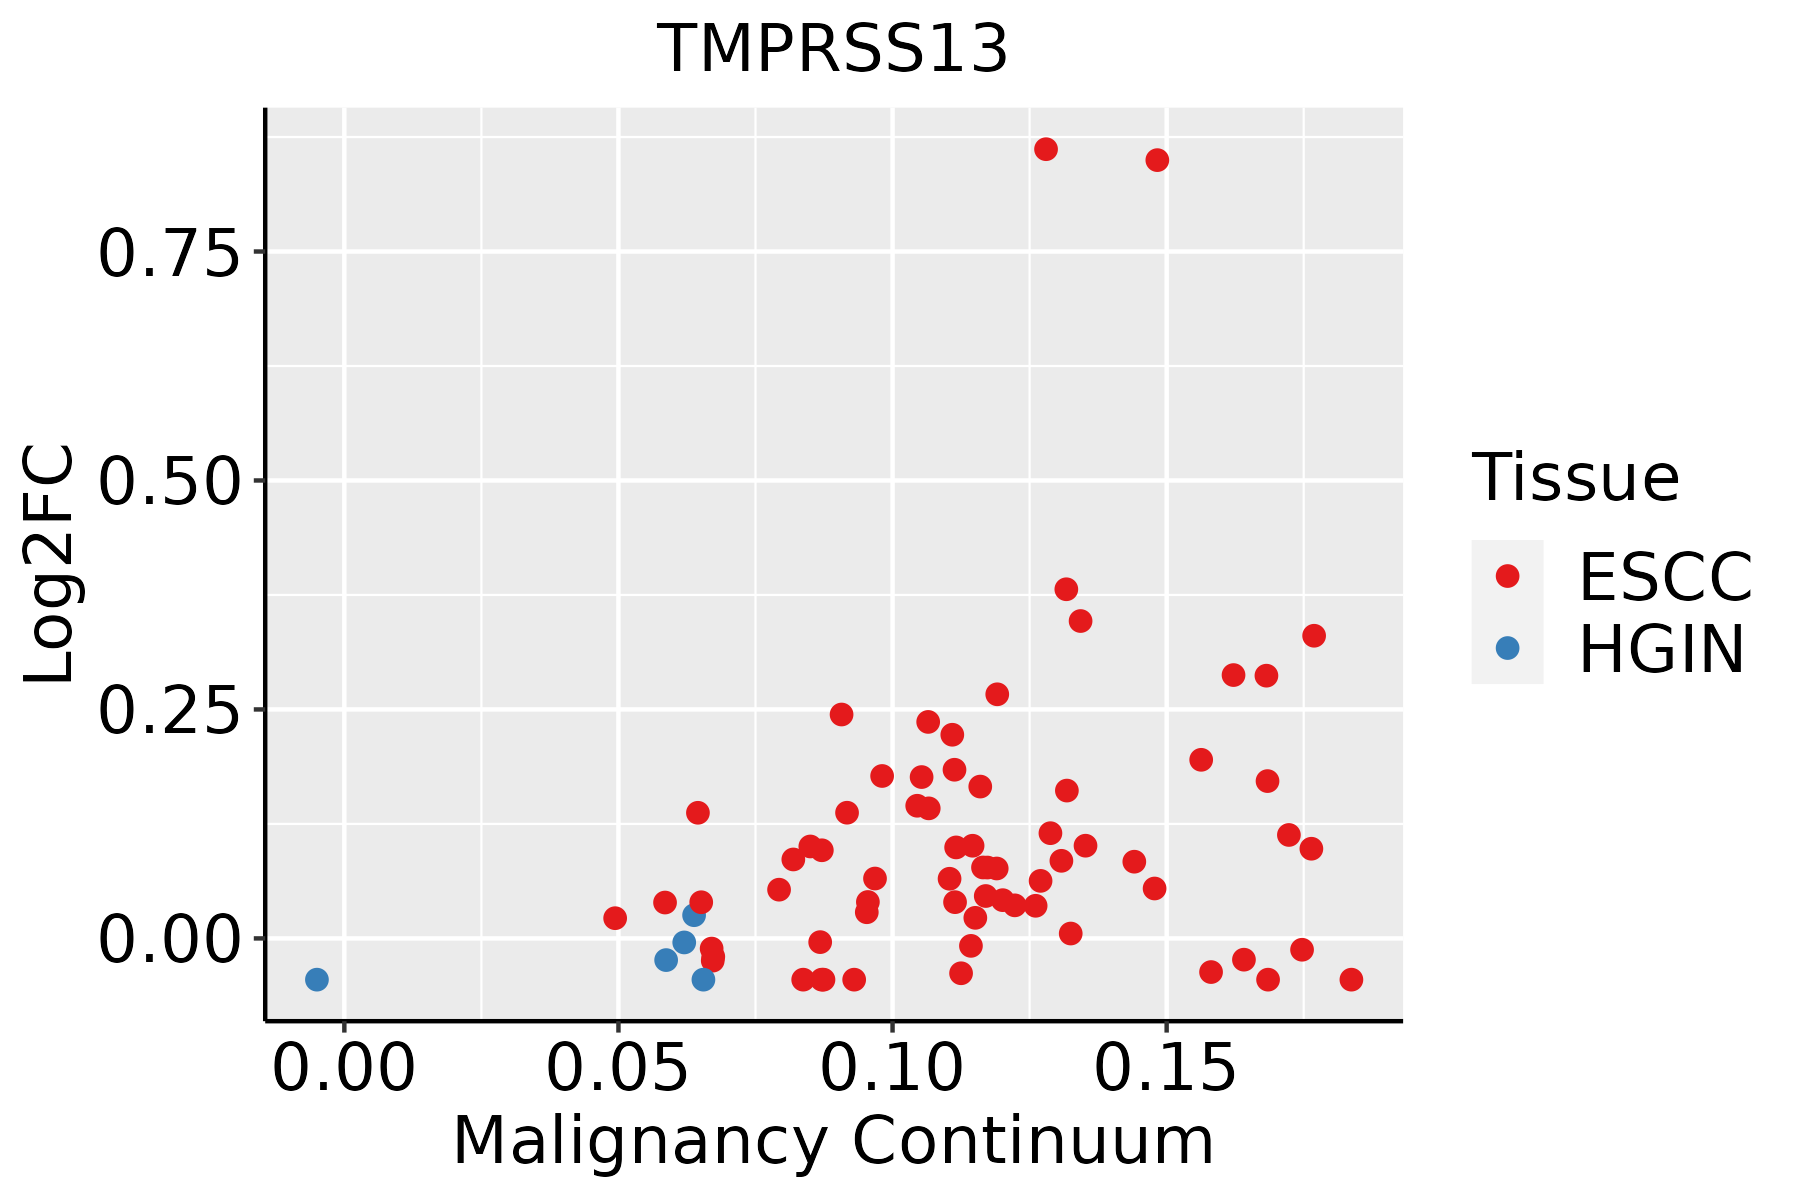 | ESCC: Esophageal squamous cell carcinoma |
| HGIN: High-grade intraepithelial neoplasias | ||
| LGIN: Low-grade intraepithelial neoplasias |
| ∗log2FC in expression of this searched gene in stem-like cells from each diseased tissue sample relative to stem-like cells in normal samples in each tissue plotted against the malignancy continuum. Samples are colored based on if they are from different disease stage. |
Top |
Malignant transformation related pathway analysis |
| Find out the enriched GO biological processes and KEGG pathways involved in transition from healthy to precancer to cancer |
| Tissue | Disease Stage | Enriched GO biological Processes |
| Colorectum | AD |  |
| Colorectum | SER |  |
| Colorectum | MSS |  |
| Colorectum | MSI-H |  |
| Colorectum | FAP |  |
| ∗Top 15 enriched GO BP terms are showed in the bar plot of each disease state in each tissue. Each row represents a significant GO biological process which is colored according to the -log10(p.adjust). |
| Page: 1 2 3 4 5 6 7 8 9 |
| GO ID | Tissue | Disease Stage | Description | Gene Ratio | Bg Ratio | pvalue | p.adjust | Count |
| Page: 1 |
| Pathway ID | Tissue | Disease Stage | Description | Gene Ratio | Bg Ratio | pvalue | p.adjust | qvalue | Count |
| Page: 1 |
Top |
Cell-cell communication analysis |
| Identification of potential cell-cell interactions between two cell types and their ligand-receptor pairs for different disease states |
| Ligand | Receptor | LRpair | Pathway | Tissue | Disease Stage |
| Page: 1 |
Top |
Single-cell gene regulatory network inference analysis |
| Find out the significant the regulons (TFs) and the target genes of each regulon across cell types for different disease states |
| TF | Cell Type | Tissue | Disease Stage | Target Gene | RSS | Regulon Activity |
| ∗The dot plots of a searched regulon are shown for all cell subpopulations in each disease state of each tissue based on the regulon specific score inferred using pySCENIC and by calculating the average expression. |
| Page: 1 |
Top |
Somatic mutation of malignant transformation related genes |
| Annotation of somatic variants for genes involved in malignant transformation |
| Hugo Symbol | Variant Class | Variant Classification | dbSNP RS | HGVSc | HGVSp | HGVSp Short | SWISSPROT | BIOTYPE | SIFT | PolyPhen | Tumor Sample Barcode | Tissue | Histology | Sex | Age | Stage | Therapy Types | Drugs | Outcome |
| TMPRSS13 | SNV | Missense_Mutation | c.1595G>C | p.Gly532Ala | p.G532A | protein_coding | deleterious(0) | probably_damaging(1) | TCGA-A8-A076-01 | Breast | breast invasive carcinoma | Female | >=65 | I/II | Hormone Therapy | anastrozole | SD | ||
| TMPRSS13 | SNV | Missense_Mutation | novel | c.784N>C | p.Thr262Pro | p.T262P | protein_coding | deleterious(0) | possibly_damaging(0.862) | TCGA-AN-A0G0-01 | Breast | breast invasive carcinoma | Female | <65 | I/II | Unknown | Unknown | SD | |
| TMPRSS13 | SNV | Missense_Mutation | novel | c.119N>T | p.Ser40Phe | p.S40F | protein_coding | deleterious_low_confidence(0.01) | benign(0.264) | TCGA-D8-A4Z1-01 | Breast | breast invasive carcinoma | Female | >=65 | I/II | Hormone Therapy | tamoxiphen | SD | |
| TMPRSS13 | SNV | Missense_Mutation | novel | c.1557N>C | p.Gln519His | p.Q519H | protein_coding | deleterious(0.02) | possibly_damaging(0.747) | TCGA-DG-A2KM-01 | Cervix | cervical & endocervical cancer | Female | <65 | I/II | Chemotherapy | cisplatin | SD | |
| TMPRSS13 | SNV | Missense_Mutation | rs761322256 | c.130N>A | p.Ala44Thr | p.A44T | protein_coding | tolerated_low_confidence(0.07) | benign(0.022) | TCGA-A6-A565-01 | Colorectum | colon adenocarcinoma | Female | <65 | III/IV | Unspecific | 5FU | PD | |
| TMPRSS13 | SNV | Missense_Mutation | c.1241N>G | p.Asp414Gly | p.D414G | protein_coding | deleterious(0) | probably_damaging(0.956) | TCGA-AA-3715-01 | Colorectum | colon adenocarcinoma | Male | >=65 | I/II | Unknown | Unknown | PD | ||
| TMPRSS13 | SNV | Missense_Mutation | rs777748954 | c.1388C>T | p.Thr463Ile | p.T463I | protein_coding | deleterious(0.05) | possibly_damaging(0.758) | TCGA-AA-3819-01 | Colorectum | colon adenocarcinoma | Female | <65 | I/II | Unknown | Unknown | SD | |
| TMPRSS13 | SNV | Missense_Mutation | novel | c.1232N>G | p.Asp411Gly | p.D411G | protein_coding | deleterious(0.03) | possibly_damaging(0.721) | TCGA-AA-3950-01 | Colorectum | colon adenocarcinoma | Female | >=65 | I/II | Unknown | Unknown | SD | |
| TMPRSS13 | SNV | Missense_Mutation | rs773942328 | c.1426N>A | p.Asp476Asn | p.D476N | protein_coding | deleterious(0.01) | possibly_damaging(0.866) | TCGA-AA-3984-01 | Colorectum | colon adenocarcinoma | Female | <65 | I/II | Unknown | Unknown | SD | |
| TMPRSS13 | SNV | Missense_Mutation | rs745945875 | c.629N>A | p.Arg210His | p.R210H | protein_coding | tolerated(0.07) | benign(0.145) | TCGA-AZ-4313-01 | Colorectum | colon adenocarcinoma | Female | <65 | I/II | Unknown | Unknown | SD |
| Page: 1 2 3 4 5 |
Top |
Related drugs of malignant transformation related genes |
| Identification of chemicals and drugs interact with genes involved in malignant transfromation |
| (DGIdb 4.0) |
| Entrez ID | Symbol | Category | Interaction Types | Drug Claim Name | Drug Name | PMIDs |
| Page: 1 |

Copyright 2023-Present -The University of Texas Health Science Center at Houston |