
|
|||||
|
 | |
| |
| |
| |
| |
| |
|
Gene: TMPRSS11E |
Gene summary for TMPRSS11E |
| Gene information | Species | Human | Gene symbol | TMPRSS11E | Gene ID | 28983 |
| Gene name | transmembrane serine protease 11E | |
| Gene Alias | DESC1 | |
| Cytomap | 4q13.2 | |
| Gene Type | protein-coding | GO ID | GO:0003008 | UniProtAcc | Q9UL52 |
Top |
Malignant transformation analysis |
| Identification of the aberrant gene expression in precancerous and cancerous lesions by comparing the gene expression of stem-like cells in diseased tissues with normal stem cells |
| Entrez ID | Symbol | Replicates | Species | Organ | Tissue | Adj P-value | Log2FC | Malignancy |
| 28983 | TMPRSS11E | CCI_1 | Human | Cervix | CC | 4.05e-08 | 1.32e+00 | 0.528 |
| 28983 | TMPRSS11E | Tumor | Human | Cervix | CC | 5.30e-04 | 2.35e-01 | 0.1241 |
| 28983 | TMPRSS11E | sample3 | Human | Cervix | CC | 4.39e-14 | 3.80e-01 | 0.1387 |
| 28983 | TMPRSS11E | H2 | Human | Cervix | HSIL_HPV | 9.66e-14 | 5.28e-01 | 0.0632 |
| 28983 | TMPRSS11E | T3 | Human | Cervix | CC | 2.17e-11 | 4.20e-01 | 0.1389 |
| 28983 | TMPRSS11E | LZE4T | Human | Esophagus | ESCC | 8.35e-06 | 2.99e-01 | 0.0811 |
| 28983 | TMPRSS11E | P20T-E | Human | Esophagus | ESCC | 3.97e-02 | 1.46e-01 | 0.1124 |
| 28983 | TMPRSS11E | P37T-E | Human | Esophagus | ESCC | 4.28e-02 | 1.03e-01 | 0.1371 |
| 28983 | TMPRSS11E | P39T-E | Human | Esophagus | ESCC | 9.20e-06 | 3.11e-01 | 0.0894 |
| 28983 | TMPRSS11E | P42T-E | Human | Esophagus | ESCC | 2.20e-07 | 3.57e-01 | 0.1175 |
| 28983 | TMPRSS11E | P47T-E | Human | Esophagus | ESCC | 3.50e-02 | 2.23e-01 | 0.1067 |
| 28983 | TMPRSS11E | P49T-E | Human | Esophagus | ESCC | 4.64e-06 | 6.49e-01 | 0.1768 |
| 28983 | TMPRSS11E | P62T-E | Human | Esophagus | ESCC | 2.41e-07 | 3.55e-01 | 0.1302 |
| 28983 | TMPRSS11E | P84T-E | Human | Esophagus | ESCC | 1.34e-04 | 1.13e+00 | 0.0933 |
| 28983 | TMPRSS11E | P126T-E | Human | Esophagus | ESCC | 8.75e-03 | 2.44e-01 | 0.1125 |
| Page: 1 |
| Tissue | Expression Dynamics | Abbreviation |
| Cervix |  | CC: Cervix cancer |
| HSIL_HPV: HPV-infected high-grade squamous intraepithelial lesions | ||
| N_HPV: HPV-infected normal cervix | ||
| Esophagus | 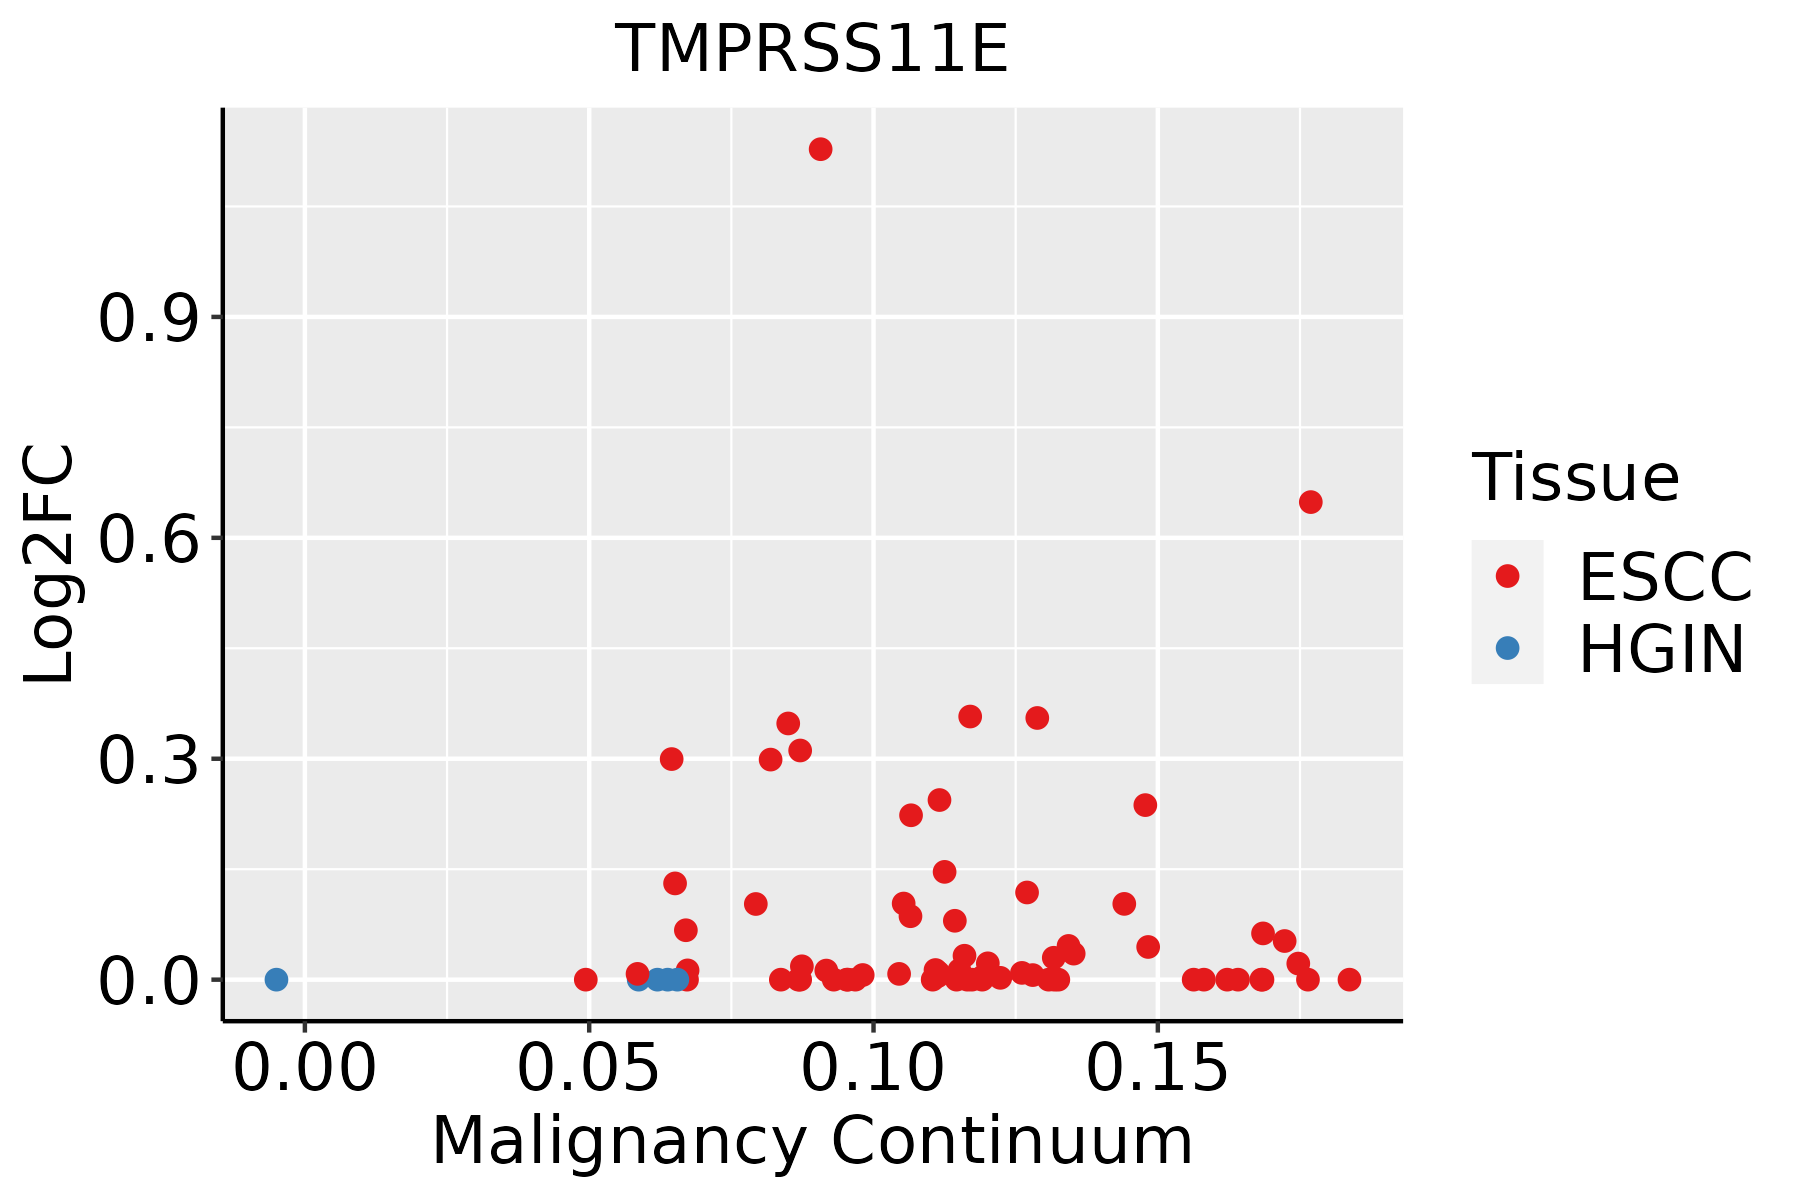 | ESCC: Esophageal squamous cell carcinoma |
| HGIN: High-grade intraepithelial neoplasias | ||
| LGIN: Low-grade intraepithelial neoplasias |
| ∗log2FC in expression of this searched gene in stem-like cells from each diseased tissue sample relative to stem-like cells in normal samples in each tissue plotted against the malignancy continuum. Samples are colored based on if they are from different disease stage. |
Top |
Malignant transformation related pathway analysis |
| Find out the enriched GO biological processes and KEGG pathways involved in transition from healthy to precancer to cancer |
| Tissue | Disease Stage | Enriched GO biological Processes |
| Colorectum | AD |  |
| Colorectum | SER |  |
| Colorectum | MSS |  |
| Colorectum | MSI-H |  |
| Colorectum | FAP |  |
| ∗Top 15 enriched GO BP terms are showed in the bar plot of each disease state in each tissue. Each row represents a significant GO biological process which is colored according to the -log10(p.adjust). |
| Page: 1 2 3 4 5 6 7 8 9 |
| GO ID | Tissue | Disease Stage | Description | Gene Ratio | Bg Ratio | pvalue | p.adjust | Count |
| Page: 1 |
| Pathway ID | Tissue | Disease Stage | Description | Gene Ratio | Bg Ratio | pvalue | p.adjust | qvalue | Count |
| Page: 1 |
Top |
Cell-cell communication analysis |
| Identification of potential cell-cell interactions between two cell types and their ligand-receptor pairs for different disease states |
| Ligand | Receptor | LRpair | Pathway | Tissue | Disease Stage |
| Page: 1 |
Top |
Single-cell gene regulatory network inference analysis |
| Find out the significant the regulons (TFs) and the target genes of each regulon across cell types for different disease states |
| TF | Cell Type | Tissue | Disease Stage | Target Gene | RSS | Regulon Activity |
| ∗The dot plots of a searched regulon are shown for all cell subpopulations in each disease state of each tissue based on the regulon specific score inferred using pySCENIC and by calculating the average expression. |
| Page: 1 |
Top |
Somatic mutation of malignant transformation related genes |
| Annotation of somatic variants for genes involved in malignant transformation |
| Hugo Symbol | Variant Class | Variant Classification | dbSNP RS | HGVSc | HGVSp | HGVSp Short | SWISSPROT | BIOTYPE | SIFT | PolyPhen | Tumor Sample Barcode | Tissue | Histology | Sex | Age | Stage | Therapy Types | Drugs | Outcome |
| TMPRSS11E | SNV | Missense_Mutation | c.284N>A | p.Pro95Gln | p.P95Q | Q9UL52 | protein_coding | tolerated(0.31) | benign(0.014) | TCGA-A2-A04W-01 | Breast | breast invasive carcinoma | Female | <65 | I/II | Chemotherapy | cytoxan | SD | |
| TMPRSS11E | SNV | Missense_Mutation | novel | c.851N>G | p.Ser284Cys | p.S284C | Q9UL52 | protein_coding | deleterious(0) | probably_damaging(0.914) | TCGA-BH-A0B6-01 | Breast | breast invasive carcinoma | Female | <65 | I/II | Unknown | Unknown | SD |
| TMPRSS11E | insertion | Nonsense_Mutation | novel | c.652_653insAGCTTATTGAGGGGTGAGGAAGGACTAGAAGGAAAAGGA | p.Gly218delinsGluLeuIleGluGlyTerGlyArgThrArgArgLysArgArg | p.G218delinsELIEG*GRTRRKRR | Q9UL52 | protein_coding | TCGA-A8-A06X-01 | Breast | breast invasive carcinoma | Female | >=65 | I/II | Unknown | Unknown | SD | ||
| TMPRSS11E | SNV | Missense_Mutation | novel | c.75N>G | p.Ile25Met | p.I25M | Q9UL52 | protein_coding | deleterious(0.03) | benign(0.06) | TCGA-C5-A1MH-01 | Cervix | cervical & endocervical cancer | Female | >=65 | III/IV | Chemotherapy | cisplatin | PD |
| TMPRSS11E | SNV | Missense_Mutation | c.26N>T | p.Arg9Met | p.R9M | Q9UL52 | protein_coding | tolerated(0.1) | benign(0.275) | TCGA-AA-3492-01 | Colorectum | colon adenocarcinoma | Female | >=65 | I/II | Unknown | Unknown | SD | |
| TMPRSS11E | SNV | Missense_Mutation | novel | c.778N>A | p.Leu260Ile | p.L260I | Q9UL52 | protein_coding | tolerated(0.25) | benign(0.062) | TCGA-AA-A010-01 | Colorectum | colon adenocarcinoma | Female | <65 | I/II | Chemotherapy | folinic | CR |
| TMPRSS11E | SNV | Missense_Mutation | c.410N>C | p.Ile137Thr | p.I137T | Q9UL52 | protein_coding | tolerated(0.53) | benign(0.007) | TCGA-AA-A02K-01 | Colorectum | colon adenocarcinoma | Male | <65 | III/IV | Chemotherapy | folinic | PD | |
| TMPRSS11E | SNV | Missense_Mutation | c.1150N>A | p.Asp384Asn | p.D384N | Q9UL52 | protein_coding | tolerated(0.59) | benign(0.011) | TCGA-AD-A5EJ-01 | Colorectum | colon adenocarcinoma | Female | >=65 | I/II | Unknown | Unknown | SD | |
| TMPRSS11E | SNV | Missense_Mutation | c.416N>C | p.Gln139Pro | p.Q139P | Q9UL52 | protein_coding | deleterious(0.03) | possibly_damaging(0.601) | TCGA-EI-6506-01 | Colorectum | rectum adenocarcinoma | Female | >=65 | I/II | Unknown | Unknown | SD | |
| TMPRSS11E | SNV | Missense_Mutation | rs149891396 | c.989G>A | p.Arg330Gln | p.R330Q | Q9UL52 | protein_coding | tolerated(0.15) | benign(0.031) | TCGA-EI-6917-01 | Colorectum | rectum adenocarcinoma | Male | <65 | III/IV | Chemotherapy | 5fluorouracil+oxaciplatina+l-folinian | SD |
| Page: 1 2 3 4 5 6 7 |
Top |
Related drugs of malignant transformation related genes |
| Identification of chemicals and drugs interact with genes involved in malignant transfromation |
| (DGIdb 4.0) |
| Entrez ID | Symbol | Category | Interaction Types | Drug Claim Name | Drug Name | PMIDs |
| Page: 1 |

Copyright 2023-Present -The University of Texas Health Science Center at Houston |