
|
|||||
|
 | |
| |
| |
| |
| |
| |
|
Gene: TMPRSS11A |
Gene summary for TMPRSS11A |
| Gene information | Species | Human | Gene symbol | TMPRSS11A | Gene ID | 339967 |
| Gene name | transmembrane serine protease 11A | |
| Gene Alias | ECRG1 | |
| Cytomap | 4q13.2 | |
| Gene Type | protein-coding | GO ID | GO:0006508 | UniProtAcc | A8KA85 |
Top |
Malignant transformation analysis |
| Identification of the aberrant gene expression in precancerous and cancerous lesions by comparing the gene expression of stem-like cells in diseased tissues with normal stem cells |
| Entrez ID | Symbol | Replicates | Species | Organ | Tissue | Adj P-value | Log2FC | Malignancy |
| 339967 | TMPRSS11A | CCI_1 | Human | Cervix | CC | 2.19e-03 | 8.49e-01 | 0.528 |
| 339967 | TMPRSS11A | Tumor | Human | Cervix | CC | 3.63e-03 | -1.17e-01 | 0.1241 |
| 339967 | TMPRSS11A | LZE8T | Human | Esophagus | ESCC | 4.33e-04 | 2.08e-01 | 0.067 |
| 339967 | TMPRSS11A | LZE21T | Human | Esophagus | ESCC | 4.72e-02 | 5.71e-01 | 0.0655 |
| 339967 | TMPRSS11A | P20T-E | Human | Esophagus | ESCC | 1.37e-07 | 3.27e-01 | 0.1124 |
| 339967 | TMPRSS11A | P23T-E | Human | Esophagus | ESCC | 2.84e-03 | 3.16e-01 | 0.108 |
| 339967 | TMPRSS11A | P26T-E | Human | Esophagus | ESCC | 3.97e-04 | 1.24e-01 | 0.1276 |
| 339967 | TMPRSS11A | P27T-E | Human | Esophagus | ESCC | 4.44e-08 | 2.34e-01 | 0.1055 |
| 339967 | TMPRSS11A | P42T-E | Human | Esophagus | ESCC | 5.21e-08 | 5.30e-01 | 0.1175 |
| 339967 | TMPRSS11A | P48T-E | Human | Esophagus | ESCC | 2.05e-07 | 2.42e-01 | 0.0959 |
| 339967 | TMPRSS11A | P62T-E | Human | Esophagus | ESCC | 6.80e-03 | 1.81e-01 | 0.1302 |
| 339967 | TMPRSS11A | P80T-E | Human | Esophagus | ESCC | 3.96e-07 | 4.77e-01 | 0.155 |
| 339967 | TMPRSS11A | P127T-E | Human | Esophagus | ESCC | 2.12e-02 | 1.51e-01 | 0.0826 |
| 339967 | TMPRSS11A | P128T-E | Human | Esophagus | ESCC | 3.99e-08 | 4.17e-01 | 0.1241 |
| 339967 | TMPRSS11A | C57 | Human | Oral cavity | OSCC | 3.91e-22 | 9.39e-01 | 0.1679 |
| 339967 | TMPRSS11A | LN22 | Human | Oral cavity | OSCC | 3.04e-04 | 1.06e+00 | 0.1733 |
| Page: 1 |
| Tissue | Expression Dynamics | Abbreviation |
| Cervix | 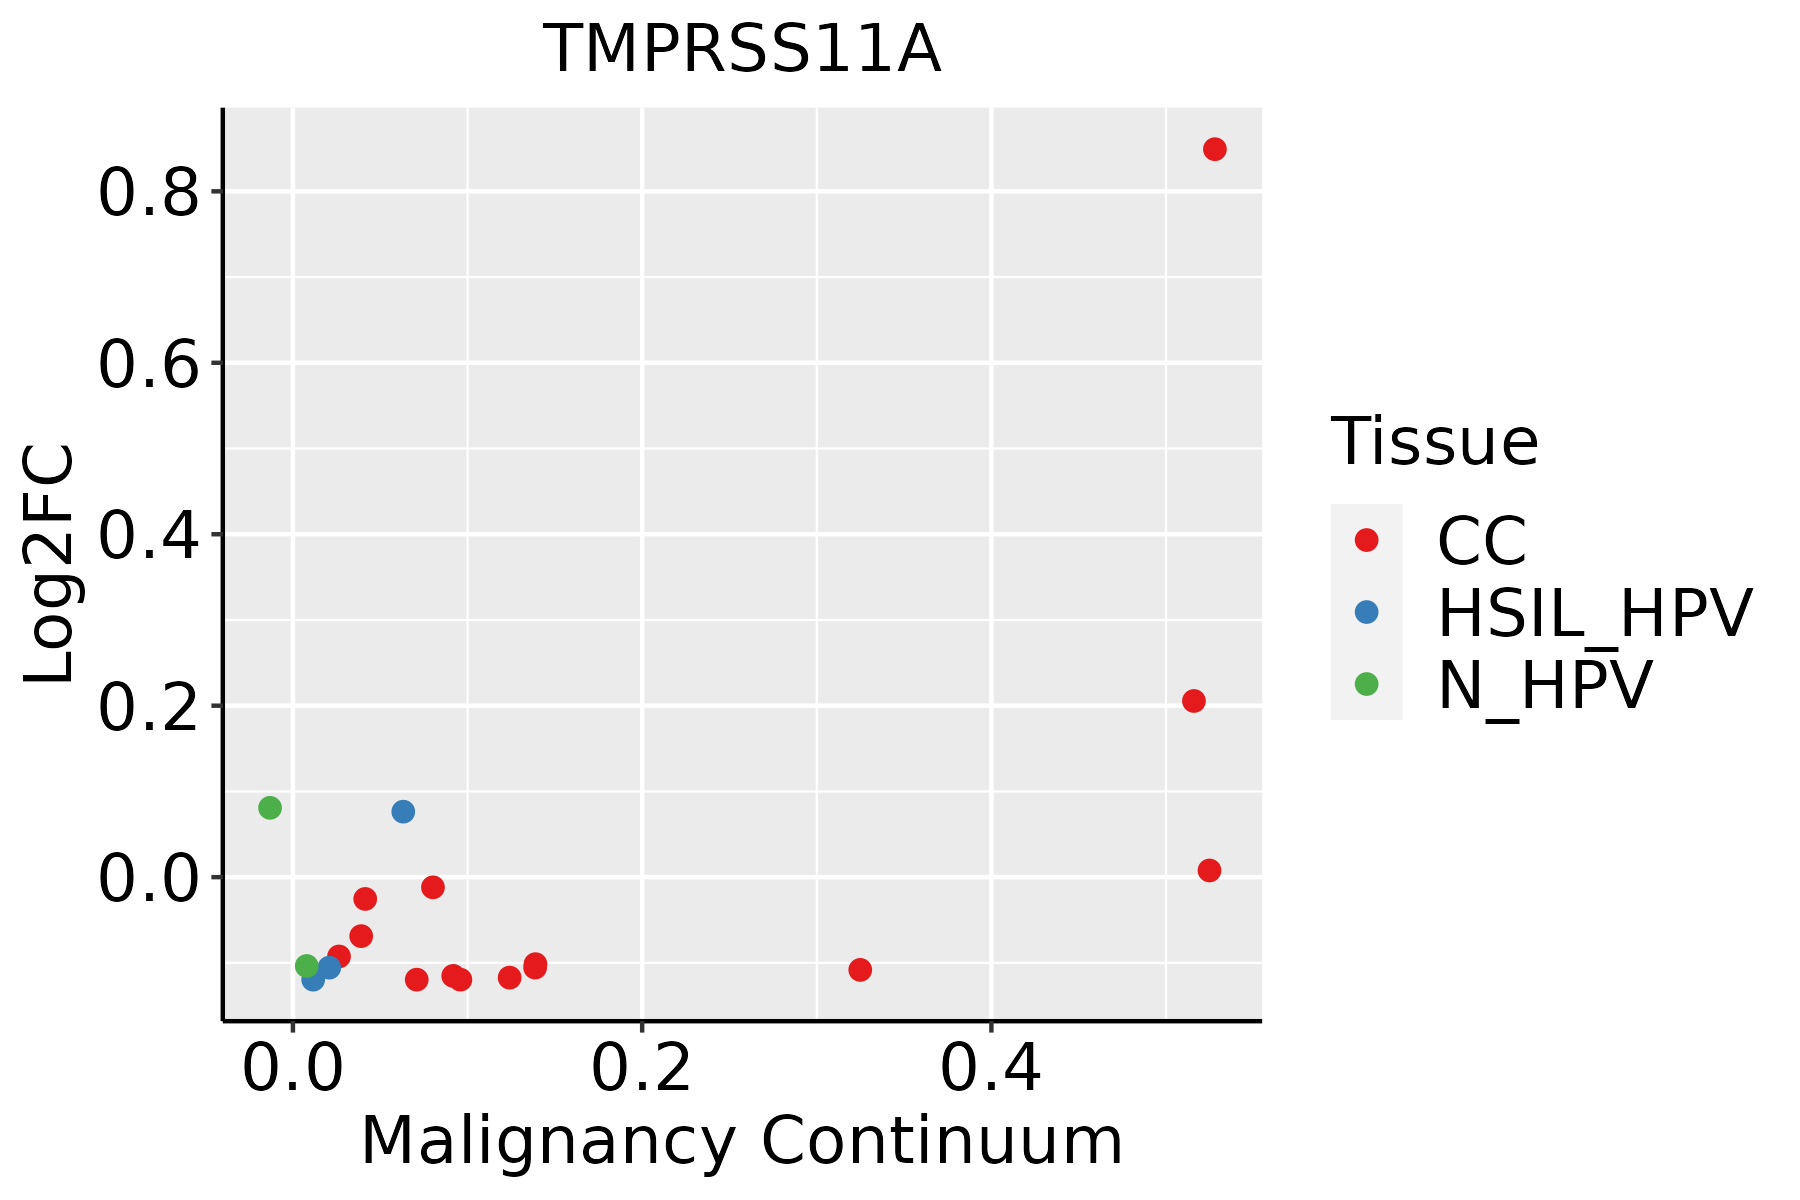 | CC: Cervix cancer |
| HSIL_HPV: HPV-infected high-grade squamous intraepithelial lesions | ||
| N_HPV: HPV-infected normal cervix | ||
| Esophagus | 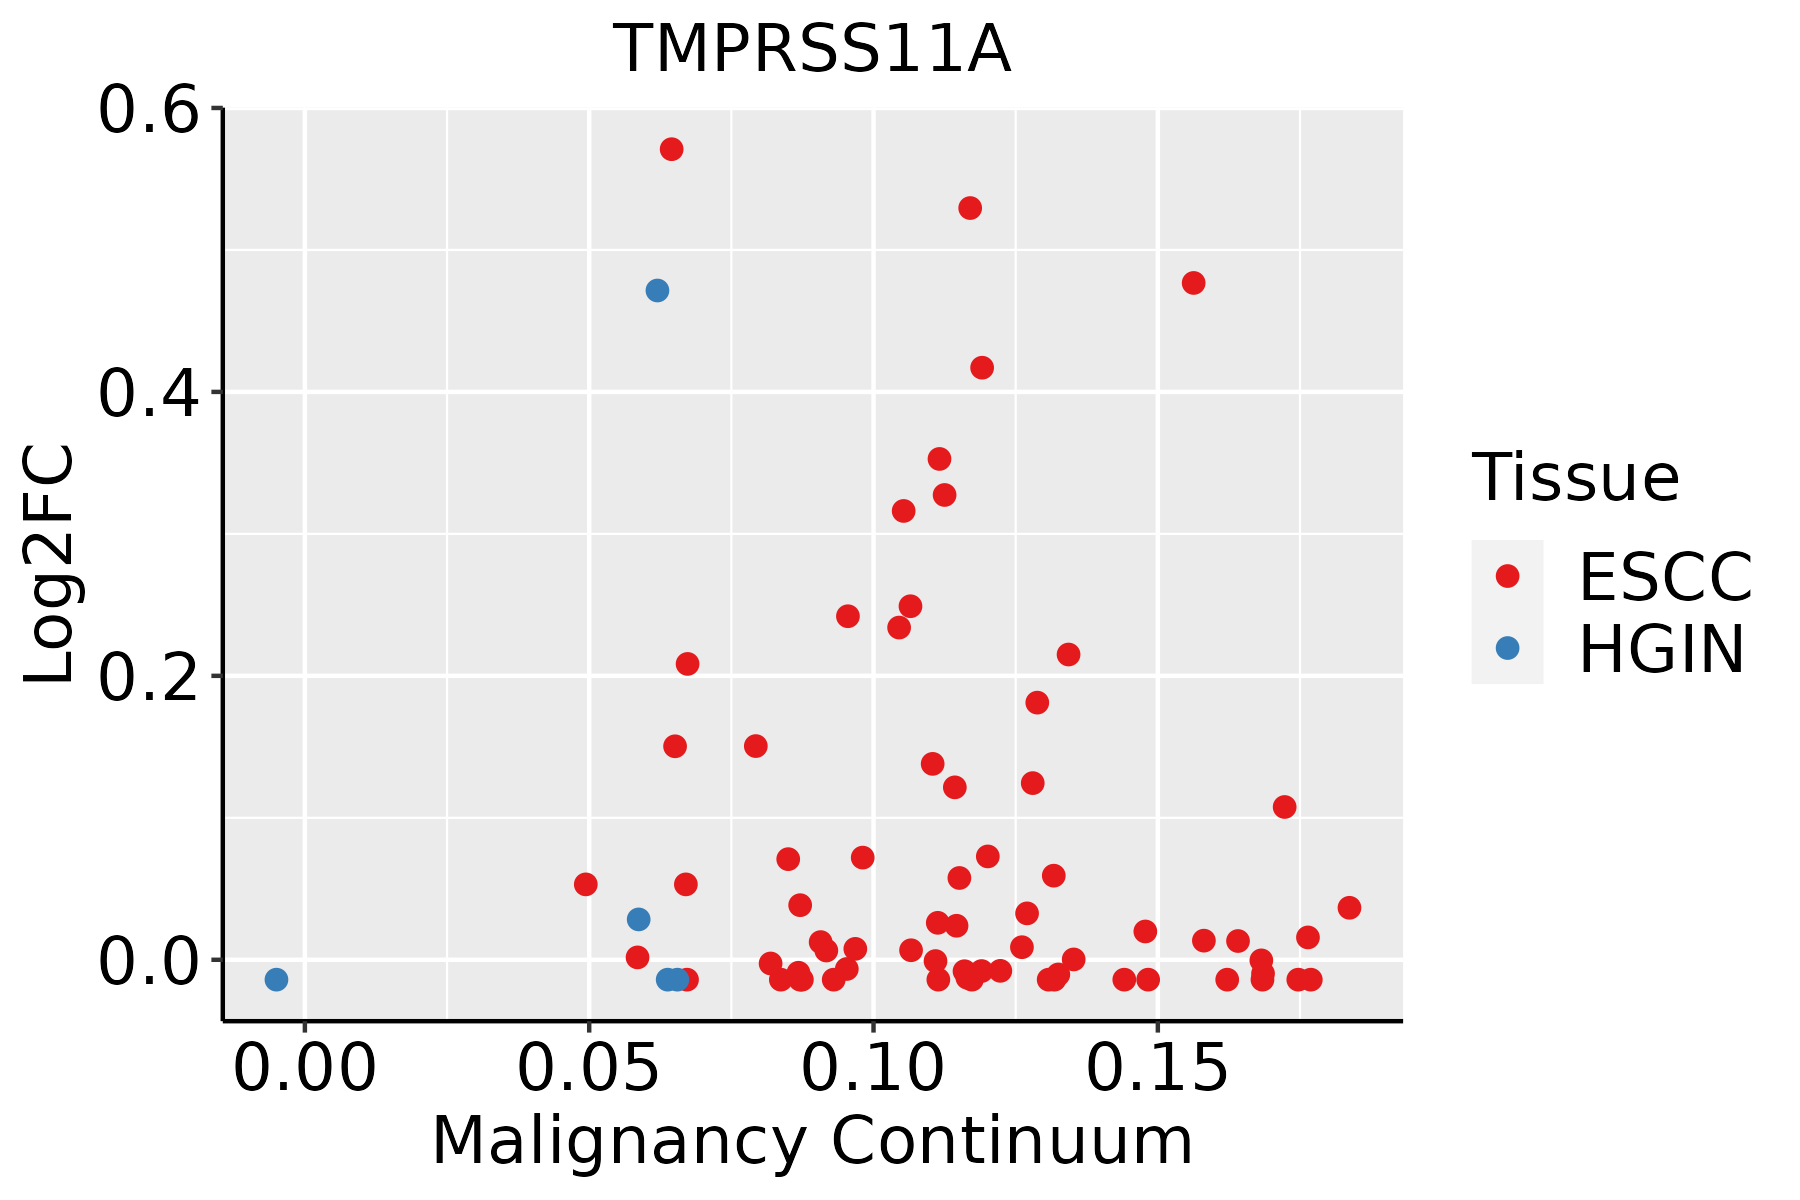 | ESCC: Esophageal squamous cell carcinoma |
| HGIN: High-grade intraepithelial neoplasias | ||
| LGIN: Low-grade intraepithelial neoplasias | ||
| Oral Cavity |  | EOLP: Erosive Oral lichen planus |
| LP: leukoplakia | ||
| NEOLP: Non-erosive oral lichen planus | ||
| OSCC: Oral squamous cell carcinoma |
| ∗log2FC in expression of this searched gene in stem-like cells from each diseased tissue sample relative to stem-like cells in normal samples in each tissue plotted against the malignancy continuum. Samples are colored based on if they are from different disease stage. |
Top |
Malignant transformation related pathway analysis |
| Find out the enriched GO biological processes and KEGG pathways involved in transition from healthy to precancer to cancer |
| Tissue | Disease Stage | Enriched GO biological Processes |
| Colorectum | AD |  |
| Colorectum | SER |  |
| Colorectum | MSS |  |
| Colorectum | MSI-H |  |
| Colorectum | FAP |  |
| ∗Top 15 enriched GO BP terms are showed in the bar plot of each disease state in each tissue. Each row represents a significant GO biological process which is colored according to the -log10(p.adjust). |
| Page: 1 2 3 4 5 6 7 8 9 |
| GO ID | Tissue | Disease Stage | Description | Gene Ratio | Bg Ratio | pvalue | p.adjust | Count |
| Page: 1 |
| Pathway ID | Tissue | Disease Stage | Description | Gene Ratio | Bg Ratio | pvalue | p.adjust | qvalue | Count |
| Page: 1 |
Top |
Cell-cell communication analysis |
| Identification of potential cell-cell interactions between two cell types and their ligand-receptor pairs for different disease states |
| Ligand | Receptor | LRpair | Pathway | Tissue | Disease Stage |
| Page: 1 |
Top |
Single-cell gene regulatory network inference analysis |
| Find out the significant the regulons (TFs) and the target genes of each regulon across cell types for different disease states |
| TF | Cell Type | Tissue | Disease Stage | Target Gene | RSS | Regulon Activity |
| ∗The dot plots of a searched regulon are shown for all cell subpopulations in each disease state of each tissue based on the regulon specific score inferred using pySCENIC and by calculating the average expression. |
| Page: 1 |
Top |
Somatic mutation of malignant transformation related genes |
| Annotation of somatic variants for genes involved in malignant transformation |
| Hugo Symbol | Variant Class | Variant Classification | dbSNP RS | HGVSc | HGVSp | HGVSp Short | SWISSPROT | BIOTYPE | SIFT | PolyPhen | Tumor Sample Barcode | Tissue | Histology | Sex | Age | Stage | Therapy Types | Drugs | Outcome |
| TMPRSS11A | SNV | Missense_Mutation | c.921N>C | p.Leu307Phe | p.L307F | protein_coding | deleterious(0) | benign(0.373) | TCGA-A8-A094-01 | Breast | breast invasive carcinoma | Female | >=65 | I/II | Unknown | Unknown | SD | ||
| TMPRSS11A | SNV | Missense_Mutation | c.1178G>A | p.Gly393Glu | p.G393E | protein_coding | deleterious(0) | probably_damaging(1) | TCGA-AN-A046-01 | Breast | breast invasive carcinoma | Female | >=65 | I/II | Unknown | Unknown | SD | ||
| TMPRSS11A | SNV | Missense_Mutation | rs757090282 | c.863C>T | p.Ser288Leu | p.S288L | protein_coding | deleterious(0) | possibly_damaging(0.475) | TCGA-AN-A046-01 | Breast | breast invasive carcinoma | Female | >=65 | I/II | Unknown | Unknown | SD | |
| TMPRSS11A | SNV | Missense_Mutation | c.116N>C | p.Val39Ala | p.V39A | protein_coding | tolerated(0.42) | benign(0.003) | TCGA-D8-A1XQ-01 | Breast | breast invasive carcinoma | Female | >=65 | I/II | Unknown | Unknown | SD | ||
| TMPRSS11A | insertion | Nonsense_Mutation | novel | c.136_137insTGTCATGCCAAGAAATGCCACACTAAACAGACTCCT | p.Gln46delinsLeuSerCysGlnGluMetProHisTerThrAspSerTer | p.Q46delinsLSCQEMPH*TDS* | protein_coding | TCGA-AQ-A04J-01 | Breast | breast invasive carcinoma | Female | <65 | I/II | Chemotherapy | cytoxan | SD | |||
| TMPRSS11A | deletion | Frame_Shift_Del | novel | c.649delN | p.Ala217ProfsTer3 | p.A217Pfs*3 | protein_coding | TCGA-D8-A27V-01 | Breast | breast invasive carcinoma | Female | <65 | I/II | Hormone Therapy | tamoxiphen | SD | |||
| TMPRSS11A | SNV | Missense_Mutation | rs753988253 | c.1118G>A | p.Gly373Glu | p.G373E | protein_coding | deleterious(0) | probably_damaging(1) | TCGA-DR-A0ZM-01 | Cervix | cervical & endocervical cancer | Female | <65 | III/IV | Unspecific | Cisplatin | SD | |
| TMPRSS11A | SNV | Missense_Mutation | c.1045N>C | p.Asp349His | p.D349H | protein_coding | tolerated(0.13) | benign(0.222) | TCGA-DS-A0VK-01 | Cervix | cervical & endocervical cancer | Female | <65 | I/II | Chemotherapy | carboplatin | PD | ||
| TMPRSS11A | SNV | Missense_Mutation | rs757090282 | c.863C>T | p.Ser288Leu | p.S288L | protein_coding | deleterious(0) | possibly_damaging(0.475) | TCGA-AA-3530-01 | Colorectum | colon adenocarcinoma | Male | >=65 | I/II | Unknown | Unknown | SD | |
| TMPRSS11A | SNV | Missense_Mutation | c.260N>G | p.Gln87Arg | p.Q87R | protein_coding | tolerated(0.21) | benign(0.354) | TCGA-AA-3672-01 | Colorectum | colon adenocarcinoma | Female | >=65 | III/IV | Unknown | Unknown | SD |
| Page: 1 2 3 4 5 6 7 8 |
Top |
Related drugs of malignant transformation related genes |
| Identification of chemicals and drugs interact with genes involved in malignant transfromation |
| (DGIdb 4.0) |
| Entrez ID | Symbol | Category | Interaction Types | Drug Claim Name | Drug Name | PMIDs |
| Page: 1 |

Copyright 2023-Present -The University of Texas Health Science Center at Houston |