
|
|||||
|
 | |
| |
| |
| |
| |
| |
|
Gene: TMOD3 |
Gene summary for TMOD3 |
| Gene information | Species | Human | Gene symbol | TMOD3 | Gene ID | 29766 |
| Gene name | tropomodulin 3 | |
| Gene Alias | UTMOD | |
| Cytomap | 15q21.2 | |
| Gene Type | protein-coding | GO ID | GO:0000278 | UniProtAcc | Q9NYL9 |
Top |
Malignant transformation analysis |
| Identification of the aberrant gene expression in precancerous and cancerous lesions by comparing the gene expression of stem-like cells in diseased tissues with normal stem cells |
| Entrez ID | Symbol | Replicates | Species | Organ | Tissue | Adj P-value | Log2FC | Malignancy |
| 29766 | TMOD3 | LZE2T | Human | Esophagus | ESCC | 7.95e-04 | 8.34e-01 | 0.082 |
| 29766 | TMOD3 | LZE4T | Human | Esophagus | ESCC | 1.91e-19 | 8.00e-01 | 0.0811 |
| 29766 | TMOD3 | LZE5T | Human | Esophagus | ESCC | 4.05e-04 | 9.78e-01 | 0.0514 |
| 29766 | TMOD3 | LZE7T | Human | Esophagus | ESCC | 1.49e-07 | 5.87e-01 | 0.0667 |
| 29766 | TMOD3 | LZE8T | Human | Esophagus | ESCC | 3.05e-12 | 5.22e-01 | 0.067 |
| 29766 | TMOD3 | LZE20T | Human | Esophagus | ESCC | 5.99e-09 | 3.77e-01 | 0.0662 |
| 29766 | TMOD3 | LZE22D1 | Human | Esophagus | HGIN | 3.30e-03 | 2.42e-01 | 0.0595 |
| 29766 | TMOD3 | LZE22T | Human | Esophagus | ESCC | 6.36e-05 | 4.53e-01 | 0.068 |
| 29766 | TMOD3 | LZE24T | Human | Esophagus | ESCC | 3.21e-20 | 5.56e-01 | 0.0596 |
| 29766 | TMOD3 | LZE21T | Human | Esophagus | ESCC | 3.23e-05 | 5.43e-01 | 0.0655 |
| 29766 | TMOD3 | LZE6T | Human | Esophagus | ESCC | 3.67e-09 | 7.54e-01 | 0.0845 |
| 29766 | TMOD3 | P1T-E | Human | Esophagus | ESCC | 5.09e-18 | 1.10e+00 | 0.0875 |
| 29766 | TMOD3 | P2T-E | Human | Esophagus | ESCC | 6.80e-28 | 4.10e-01 | 0.1177 |
| 29766 | TMOD3 | P4T-E | Human | Esophagus | ESCC | 5.40e-37 | 1.02e+00 | 0.1323 |
| 29766 | TMOD3 | P5T-E | Human | Esophagus | ESCC | 1.58e-44 | 8.31e-01 | 0.1327 |
| 29766 | TMOD3 | P8T-E | Human | Esophagus | ESCC | 8.45e-60 | 1.34e+00 | 0.0889 |
| 29766 | TMOD3 | P9T-E | Human | Esophagus | ESCC | 3.95e-28 | 8.37e-01 | 0.1131 |
| 29766 | TMOD3 | P10T-E | Human | Esophagus | ESCC | 6.83e-58 | 1.04e+00 | 0.116 |
| 29766 | TMOD3 | P11T-E | Human | Esophagus | ESCC | 1.56e-09 | 5.68e-01 | 0.1426 |
| 29766 | TMOD3 | P12T-E | Human | Esophagus | ESCC | 9.31e-34 | 7.48e-01 | 0.1122 |
| Page: 1 2 3 4 5 6 7 8 |
| Tissue | Expression Dynamics | Abbreviation |
| Esophagus | 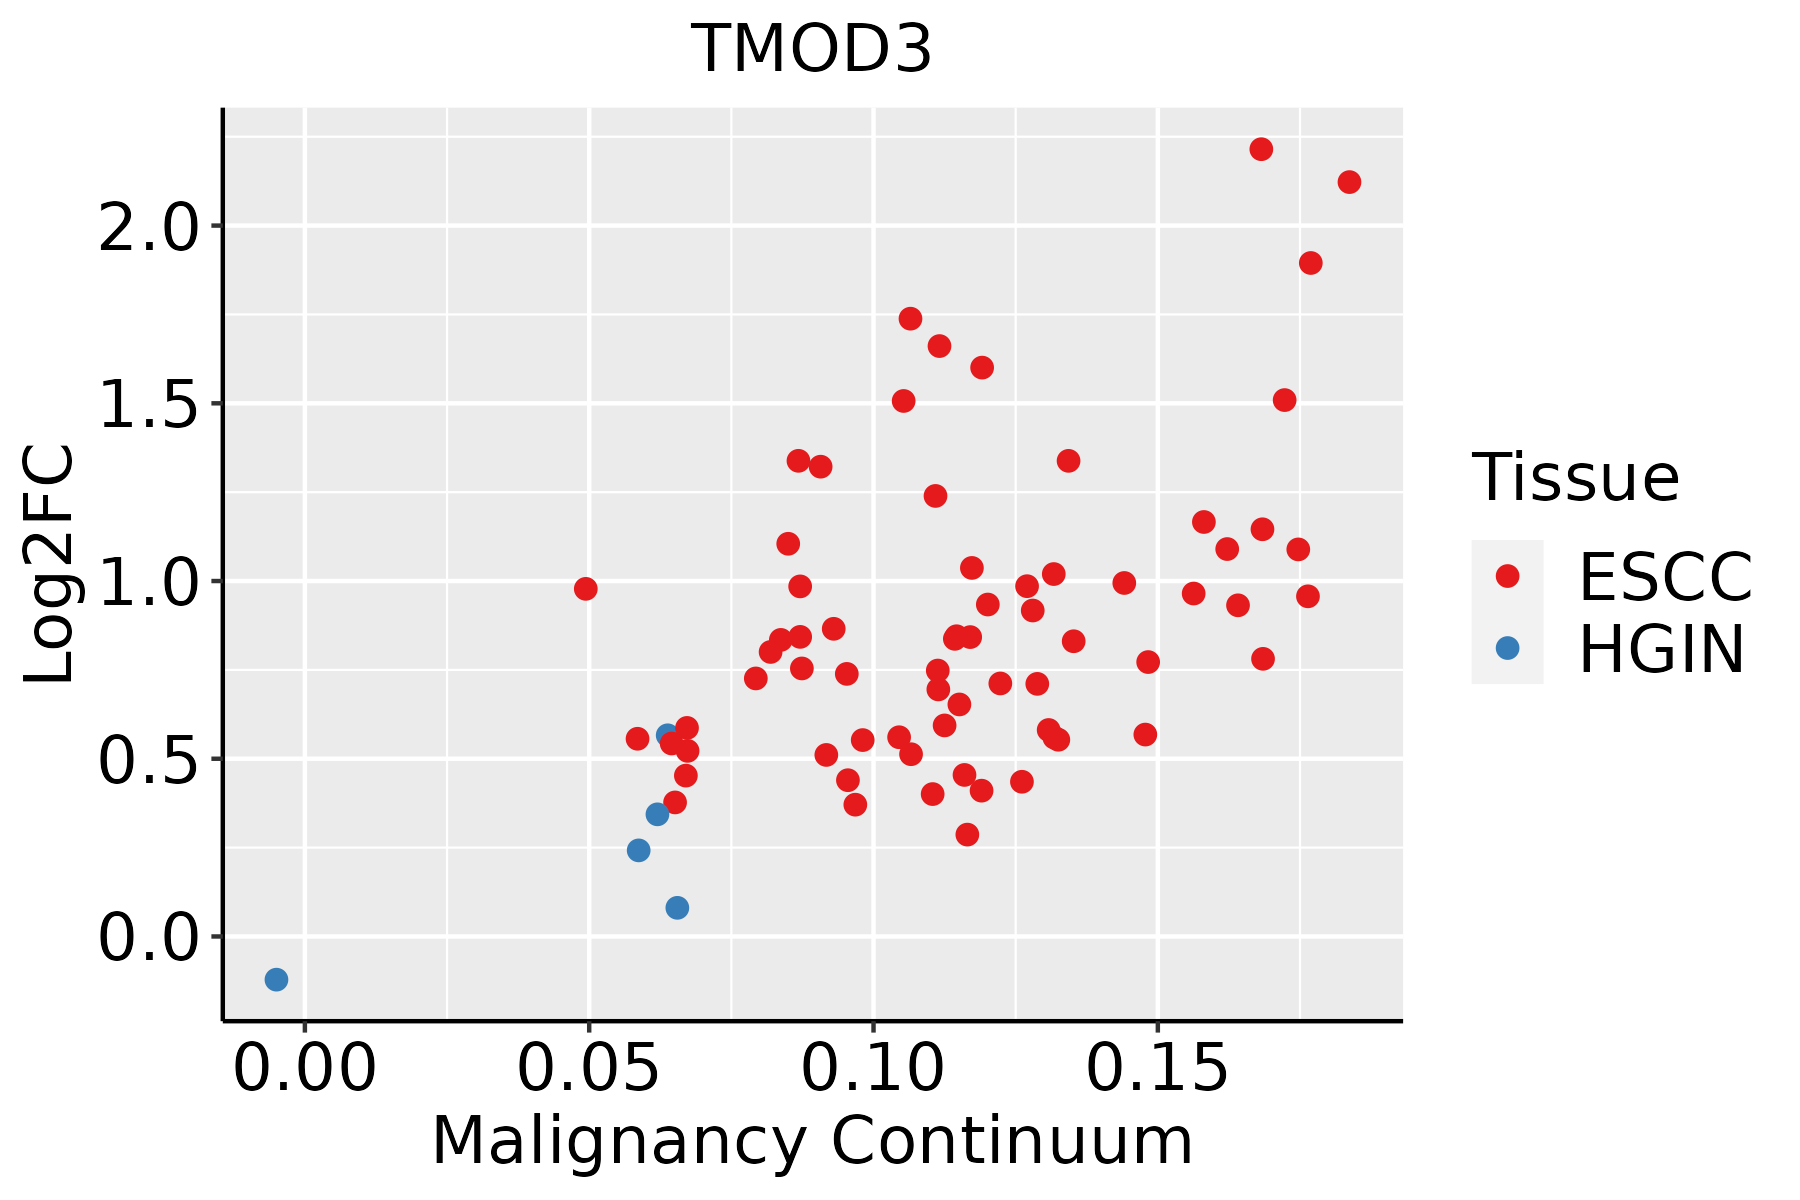 | ESCC: Esophageal squamous cell carcinoma |
| HGIN: High-grade intraepithelial neoplasias | ||
| LGIN: Low-grade intraepithelial neoplasias | ||
| Liver | 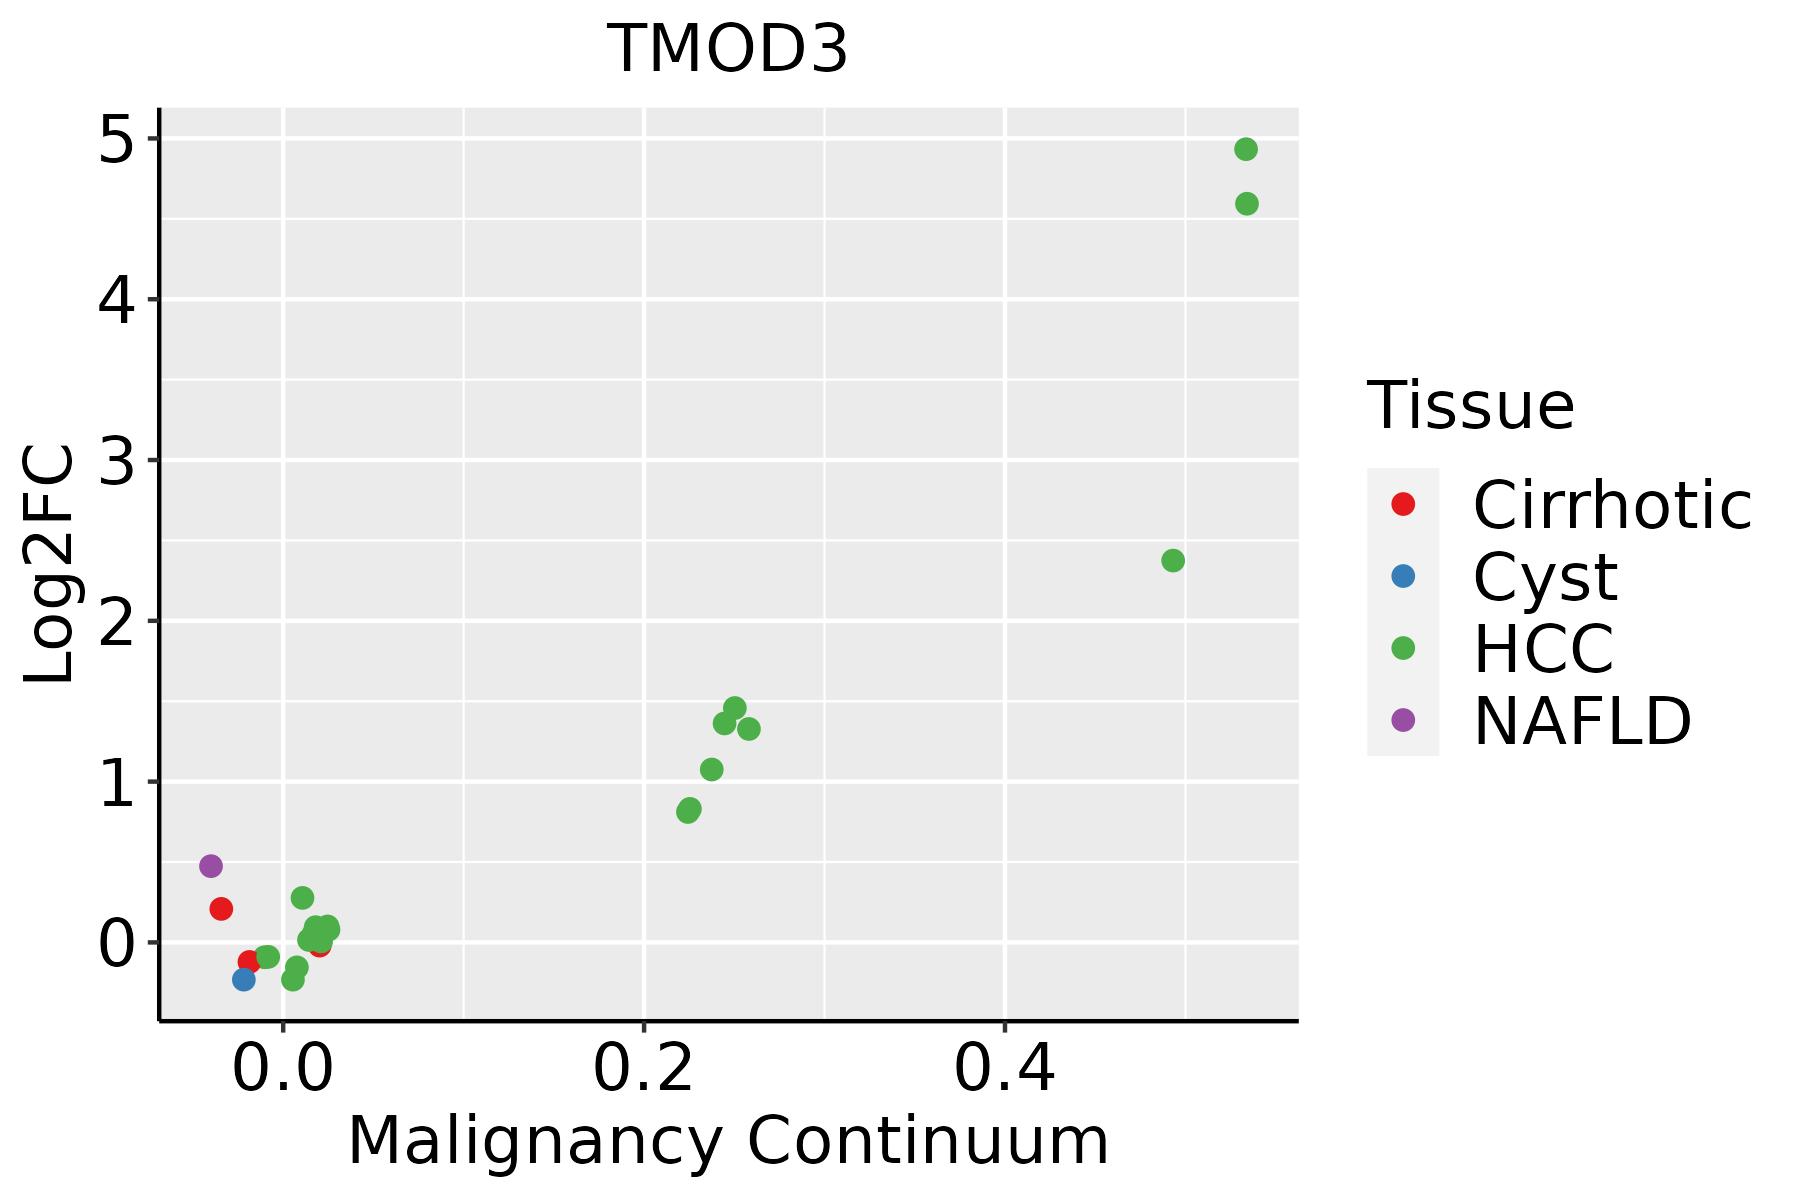 | HCC: Hepatocellular carcinoma |
| NAFLD: Non-alcoholic fatty liver disease | ||
| Lung | 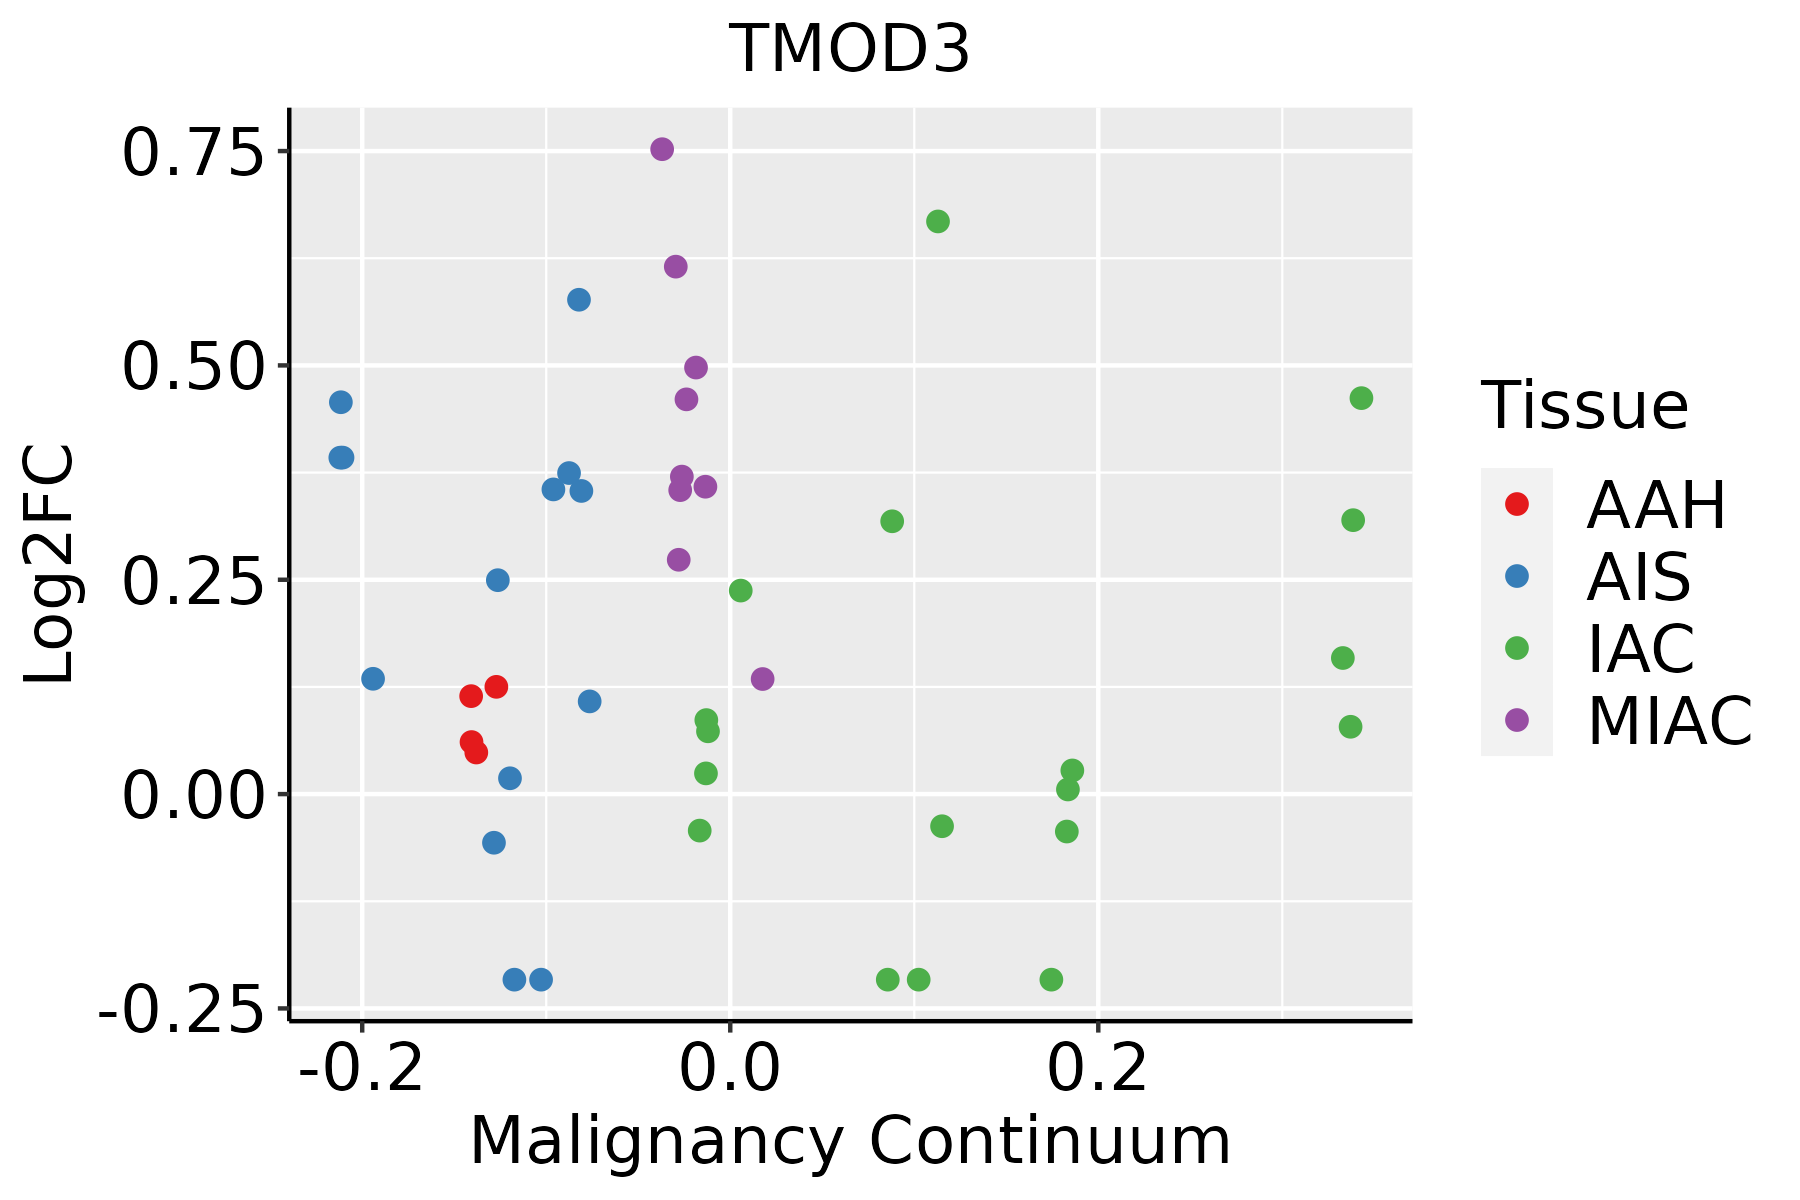 | AAH: Atypical adenomatous hyperplasia |
| AIS: Adenocarcinoma in situ | ||
| IAC: Invasive lung adenocarcinoma | ||
| MIA: Minimally invasive adenocarcinoma | ||
| Oral Cavity |  | EOLP: Erosive Oral lichen planus |
| LP: leukoplakia | ||
| NEOLP: Non-erosive oral lichen planus | ||
| OSCC: Oral squamous cell carcinoma | ||
| Prostate | 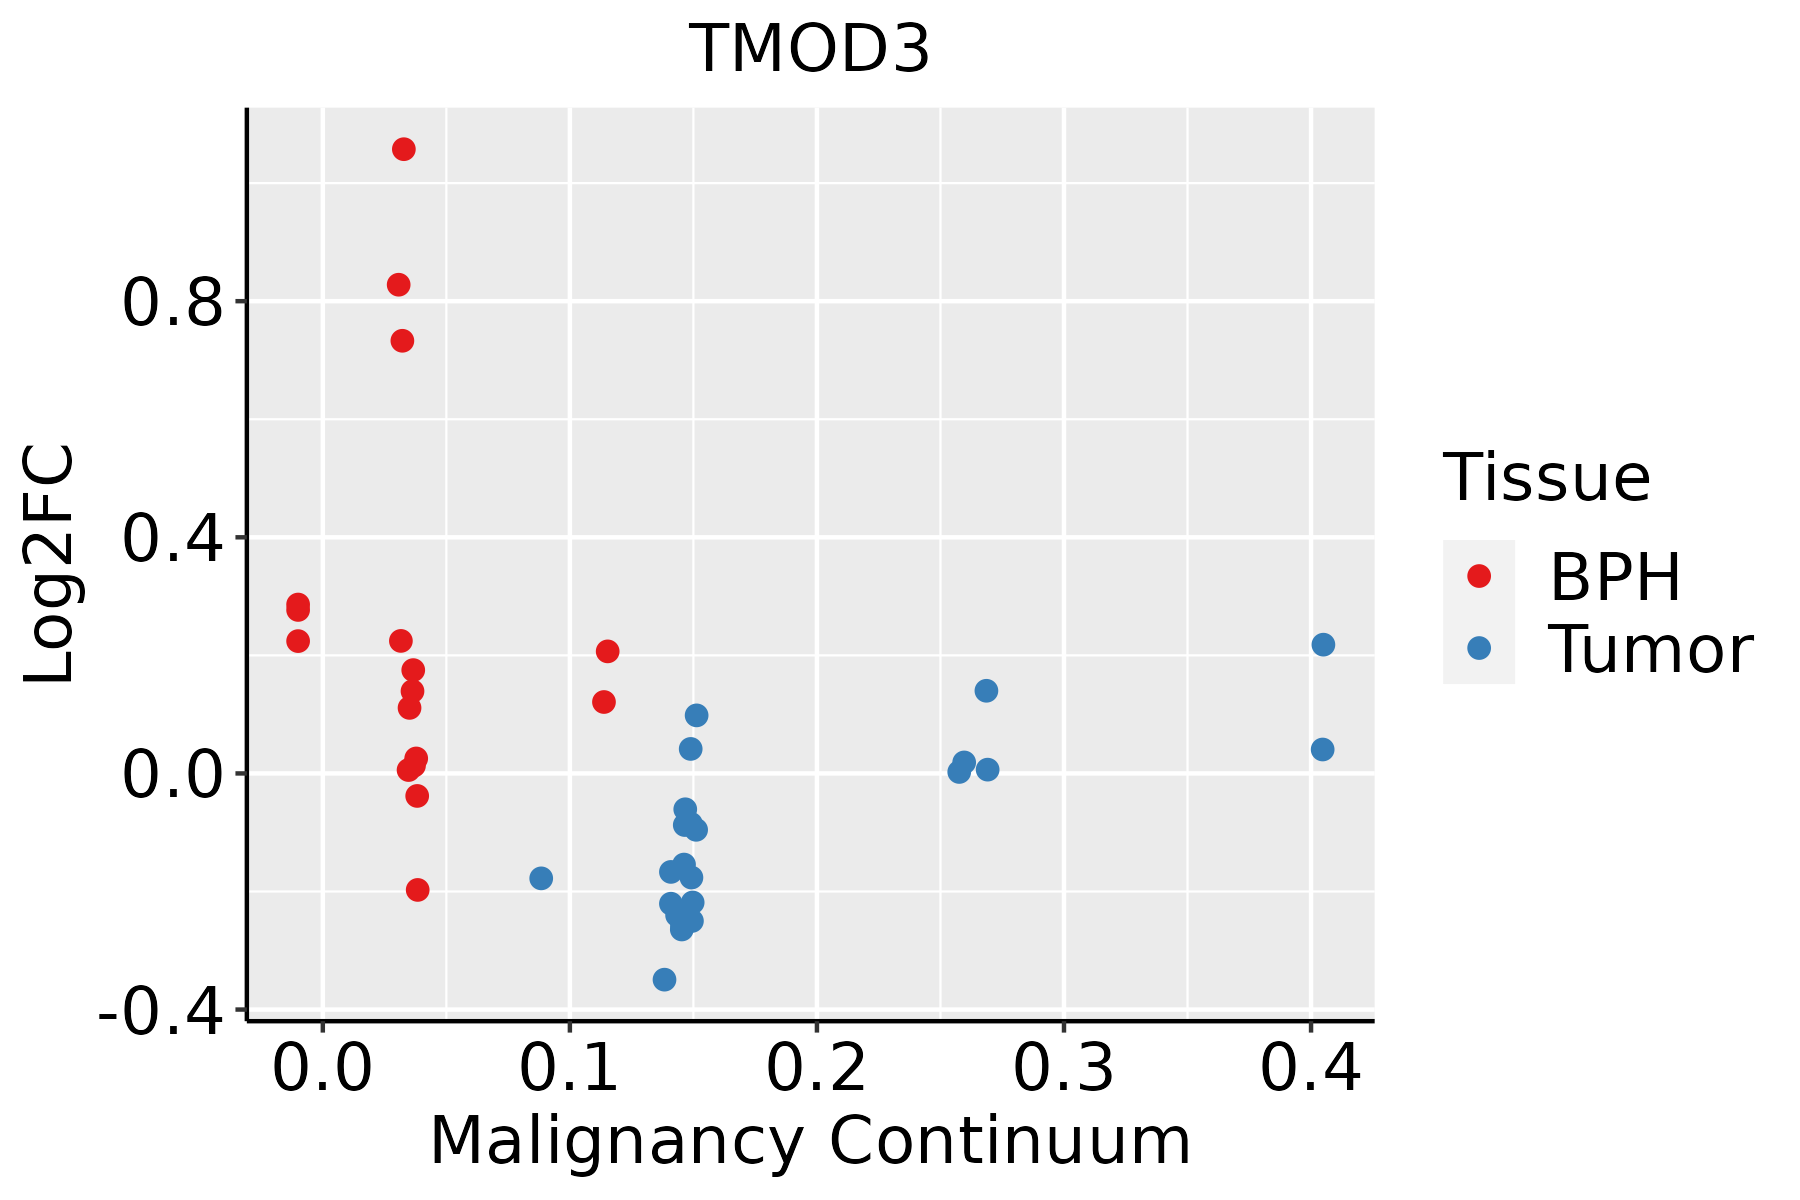 | BPH: Benign Prostatic Hyperplasia |
| Skin | 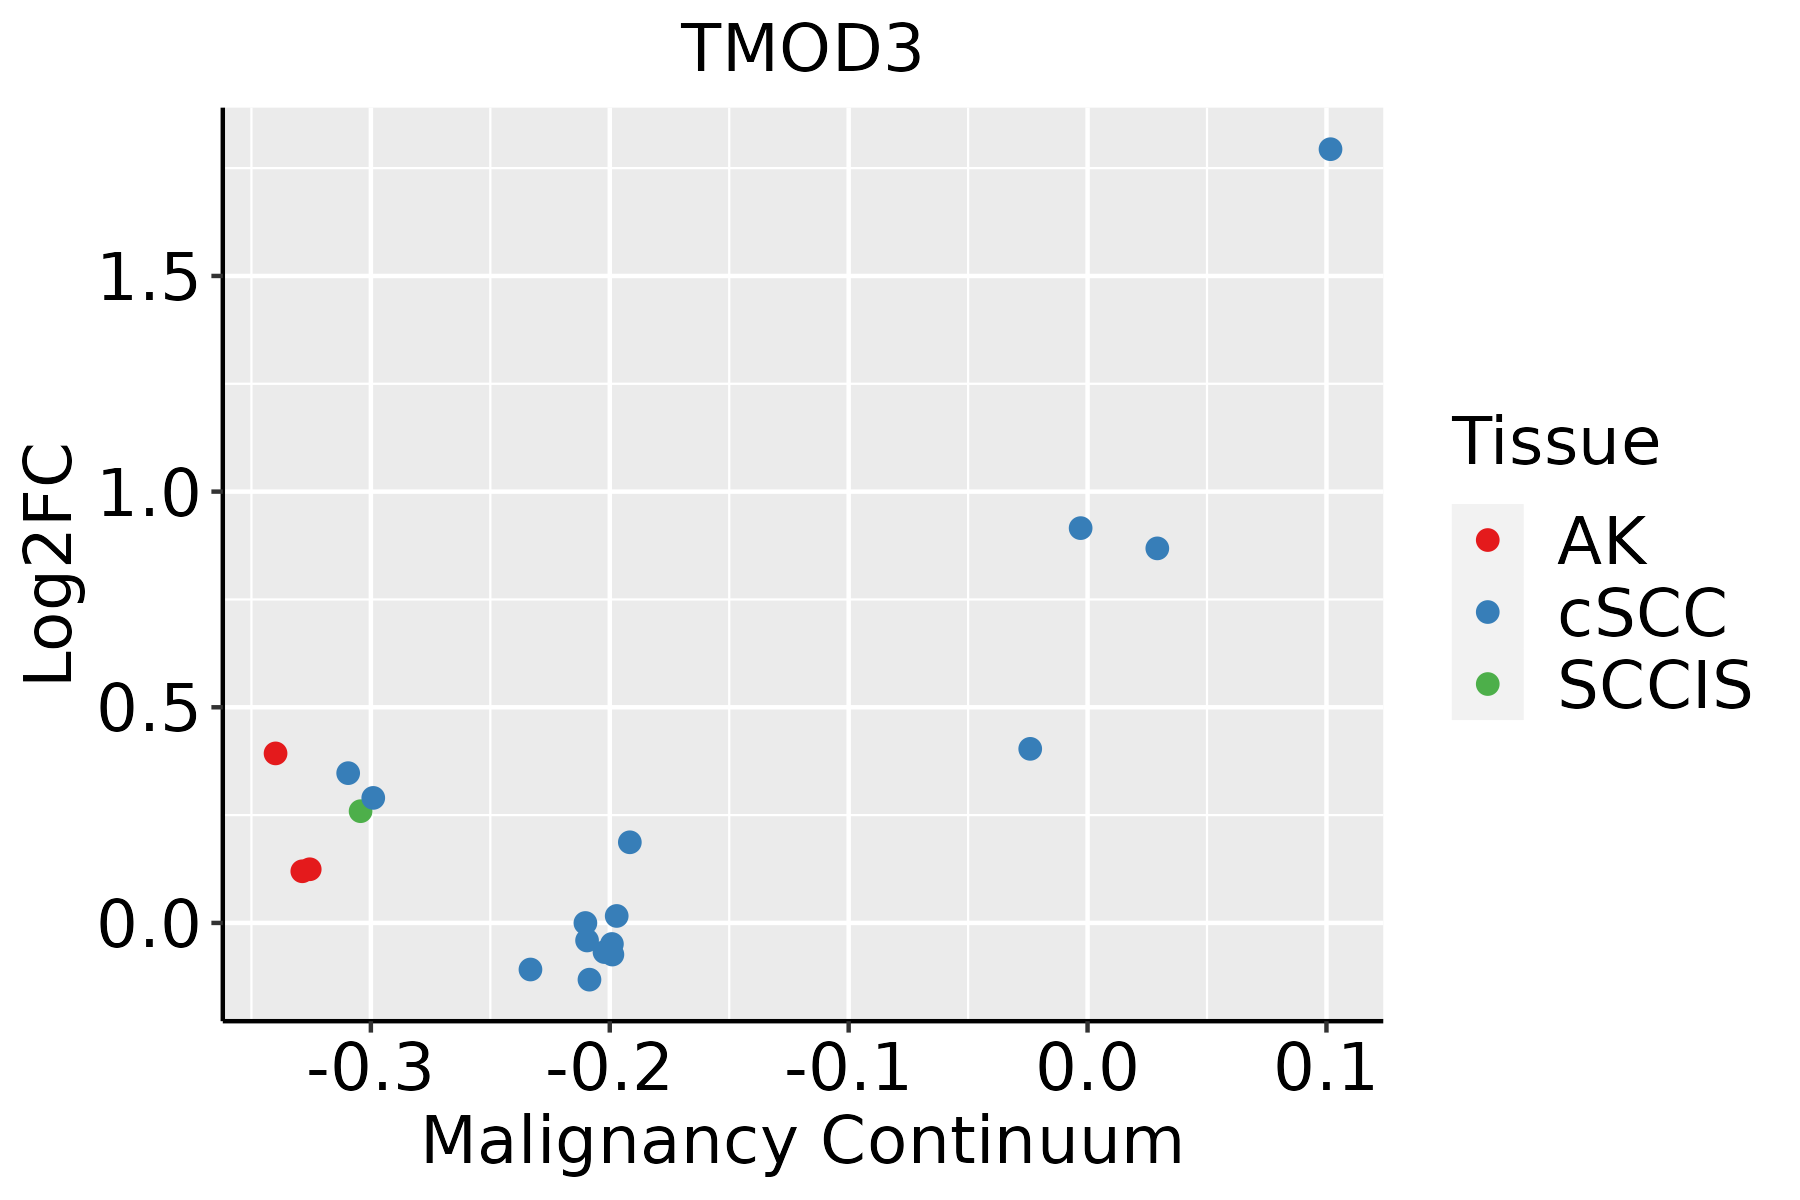 | AK: Actinic keratosis |
| cSCC: Cutaneous squamous cell carcinoma | ||
| SCCIS:squamous cell carcinoma in situ | ||
| Thyroid | 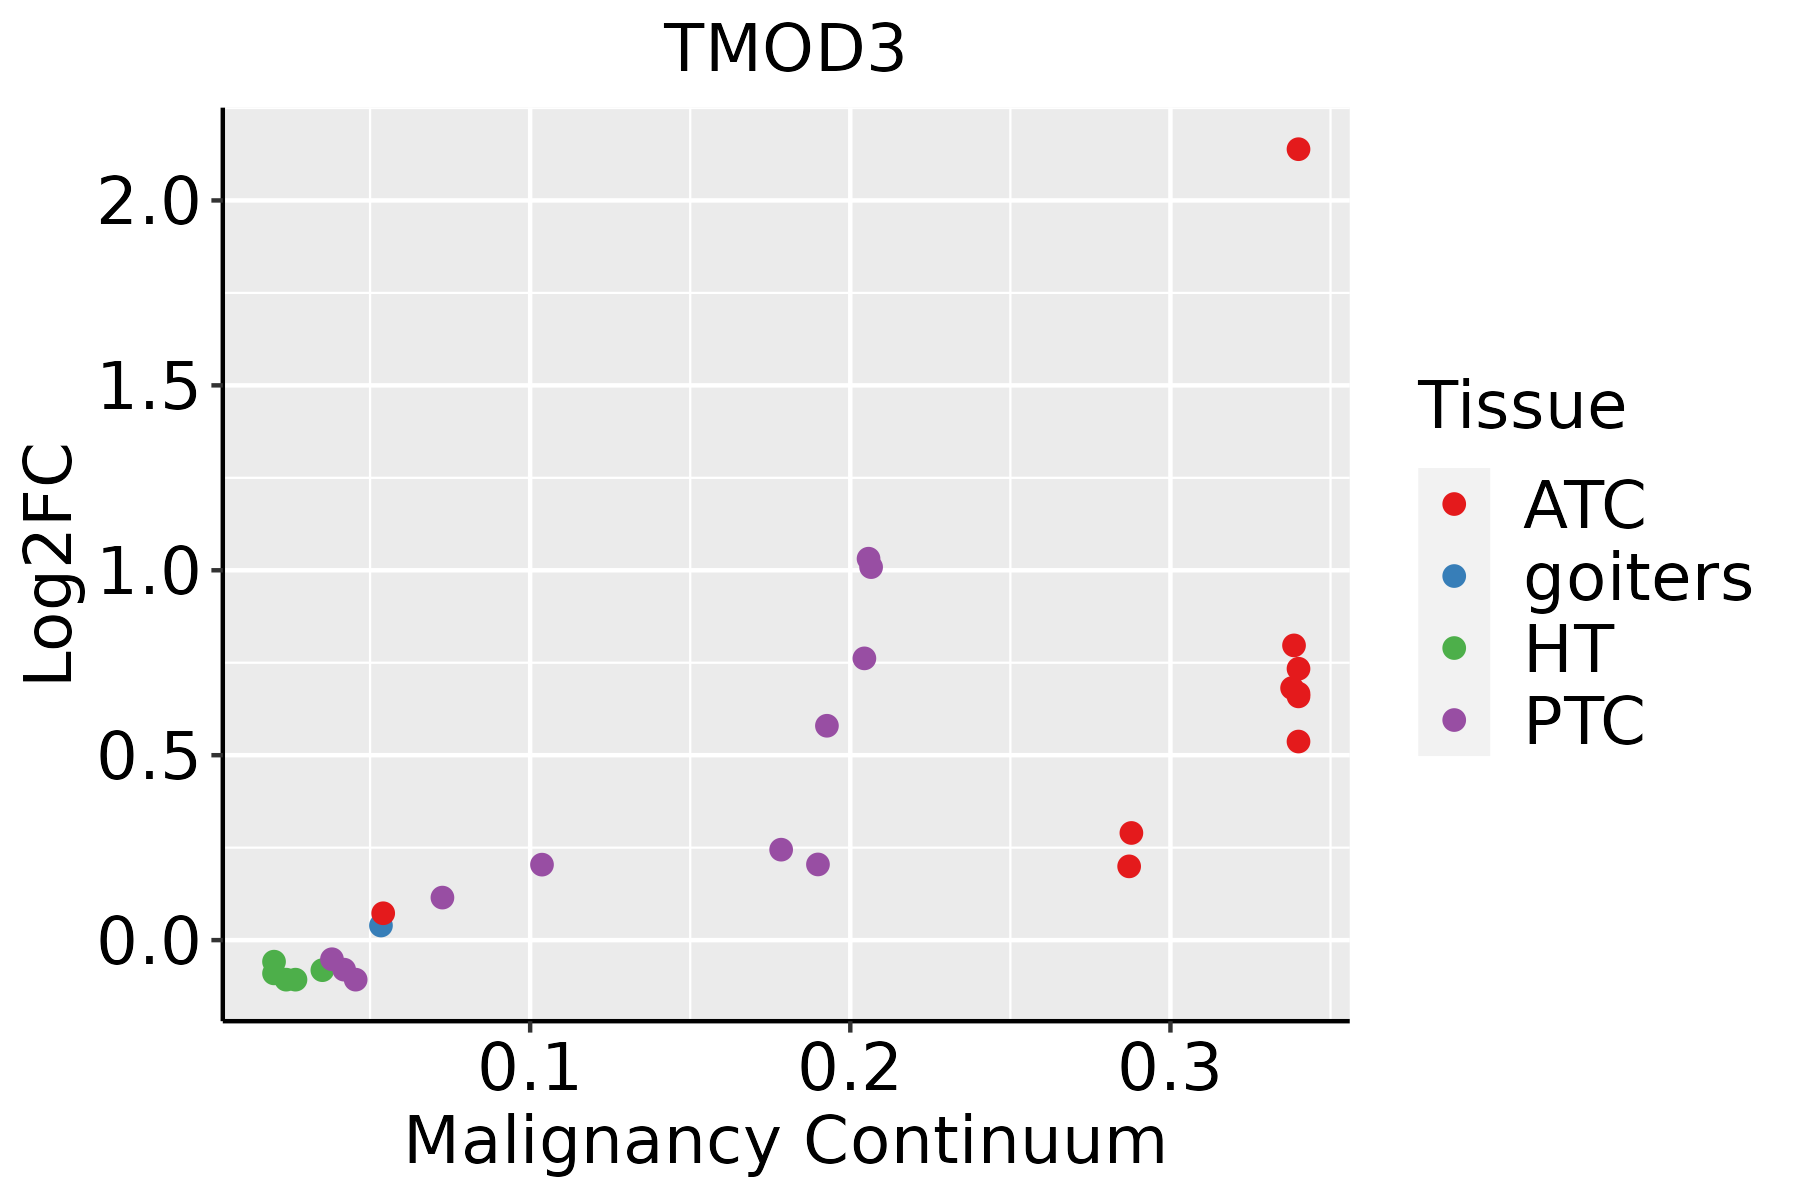 | ATC: Anaplastic thyroid cancer |
| HT: Hashimoto's thyroiditis | ||
| PTC: Papillary thyroid cancer |
| ∗log2FC in expression of this searched gene in stem-like cells from each diseased tissue sample relative to stem-like cells in normal samples in each tissue plotted against the malignancy continuum. Samples are colored based on if they are from different disease stage. |
Top |
Malignant transformation related pathway analysis |
| Find out the enriched GO biological processes and KEGG pathways involved in transition from healthy to precancer to cancer |
| Tissue | Disease Stage | Enriched GO biological Processes |
| Colorectum | AD |  |
| Colorectum | SER |  |
| Colorectum | MSS |  |
| Colorectum | MSI-H |  |
| Colorectum | FAP |  |
| ∗Top 15 enriched GO BP terms are showed in the bar plot of each disease state in each tissue. Each row represents a significant GO biological process which is colored according to the -log10(p.adjust). |
| Page: 1 2 3 4 5 6 7 8 9 |
| GO ID | Tissue | Disease Stage | Description | Gene Ratio | Bg Ratio | pvalue | p.adjust | Count |
| GO:002241120 | Esophagus | HGIN | cellular component disassembly | 102/2587 | 443/18723 | 8.31e-08 | 4.33e-06 | 102 |
| GO:004325427 | Esophagus | HGIN | regulation of protein-containing complex assembly | 94/2587 | 428/18723 | 2.39e-06 | 8.55e-05 | 94 |
| GO:001063920 | Esophagus | HGIN | negative regulation of organelle organization | 79/2587 | 348/18723 | 4.12e-06 | 1.37e-04 | 79 |
| GO:000734610 | Esophagus | HGIN | regulation of mitotic cell cycle | 98/2587 | 457/18723 | 4.39e-06 | 1.42e-04 | 98 |
| GO:003009927 | Esophagus | HGIN | myeloid cell differentiation | 83/2587 | 381/18723 | 1.26e-05 | 3.52e-04 | 83 |
| GO:00447729 | Esophagus | HGIN | mitotic cell cycle phase transition | 89/2587 | 424/18723 | 2.80e-05 | 7.21e-04 | 89 |
| GO:005125826 | Esophagus | HGIN | protein polymerization | 66/2587 | 297/18723 | 4.96e-05 | 1.19e-03 | 66 |
| GO:19019906 | Esophagus | HGIN | regulation of mitotic cell cycle phase transition | 65/2587 | 299/18723 | 1.12e-04 | 2.36e-03 | 65 |
| GO:003410127 | Esophagus | HGIN | erythrocyte homeostasis | 34/2587 | 129/18723 | 1.16e-04 | 2.43e-03 | 34 |
| GO:190290327 | Esophagus | HGIN | regulation of supramolecular fiber organization | 79/2587 | 383/18723 | 1.40e-04 | 2.81e-03 | 79 |
| GO:003021826 | Esophagus | HGIN | erythrocyte differentiation | 31/2587 | 120/18723 | 3.35e-04 | 5.50e-03 | 31 |
| GO:003298415 | Esophagus | HGIN | protein-containing complex disassembly | 50/2587 | 224/18723 | 3.43e-04 | 5.56e-03 | 50 |
| GO:000226227 | Esophagus | HGIN | myeloid cell homeostasis | 37/2587 | 157/18723 | 6.63e-04 | 9.04e-03 | 37 |
| GO:003297027 | Esophagus | HGIN | regulation of actin filament-based process | 77/2587 | 397/18723 | 1.14e-03 | 1.39e-02 | 77 |
| GO:003227126 | Esophagus | HGIN | regulation of protein polymerization | 49/2587 | 233/18723 | 1.56e-03 | 1.79e-02 | 49 |
| GO:003295627 | Esophagus | HGIN | regulation of actin cytoskeleton organization | 69/2587 | 358/18723 | 2.35e-03 | 2.39e-02 | 69 |
| GO:003133320 | Esophagus | HGIN | negative regulation of protein-containing complex assembly | 32/2587 | 141/18723 | 2.80e-03 | 2.74e-02 | 32 |
| GO:004887227 | Esophagus | HGIN | homeostasis of number of cells | 54/2587 | 272/18723 | 3.50e-03 | 3.23e-02 | 54 |
| GO:004593110 | Esophagus | HGIN | positive regulation of mitotic cell cycle | 28/2587 | 121/18723 | 3.72e-03 | 3.39e-02 | 28 |
| GO:003004120 | Esophagus | HGIN | actin filament polymerization | 40/2587 | 191/18723 | 4.29e-03 | 3.82e-02 | 40 |
| Page: 1 2 3 4 5 6 7 8 9 10 11 12 13 14 15 16 17 18 19 20 21 22 23 24 25 26 27 28 29 30 |
| Pathway ID | Tissue | Disease Stage | Description | Gene Ratio | Bg Ratio | pvalue | p.adjust | qvalue | Count |
| Page: 1 |
Top |
Cell-cell communication analysis |
| Identification of potential cell-cell interactions between two cell types and their ligand-receptor pairs for different disease states |
| Ligand | Receptor | LRpair | Pathway | Tissue | Disease Stage |
| Page: 1 |
Top |
Single-cell gene regulatory network inference analysis |
| Find out the significant the regulons (TFs) and the target genes of each regulon across cell types for different disease states |
| TF | Cell Type | Tissue | Disease Stage | Target Gene | RSS | Regulon Activity |
| ∗The dot plots of a searched regulon are shown for all cell subpopulations in each disease state of each tissue based on the regulon specific score inferred using pySCENIC and by calculating the average expression. |
| Page: 1 |
Top |
Somatic mutation of malignant transformation related genes |
| Annotation of somatic variants for genes involved in malignant transformation |
| Hugo Symbol | Variant Class | Variant Classification | dbSNP RS | HGVSc | HGVSp | HGVSp Short | SWISSPROT | BIOTYPE | SIFT | PolyPhen | Tumor Sample Barcode | Tissue | Histology | Sex | Age | Stage | Therapy Types | Drugs | Outcome |
| TMOD3 | SNV | Missense_Mutation | c.473N>A | p.Gly158Asp | p.G158D | Q9NYL9 | protein_coding | tolerated(0.64) | benign(0.007) | TCGA-A2-A25B-01 | Breast | breast invasive carcinoma | Female | <65 | I/II | Chemotherapy | taxotere | PD | |
| TMOD3 | SNV | Missense_Mutation | novel | c.871G>T | p.Asp291Tyr | p.D291Y | Q9NYL9 | protein_coding | deleterious(0) | probably_damaging(0.989) | TCGA-C5-A8ZZ-01 | Cervix | cervical & endocervical cancer | Female | <65 | I/II | Unspecific | Cisplatin | SD |
| TMOD3 | SNV | Missense_Mutation | novel | c.959N>T | p.Tyr320Phe | p.Y320F | Q9NYL9 | protein_coding | deleterious(0.02) | probably_damaging(0.997) | TCGA-AZ-4315-01 | Colorectum | colon adenocarcinoma | Male | <65 | I/II | Unknown | Unknown | SD |
| TMOD3 | SNV | Missense_Mutation | rs757302528 | c.526N>A | p.Val176Ile | p.V176I | Q9NYL9 | protein_coding | tolerated(0.24) | benign(0.012) | TCGA-CI-6622-01 | Colorectum | rectum adenocarcinoma | Male | >=65 | I/II | Chemotherapy | 5-fluorouracil | SD |
| TMOD3 | deletion | Frame_Shift_Del | rs759399045 | c.275delN | p.Ile97TyrfsTer23 | p.I97Yfs*23 | Q9NYL9 | protein_coding | TCGA-A6-6781-01 | Colorectum | colon adenocarcinoma | Male | <65 | III/IV | Chemotherapy | oxaliplatin | SD | ||
| TMOD3 | SNV | Missense_Mutation | rs746856695 | c.833N>T | p.Ala278Val | p.A278V | Q9NYL9 | protein_coding | deleterious(0) | probably_damaging(0.997) | TCGA-A5-A0GW-01 | Endometrium | uterine corpus endometrioid carcinoma | Female | <65 | I/II | Unknown | Unknown | SD |
| TMOD3 | SNV | Missense_Mutation | novel | c.343N>A | p.Leu115Ile | p.L115I | Q9NYL9 | protein_coding | deleterious(0.02) | probably_damaging(0.999) | TCGA-AJ-A3EL-01 | Endometrium | uterine corpus endometrioid carcinoma | Female | <65 | I/II | Unknown | Unknown | SD |
| TMOD3 | SNV | Missense_Mutation | c.43C>A | p.Leu15Ile | p.L15I | Q9NYL9 | protein_coding | tolerated(1) | benign(0.107) | TCGA-AP-A051-01 | Endometrium | uterine corpus endometrioid carcinoma | Female | >=65 | I/II | Unknown | Unknown | SD | |
| TMOD3 | SNV | Missense_Mutation | c.311N>A | p.Pro104His | p.P104H | Q9NYL9 | protein_coding | deleterious(0.01) | probably_damaging(0.994) | TCGA-AP-A059-01 | Endometrium | uterine corpus endometrioid carcinoma | Female | >=65 | I/II | Unknown | Unknown | SD | |
| TMOD3 | SNV | Missense_Mutation | c.73T>C | p.Ser25Pro | p.S25P | Q9NYL9 | protein_coding | tolerated(0.05) | probably_damaging(1) | TCGA-AP-A0LM-01 | Endometrium | uterine corpus endometrioid carcinoma | Female | <65 | III/IV | Chemotherapy | cisplatin | SD |
| Page: 1 2 3 4 |
Top |
Related drugs of malignant transformation related genes |
| Identification of chemicals and drugs interact with genes involved in malignant transfromation |
| (DGIdb 4.0) |
| Entrez ID | Symbol | Category | Interaction Types | Drug Claim Name | Drug Name | PMIDs |
| Page: 1 |

Copyright 2023-Present -The University of Texas Health Science Center at Houston |