Schematic overview of the cellular and molecular mechanisms involved in the cancer progression, including the proposed cellular and molecular mechanisms in cancer cells trajectory. AT1: alveolar type 1 cells; AT2: alveolar type 2 cells; AAH: atypical adenomatous hyperplasia; AIS: adenocarcinoma in situ; MIA: minimally invasive adenocarcinoma; IA: invasive adenocarcinoma; EMT: epithelial-mesenchymal transition

Home

Download

Statistics

Help

Contact

Center for Computational Systems Medicine
leaf

Gene summary

leaf

Malignant transformation analysis

leaf

Malignant transformation related pathway analysis

leaf

Cell-cell communication analysis

leaf

Single-cell gene regulatory network inference analysis

leaf

Somatic mutation of malignant transformation related genes

leaf

Related drugs of malignant transformation related genes

Gene: TMF1

Gene summary for TMF1

check button Gene summary.

Gene informationSpeciesHuman
Gene symbol

TMF1

Gene ID

7110

Gene nameTATA element modulatory factor 1
Gene AliasARA160
Cytomap3p14.1
Gene Typeprotein-coding
GO ID

GO:0000003

UniProtAcc

A0A024R370


Top

Malignant transformation analysis

check button Identification of the aberrant gene expression in precancerous and cancerous lesions by comparing the gene expression of stem-like cells in diseased tissues with normal stem cells
check button Malignant transformation involving gene list.
Entrez IDSymbolReplicatesSpeciesOrganTissueAdj P-valueLog2FCMalignancy
7110TMF1LZE4THumanEsophagusESCC1.68e-174.69e-010.0811
7110TMF1LZE5THumanEsophagusESCC6.23e-054.06e-010.0514
7110TMF1LZE7THumanEsophagusESCC4.58e-041.58e-010.0667
7110TMF1LZE24THumanEsophagusESCC1.11e-236.70e-010.0596
7110TMF1LZE21THumanEsophagusESCC1.05e-052.99e-010.0655
7110TMF1LZE6THumanEsophagusESCC9.62e-082.02e-010.0845
7110TMF1P1T-EHumanEsophagusESCC1.15e-053.86e-010.0875
7110TMF1P2T-EHumanEsophagusESCC1.53e-377.55e-010.1177
7110TMF1P4T-EHumanEsophagusESCC6.67e-287.12e-010.1323
7110TMF1P5T-EHumanEsophagusESCC1.35e-102.34e-010.1327
7110TMF1P8T-EHumanEsophagusESCC7.14e-193.63e-010.0889
7110TMF1P9T-EHumanEsophagusESCC6.56e-133.43e-010.1131
7110TMF1P10T-EHumanEsophagusESCC3.33e-194.20e-010.116
7110TMF1P11T-EHumanEsophagusESCC3.42e-135.21e-010.1426
7110TMF1P12T-EHumanEsophagusESCC6.70e-164.41e-010.1122
7110TMF1P15T-EHumanEsophagusESCC8.86e-152.87e-010.1149
7110TMF1P16T-EHumanEsophagusESCC2.80e-204.70e-010.1153
7110TMF1P17T-EHumanEsophagusESCC3.44e-053.61e-010.1278
7110TMF1P19T-EHumanEsophagusESCC9.11e-056.59e-010.1662
7110TMF1P20T-EHumanEsophagusESCC2.77e-072.38e-010.1124
Page: 1 2 3 4 5 6 7 

check button Transcriptomic changes along malignancy continuum.
TissueExpression DynamicsAbbreviation
EsophagusThe image shows the transcriptomic changes along malignancy continuum.log2FC in expression of this searched gene in stem-like cells from each diseased tissue sample relative to stem-like cells in normal samples in each tissue plotted against the malignancy continuum. Samples are colored based on if they are from different disease stage.
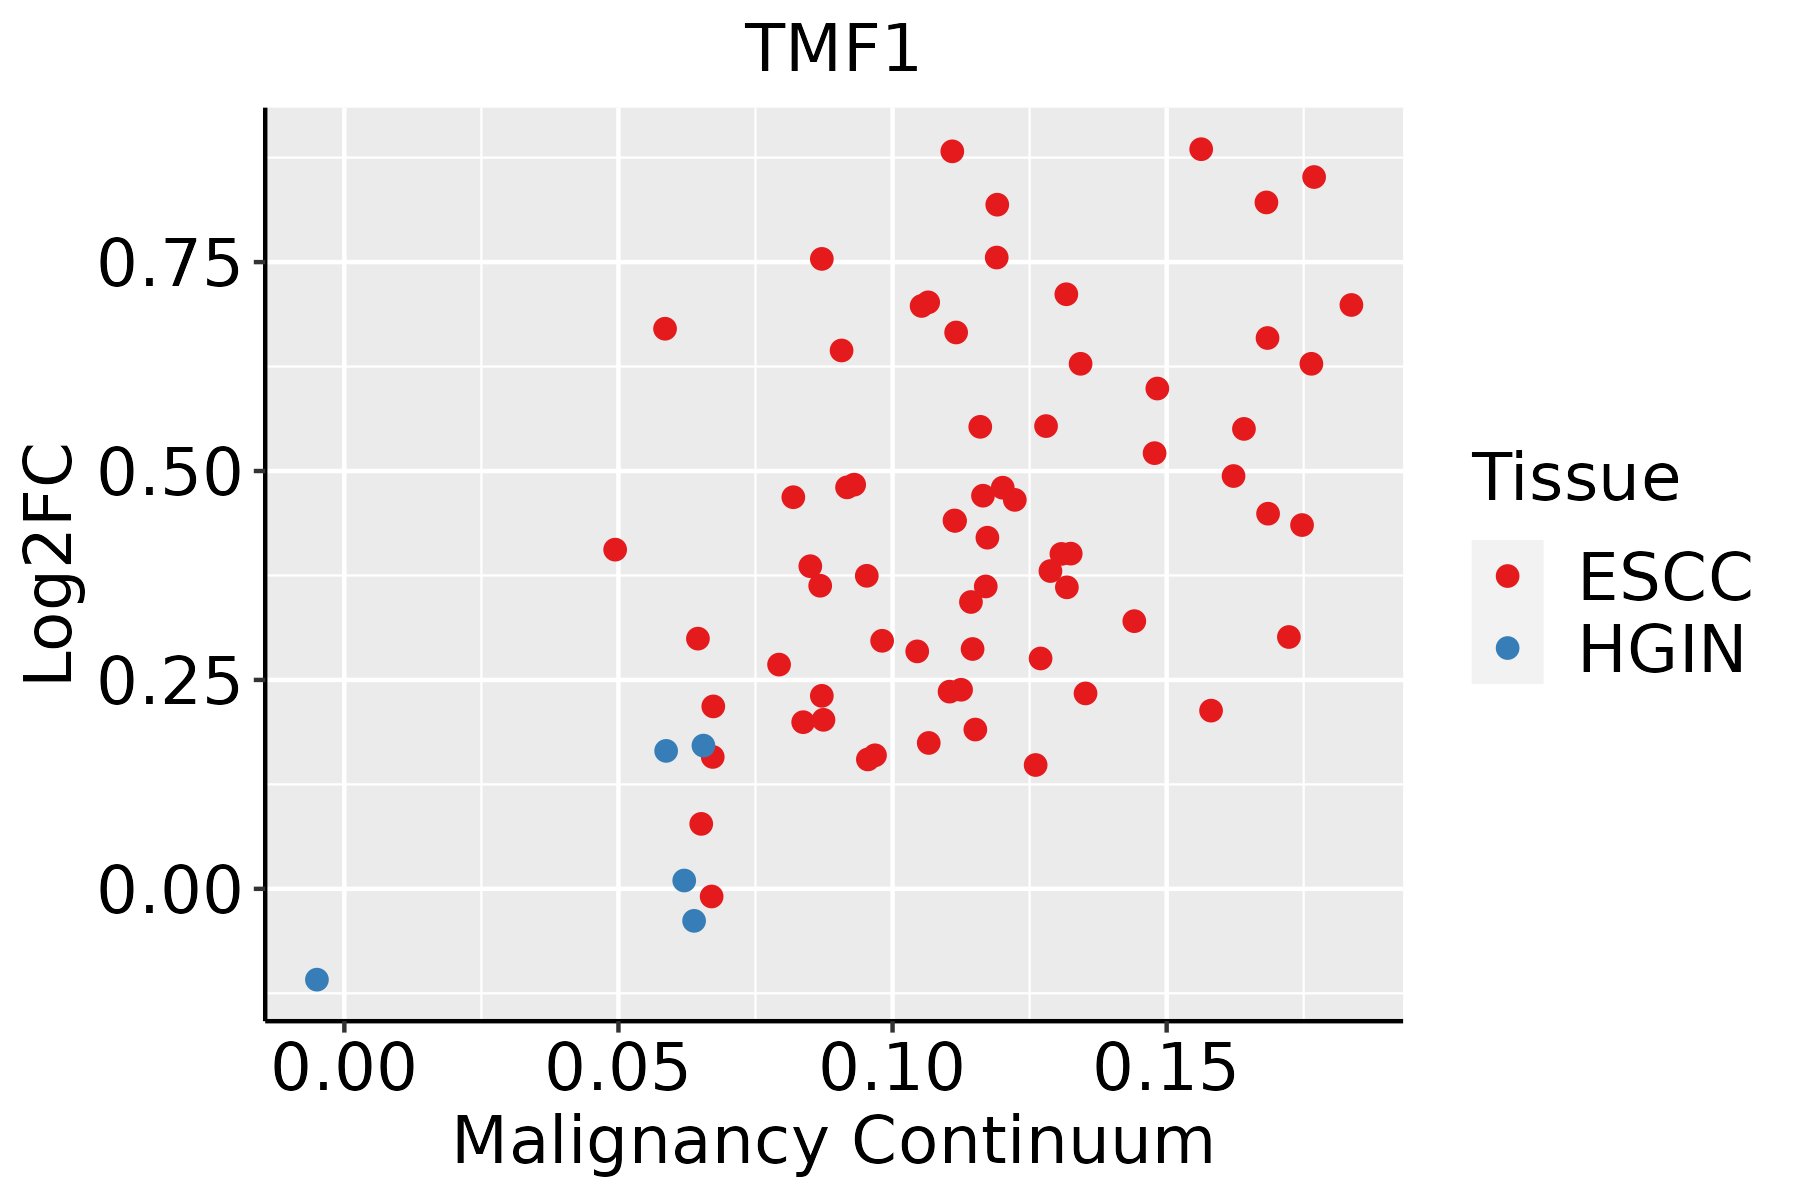
ESCC: Esophageal squamous cell carcinoma
HGIN: High-grade intraepithelial neoplasias
LGIN: Low-grade intraepithelial neoplasias
LiverThe image shows the transcriptomic changes along malignancy continuum.log2FC in expression of this searched gene in stem-like cells from each diseased tissue sample relative to stem-like cells in normal samples in each tissue plotted against the malignancy continuum. Samples are colored based on if they are from different disease stage.HCC: Hepatocellular carcinoma
NAFLD: Non-alcoholic fatty liver disease
ProstateThe image shows the transcriptomic changes along malignancy continuum.log2FC in expression of this searched gene in stem-like cells from each diseased tissue sample relative to stem-like cells in normal samples in each tissue plotted against the malignancy continuum. Samples are colored based on if they are from different disease stage.
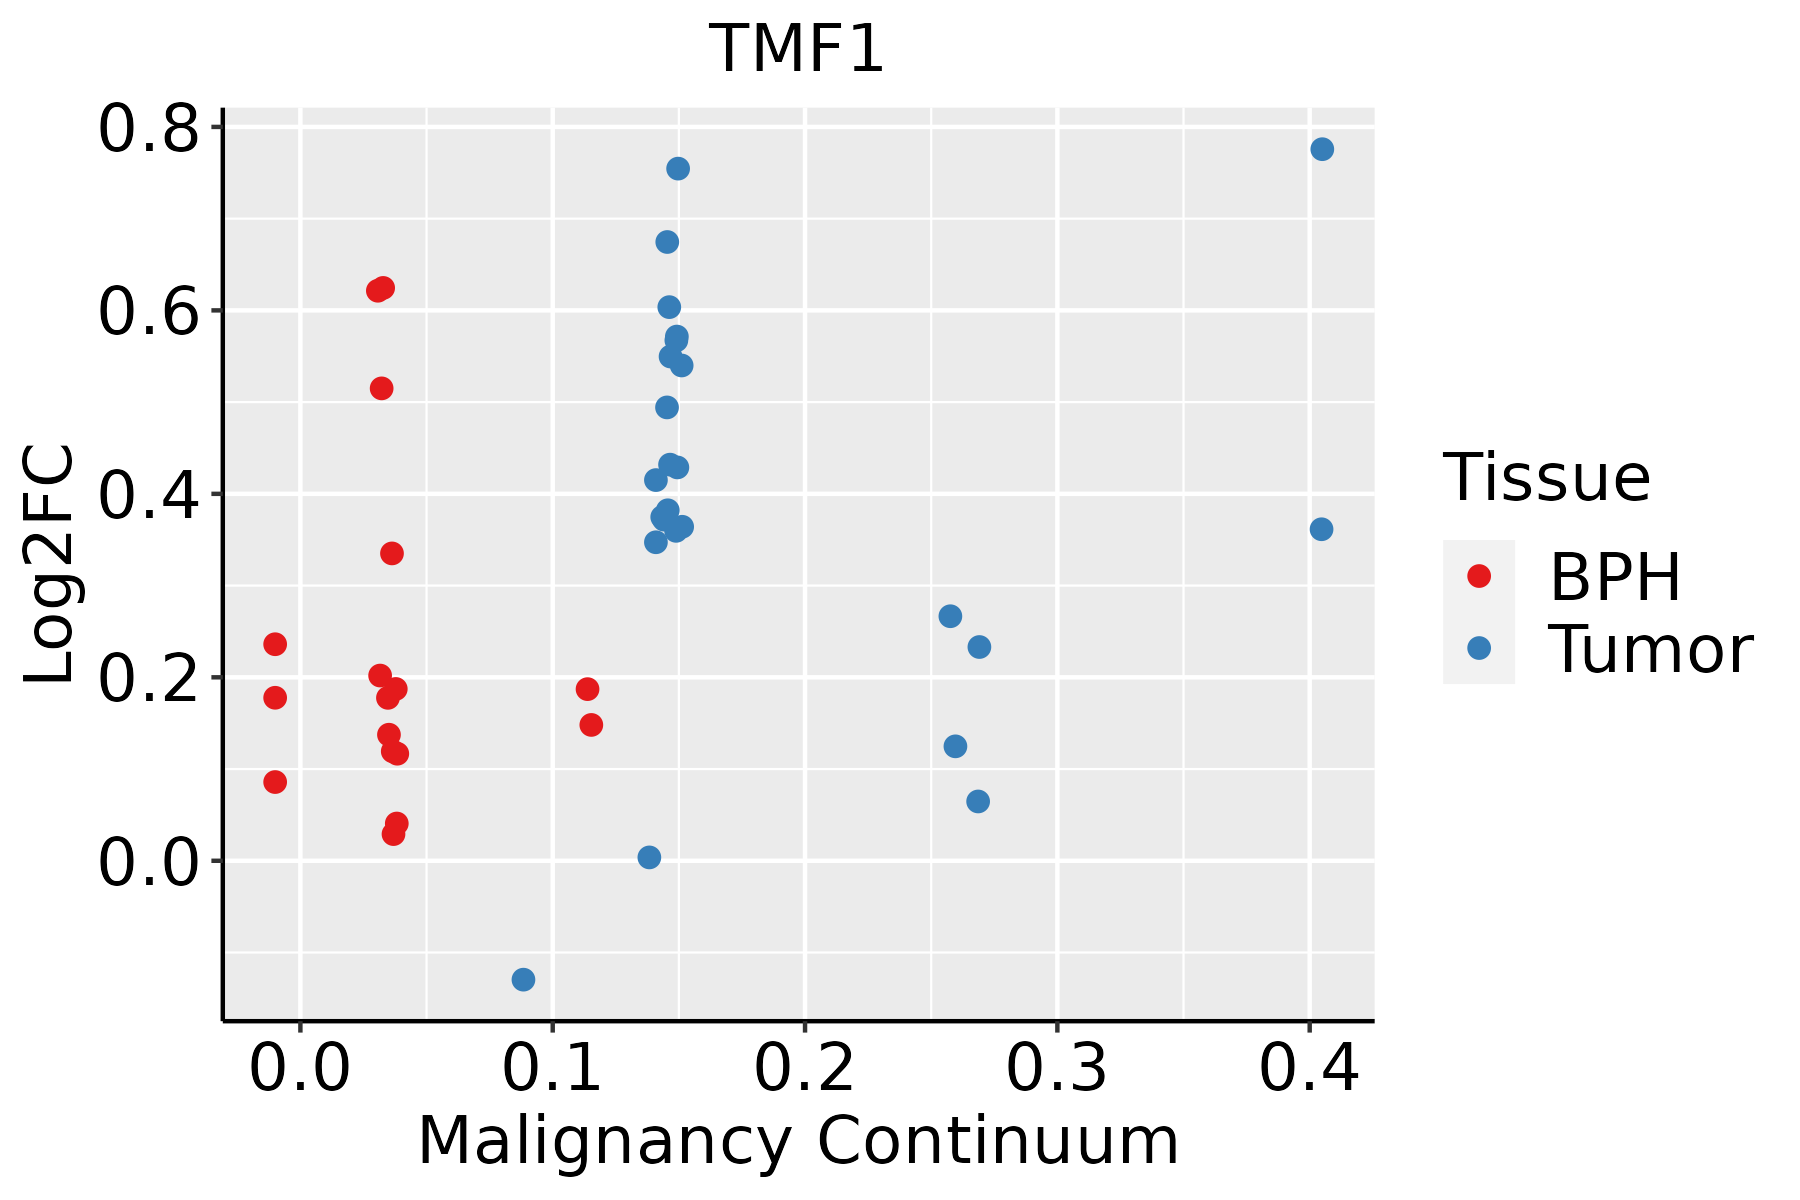
BPH: Benign Prostatic Hyperplasia
SkinThe image shows the transcriptomic changes along malignancy continuum.log2FC in expression of this searched gene in stem-like cells from each diseased tissue sample relative to stem-like cells in normal samples in each tissue plotted against the malignancy continuum. Samples are colored based on if they are from different disease stage.
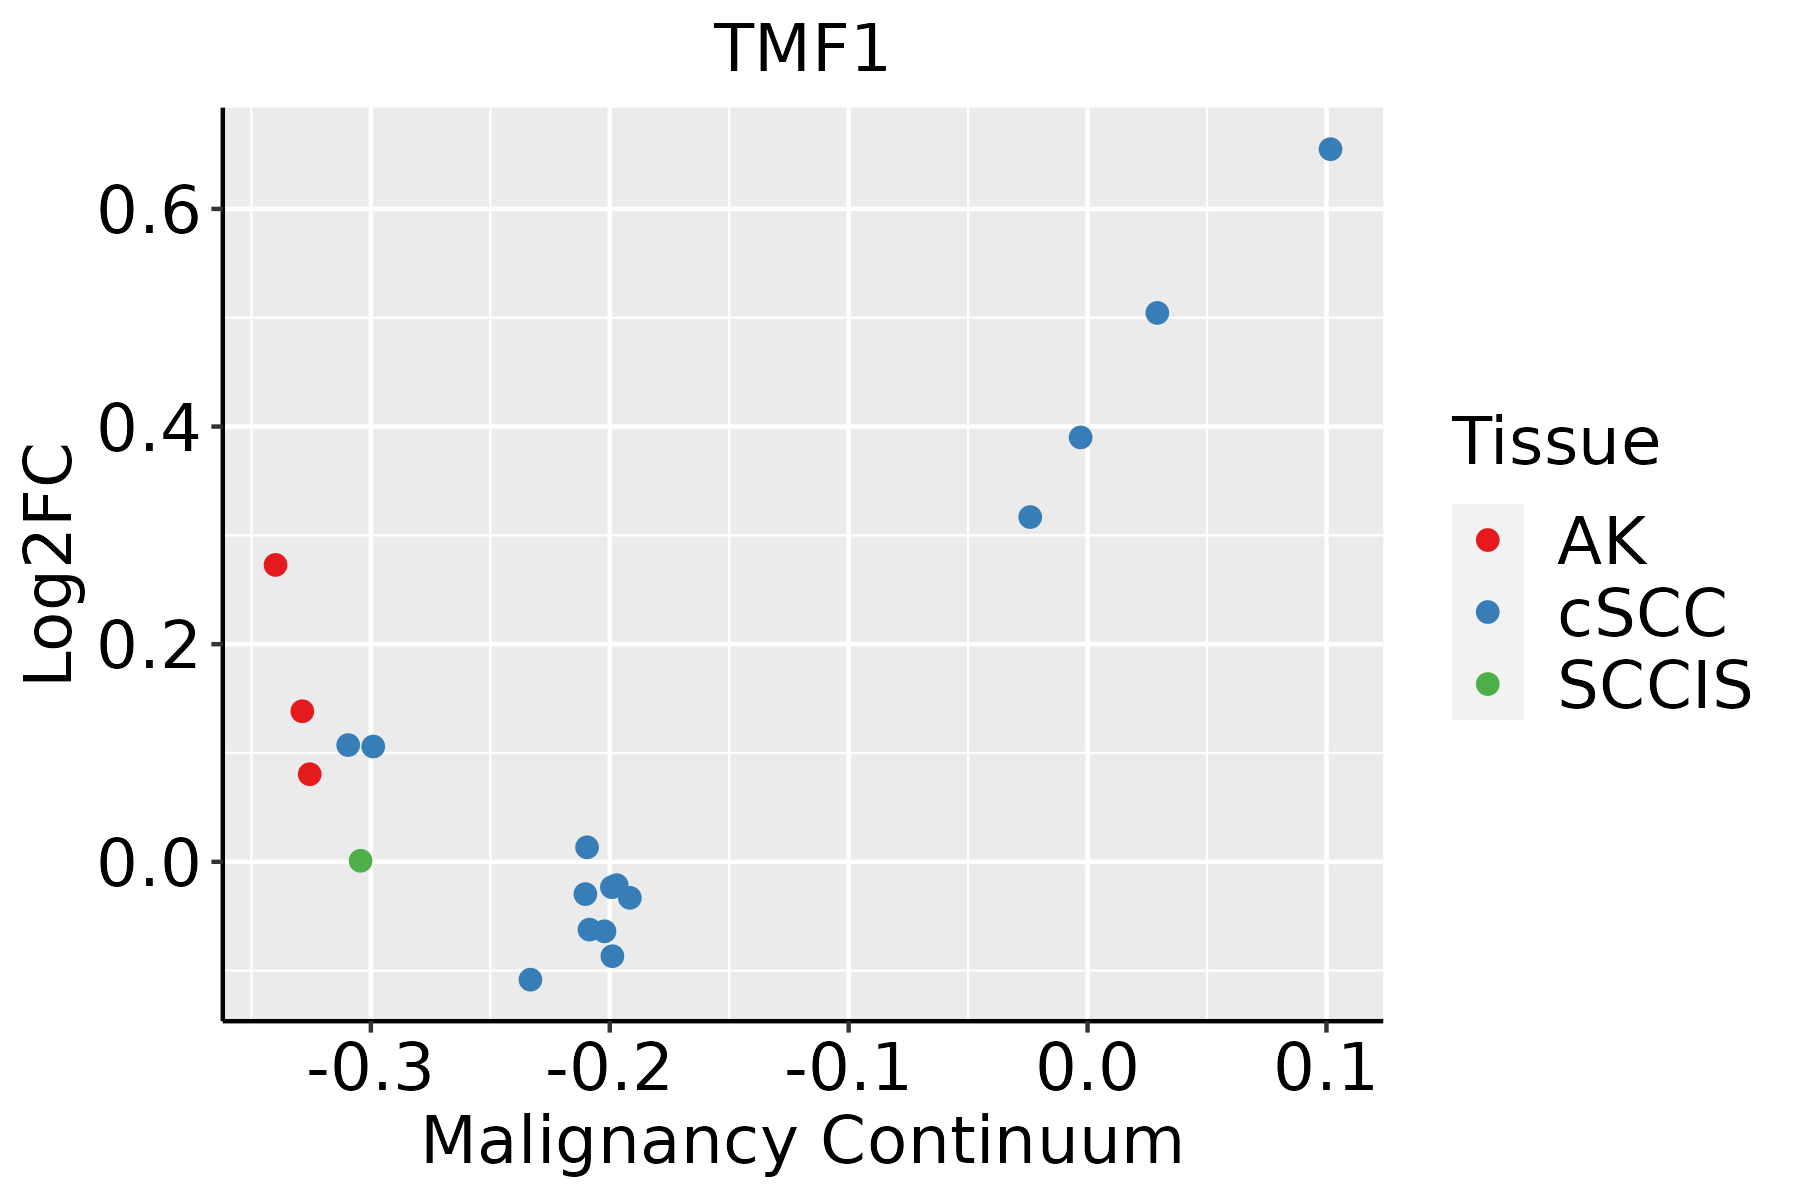
AK: Actinic keratosis
cSCC: Cutaneous squamous cell carcinoma
SCCIS:squamous cell carcinoma in situ
ThyroidThe image shows the transcriptomic changes along malignancy continuum.log2FC in expression of this searched gene in stem-like cells from each diseased tissue sample relative to stem-like cells in normal samples in each tissue plotted against the malignancy continuum. Samples are colored based on if they are from different disease stage.ATC: Anaplastic thyroid cancer
HT: Hashimoto's thyroiditis
PTC: Papillary thyroid cancer
∗log2FC in expression of this searched gene in stem-like cells from each diseased tissue sample relative to stem-like cells in normal samples in each tissue plotted against the malignancy continuum. Samples are colored based on if they are from different disease stage.

Top

Malignant transformation related pathway analysis

check buttonFind out the enriched GO biological processes and KEGG pathways involved in transition from healthy to precancer to cancer
check button Figure of enriched GO biological processes.
TissueDisease StageEnriched GO biological Processes
ColorectumADGO analysis - Figure of enriched GO biological processes: Top 15 enriched GO BP terms are showed in the bar plot of each disease state in each tissue. Each row represents a significant GO biological process which is colored according to the -log10(p.adjust).
ColorectumSERGO analysis - Figure of enriched GO biological processes: Top 15 enriched GO BP terms are showed in the bar plot of each disease state in each tissue. Each row represents a significant GO biological process which is colored according to the -log10(p.adjust).
ColorectumMSSGO analysis - Figure of enriched GO biological processes: Top 15 enriched GO BP terms are showed in the bar plot of each disease state in each tissue. Each row represents a significant GO biological process which is colored according to the -log10(p.adjust).
ColorectumMSI-HGO analysis - Figure of enriched GO biological processes: Top 15 enriched GO BP terms are showed in the bar plot of each disease state in each tissue. Each row represents a significant GO biological process which is colored according to the -log10(p.adjust).
ColorectumFAPGO analysis - Figure of enriched GO biological processes: Top 15 enriched GO BP terms are showed in the bar plot of each disease state in each tissue. Each row represents a significant GO biological process which is colored according to the -log10(p.adjust).
∗Top 15 enriched GO BP terms are showed in the bar plot of each disease state in each tissue. Each row represents a significant GO biological process which is colored according to the -log10(p.adjust).
Page: 1 2 3 4 5 6 7 8 9 

check button Enriched GO biological processes.
GO IDTissueDisease StageDescriptionGene RatioBg Ratiopvaluep.adjustCount
GO:0010498111EsophagusESCCproteasomal protein catabolic process369/8552490/187231.13e-411.80e-38369
GO:0042176111EsophagusESCCregulation of protein catabolic process280/8552391/187238.65e-262.39e-23280
GO:1903362111EsophagusESCCregulation of cellular protein catabolic process188/8552255/187235.12e-206.62e-18188
GO:001605014EsophagusESCCvesicle organization211/8552300/187232.85e-182.87e-16211
GO:1903050111EsophagusESCCregulation of proteolysis involved in cellular protein catabolic process163/8552221/187231.44e-171.27e-15163
GO:0061136111EsophagusESCCregulation of proteasomal protein catabolic process142/8552187/187232.40e-172.00e-15142
GO:000699713EsophagusESCCnucleus organization96/8552133/187234.66e-101.21e-0896
GO:0030522110EsophagusESCCintracellular receptor signaling pathway170/8552265/187238.58e-102.09e-08170
GO:0048545111EsophagusESCCresponse to steroid hormone204/8552339/187234.47e-088.11e-07204
GO:0061458110EsophagusESCCreproductive system development247/8552427/187232.24e-073.42e-06247
GO:004860818EsophagusESCCreproductive structure development245/8552424/187232.82e-074.14e-06245
GO:0071383110EsophagusESCCcellular response to steroid hormone stimulus127/8552204/187231.26e-061.55e-05127
GO:003051819EsophagusESCCintracellular steroid hormone receptor signaling pathway76/8552116/187231.25e-051.15e-0476
GO:004340119EsophagusESCCsteroid hormone mediated signaling pathway87/8552136/187231.25e-051.15e-0487
GO:003052118EsophagusESCCandrogen receptor signaling pathway31/855244/187237.70e-043.99e-0331
GO:000181916EsophagusESCCpositive regulation of cytokine production244/8552467/187232.29e-031.01e-02244
GO:000975516EsophagusESCChormone-mediated signaling pathway106/8552190/187233.13e-031.30e-02106
GO:001049812LiverCirrhoticproteasomal protein catabolic process216/4634490/187232.52e-219.29e-19216
GO:004217612LiverCirrhoticregulation of protein catabolic process181/4634391/187237.94e-212.77e-18181
GO:190336212LiverCirrhoticregulation of cellular protein catabolic process124/4634255/187239.85e-171.26e-14124
Page: 1 2 3 4 5 6 7 8 9 10 11 

check button Enriched KEGG pathways.
Pathway IDTissueDisease StageDescriptionGene RatioBg Ratiopvaluep.adjustqvalueCount
Page: 1 

Top

Cell-cell communication analysis

check buttonIdentification of potential cell-cell interactions between two cell types and their ligand-receptor pairs for different disease states
LigandReceptorLRpairPathwayTissueDisease Stage
Page: 1 

Top

Single-cell gene regulatory network inference analysis

check buttonFind out the significant the regulons (TFs) and the target genes of each regulon across cell types for different disease states
TFCell TypeTissueDisease StageTarget GeneRSSRegulon Activity
∗The dot plots of a searched regulon are shown for all cell subpopulations in each disease state of each tissue based on the regulon specific score inferred using pySCENIC and by calculating the average expression.
Page: 1 

Top

Somatic mutation of malignant transformation related genes

check buttonAnnotation of somatic variants for genes involved in malignant transformation
Hugo SymbolVariant ClassVariant ClassificationdbSNP RSHGVScHGVSpHGVSp ShortSWISSPROTBIOTYPESIFTPolyPhenTumor Sample BarcodeTissueHistologySexAgeStageTherapy TypesDrugsOutcome
TMF1SNVMissense_Mutationnovelc.467N>Ap.Ser156Tyrp.S156YP82094protein_codingdeleterious_low_confidence(0.01)benign(0.044)TCGA-A2-A25A-01Breastbreast invasive carcinomaFemale<65I/IIUnspecificCytoxanSD
TMF1SNVMissense_Mutationnovelc.1513N>Gp.Gln505Glup.Q505EP82094protein_codingdeleterious(0.02)benign(0.214)TCGA-A7-A4SA-01Breastbreast invasive carcinomaFemale<65I/IIChemotherapydoxorubicinCR
TMF1SNVMissense_Mutationrs764372262c.356N>Tp.Pro119Leup.P119LP82094protein_codingdeleterious_low_confidence(0)possibly_damaging(0.895)TCGA-AC-A23H-01Breastbreast invasive carcinomaFemale>=65I/IIUnknownUnknownPD
TMF1SNVMissense_Mutationrs760281565c.1961N>Ap.Arg654Glnp.R654QP82094protein_codingdeleterious(0.02)probably_damaging(0.973)TCGA-AN-A046-01Breastbreast invasive carcinomaFemale>=65I/IIUnknownUnknownSD
TMF1SNVMissense_Mutationc.1117N>Ap.Ala373Thrp.A373TP82094protein_codingtolerated_low_confidence(0.54)benign(0)TCGA-D8-A1JA-01Breastbreast invasive carcinomaFemale<65III/IVChemotherapyadriamycinPD
TMF1SNVMissense_Mutationc.437N>Gp.Glu146Glyp.E146GP82094protein_codingtolerated_low_confidence(0.05)benign(0.05)TCGA-E2-A1B6-01Breastbreast invasive carcinomaFemale<65I/IIUnspecificAdriamycinSD
TMF1insertionNonsense_Mutationnovelc.228_229insGGAGTGTAAGTGAAATCAATTCAGATGATp.Ser77GlyfsTer3p.S77Gfs*3P82094protein_codingTCGA-A2-A0EO-01Breastbreast invasive carcinomaFemale<65I/IIHormone TherapytamoxiphenSD
TMF1insertionFrame_Shift_Insnovelc.638_639insAACAGCTCCCTCTTTTGACTGTGCTAGGATGCACCACGp.Ser214ThrfsTer25p.S214Tfs*25P82094protein_codingTCGA-A7-A0CJ-01Breastbreast invasive carcinomaFemale<65I/IIChemotherapycytoxanSD
TMF1deletionFrame_Shift_Delnovelc.2611delNp.Glu871LysfsTer3p.E871Kfs*3P82094protein_codingTCGA-EW-A2FV-01Breastbreast invasive carcinomaFemale<65III/IVChemotherapydocetaxelSD
TMF1SNVMissense_Mutationc.2382G>Tp.Lys794Asnp.K794NP82094protein_codingdeleterious(0)probably_damaging(0.972)TCGA-2W-A8YY-01Cervixcervical & endocervical cancerFemale<65I/IIChemotherapycisplatinCR
Page: 1 2 3 4 5 6 7 8 9 10 11 

Top

Related drugs of malignant transformation related genes

check buttonIdentification of chemicals and drugs interact with genes involved in malignant transfromation
(DGIdb 4.0)
Entrez IDSymbolCategoryInteraction TypesDrug Claim NameDrug NamePMIDs
Page: 1