
|
|||||
|
 | |
| |
| |
| |
| |
| |
|
Gene: TMEM99 |
Gene summary for TMEM99 |
| Gene information | Species | Human | Gene symbol | TMEM99 | Gene ID | 147184 |
| Gene name | KRT10 antisense RNA 1 | |
| Gene Alias | TMEM99 | |
| Cytomap | 17q21.2 | |
| Gene Type | ncRNA | GO ID | GO:0005575 | UniProtAcc | NA |
Top |
Malignant transformation analysis |
| Identification of the aberrant gene expression in precancerous and cancerous lesions by comparing the gene expression of stem-like cells in diseased tissues with normal stem cells |
| Entrez ID | Symbol | Replicates | Species | Organ | Tissue | Adj P-value | Log2FC | Malignancy |
| 147184 | TMEM99 | GSM4909286 | Human | Breast | IDC | 1.46e-04 | 1.50e-01 | 0.1081 |
| 147184 | TMEM99 | GSM4909290 | Human | Breast | IDC | 1.74e-16 | 5.84e-01 | 0.2096 |
| 147184 | TMEM99 | GSM4909292 | Human | Breast | IDC | 1.66e-04 | 6.47e-01 | 0.1236 |
| 147184 | TMEM99 | GSM4909306 | Human | Breast | IDC | 3.16e-05 | 2.73e-01 | 0.1564 |
| 147184 | TMEM99 | GSM4909307 | Human | Breast | IDC | 1.27e-05 | 3.16e-01 | 0.1569 |
| 147184 | TMEM99 | GSM4909308 | Human | Breast | IDC | 1.02e-21 | 5.52e-01 | 0.158 |
| 147184 | TMEM99 | GSM4909311 | Human | Breast | IDC | 3.98e-03 | -3.41e-02 | 0.1534 |
| 147184 | TMEM99 | GSM4909312 | Human | Breast | IDC | 7.22e-05 | 2.61e-01 | 0.1552 |
| 147184 | TMEM99 | GSM4909313 | Human | Breast | IDC | 1.03e-02 | 2.99e-01 | 0.0391 |
| 147184 | TMEM99 | GSM4909319 | Human | Breast | IDC | 8.86e-22 | 3.91e-01 | 0.1563 |
| 147184 | TMEM99 | GSM4909321 | Human | Breast | IDC | 3.69e-03 | 1.64e-01 | 0.1559 |
| 147184 | TMEM99 | NCCBC14 | Human | Breast | DCIS | 5.86e-24 | 7.43e-01 | 0.2021 |
| 147184 | TMEM99 | DCIS2 | Human | Breast | DCIS | 6.04e-38 | 1.27e-01 | 0.0085 |
| 147184 | TMEM99 | LZE4T | Human | Esophagus | ESCC | 3.41e-10 | 3.29e-01 | 0.0811 |
| 147184 | TMEM99 | LZE7T | Human | Esophagus | ESCC | 2.13e-02 | 3.71e-01 | 0.0667 |
| 147184 | TMEM99 | LZE8T | Human | Esophagus | ESCC | 1.95e-04 | 3.87e-01 | 0.067 |
| 147184 | TMEM99 | LZE22D1 | Human | Esophagus | HGIN | 4.64e-03 | 1.54e-01 | 0.0595 |
| 147184 | TMEM99 | LZE22T | Human | Esophagus | ESCC | 6.25e-05 | 9.47e-01 | 0.068 |
| 147184 | TMEM99 | LZE24T | Human | Esophagus | ESCC | 2.51e-22 | 8.32e-01 | 0.0596 |
| 147184 | TMEM99 | LZE6T | Human | Esophagus | ESCC | 7.41e-04 | 2.34e-01 | 0.0845 |
| Page: 1 2 3 4 5 |
| Tissue | Expression Dynamics | Abbreviation |
| Breast | 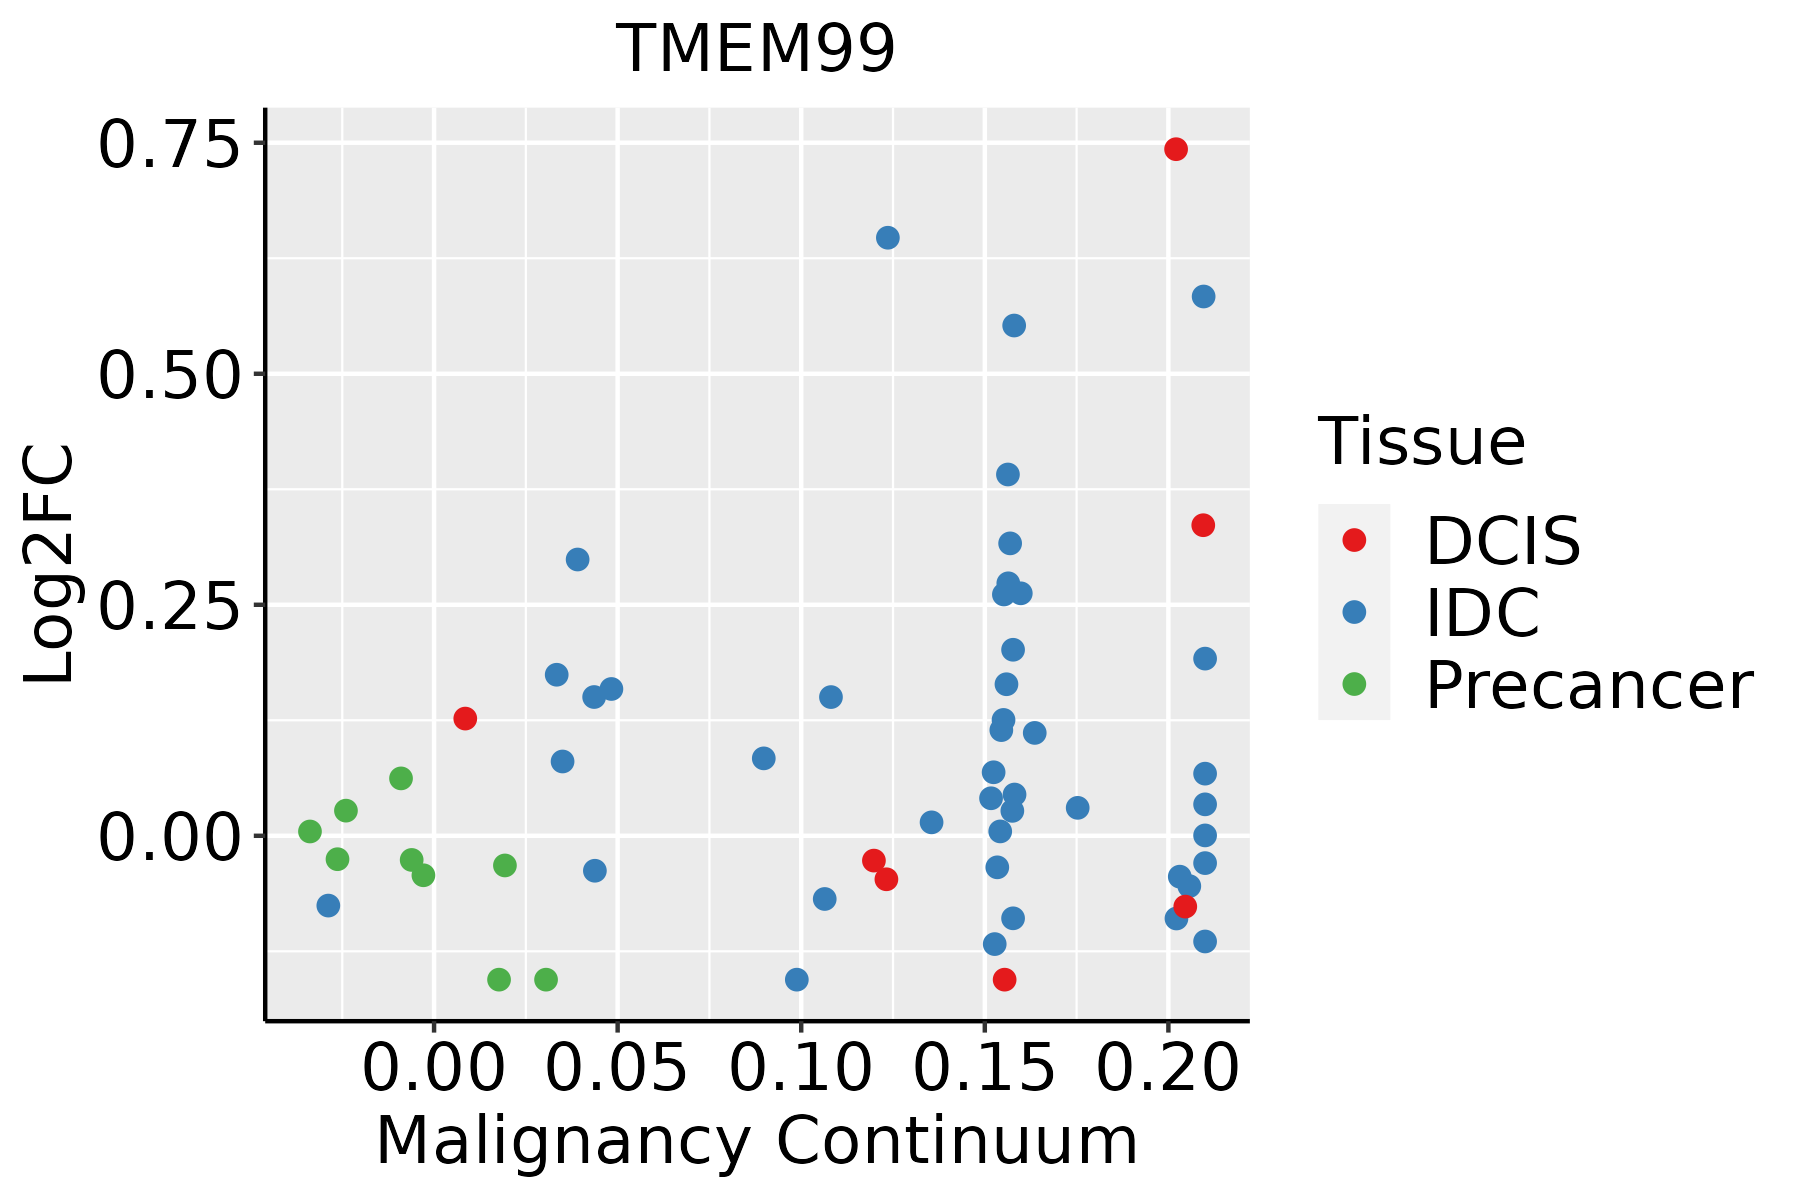 | IDC: Invasive ductal carcinoma |
| DCIS: Ductal carcinoma in situ | ||
| Precancer(BRCA1-mut): Precancerous lesion from BRCA1 mutation carriers | ||
| Esophagus | 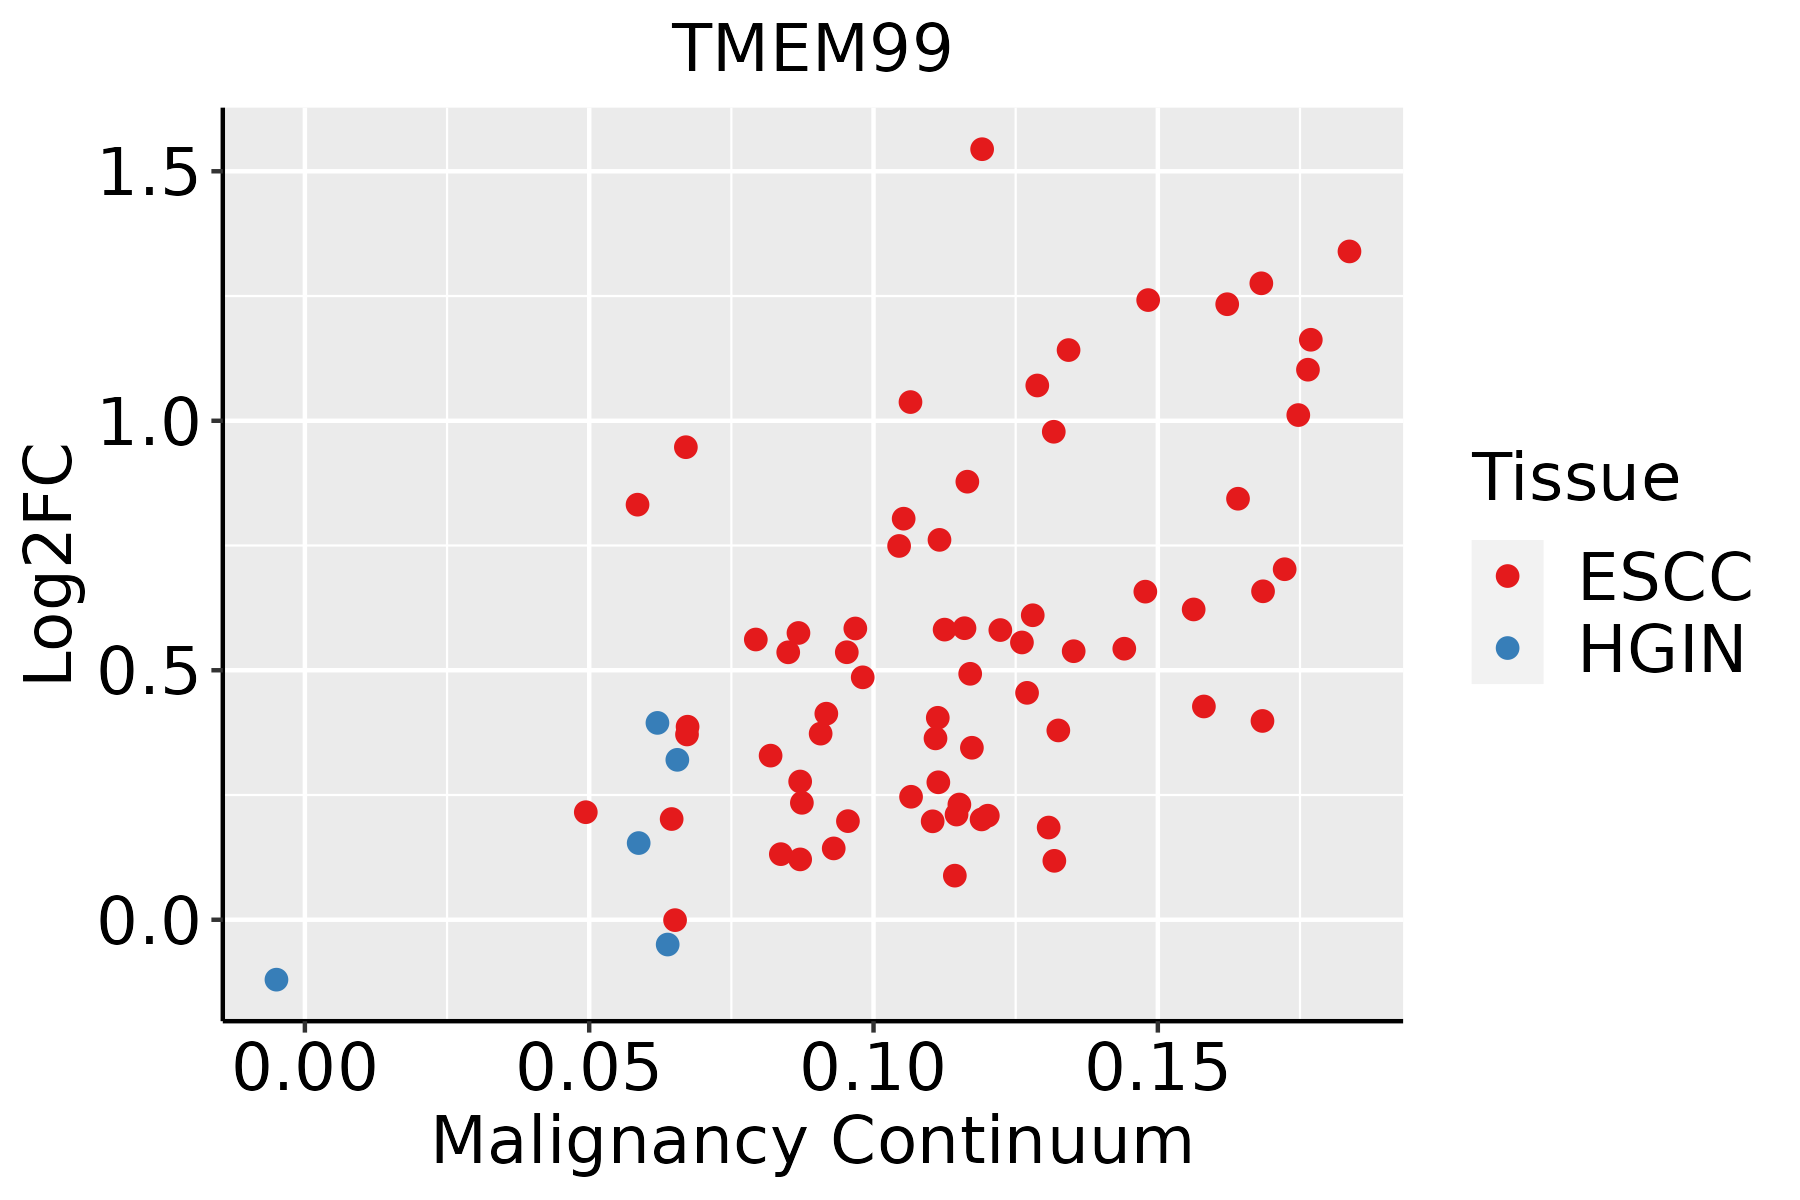 | ESCC: Esophageal squamous cell carcinoma |
| HGIN: High-grade intraepithelial neoplasias | ||
| LGIN: Low-grade intraepithelial neoplasias | ||
| Liver |  | HCC: Hepatocellular carcinoma |
| NAFLD: Non-alcoholic fatty liver disease | ||
| Oral Cavity |  | EOLP: Erosive Oral lichen planus |
| LP: leukoplakia | ||
| NEOLP: Non-erosive oral lichen planus | ||
| OSCC: Oral squamous cell carcinoma | ||
| Prostate | 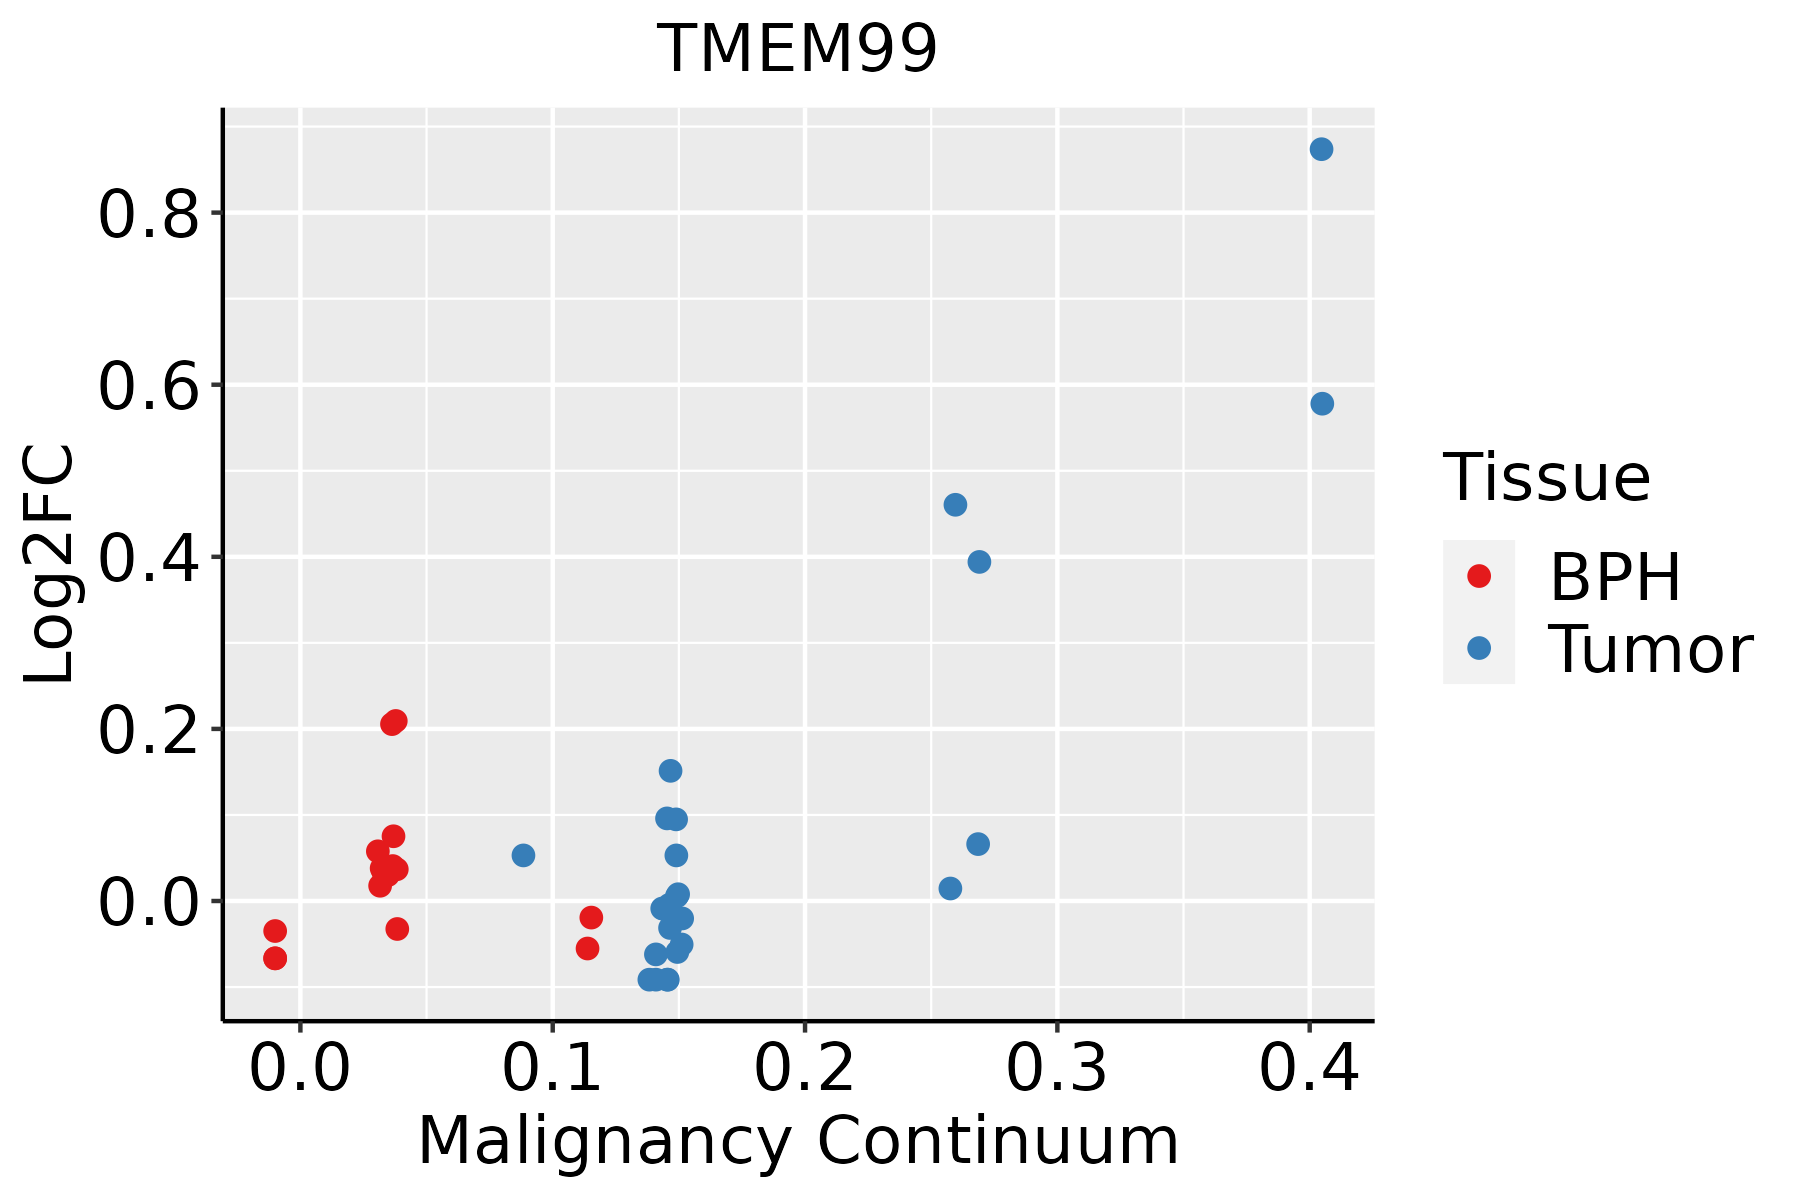 | BPH: Benign Prostatic Hyperplasia |
| Skin | 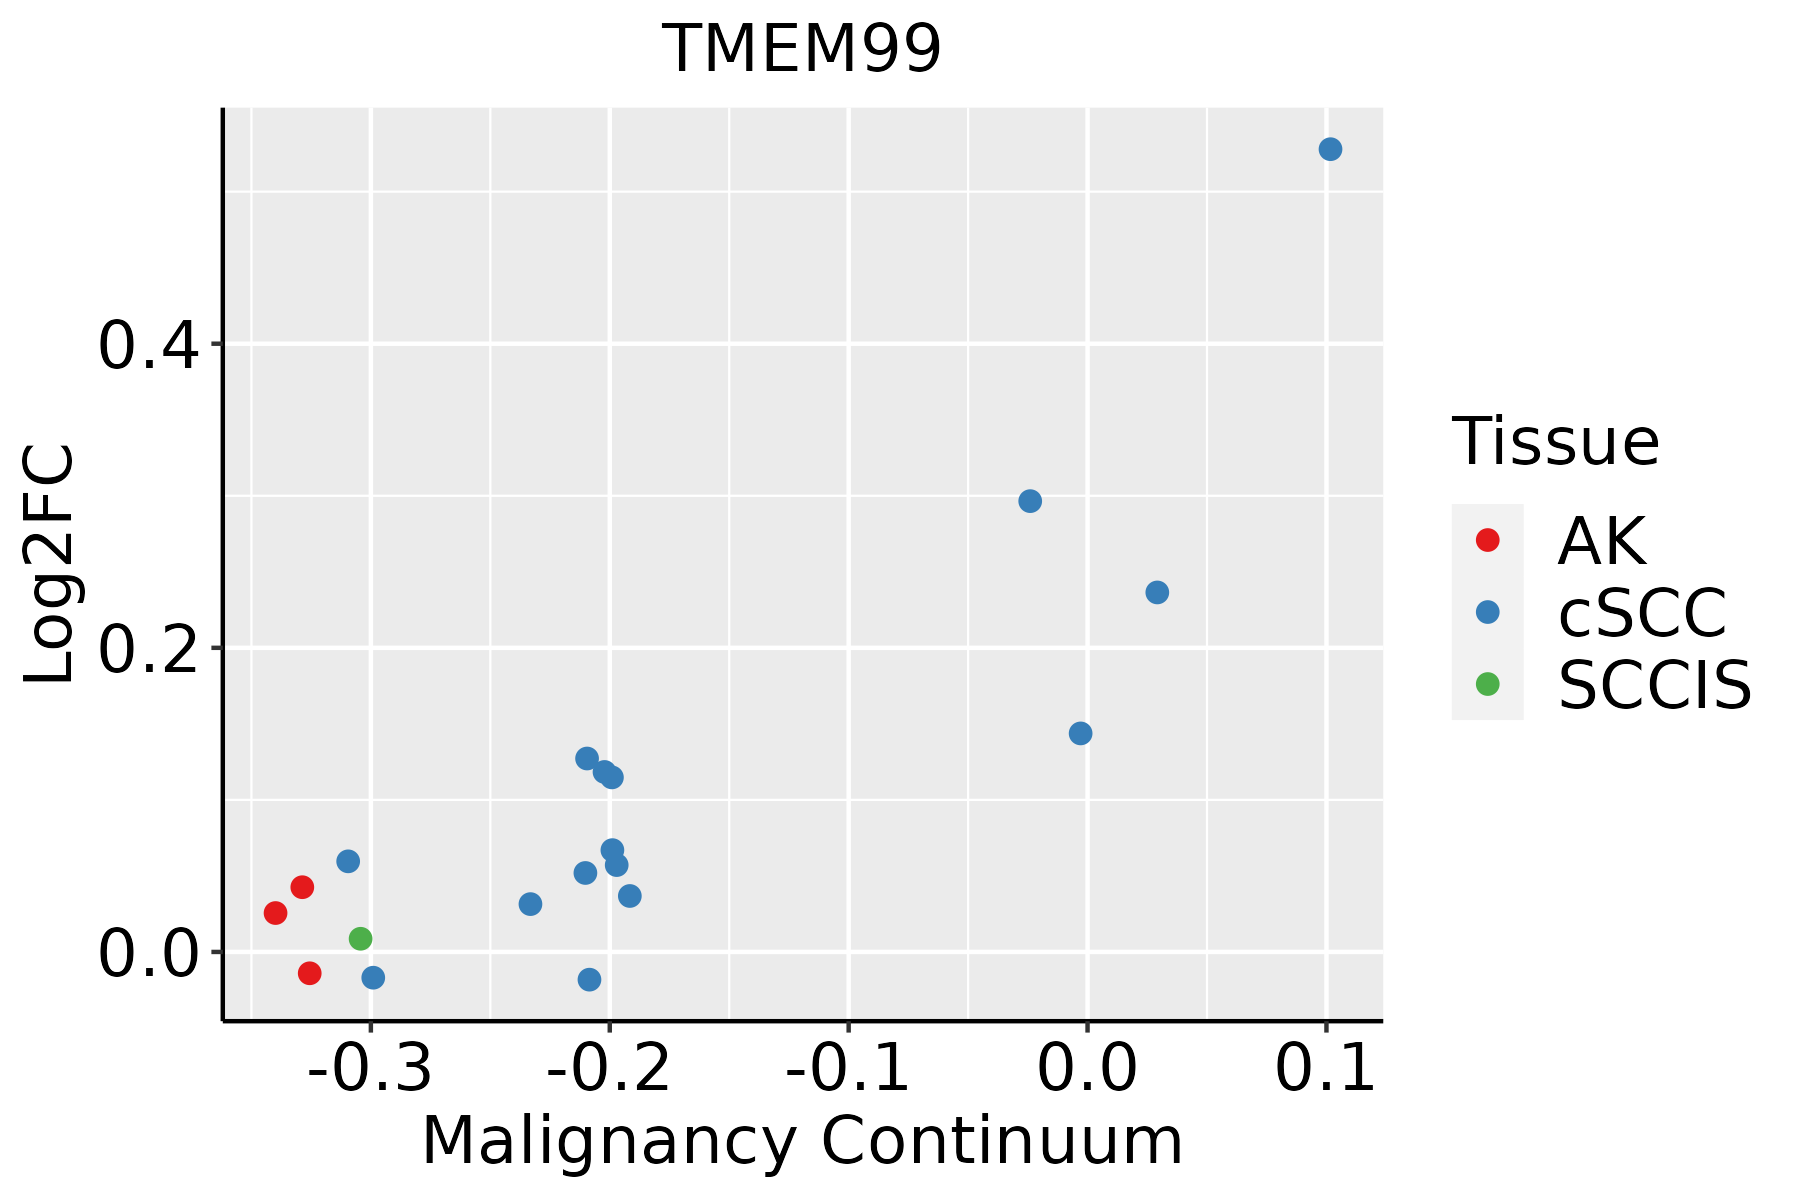 | AK: Actinic keratosis |
| cSCC: Cutaneous squamous cell carcinoma | ||
| SCCIS:squamous cell carcinoma in situ |
| ∗log2FC in expression of this searched gene in stem-like cells from each diseased tissue sample relative to stem-like cells in normal samples in each tissue plotted against the malignancy continuum. Samples are colored based on if they are from different disease stage. |
Top |
Malignant transformation related pathway analysis |
| Find out the enriched GO biological processes and KEGG pathways involved in transition from healthy to precancer to cancer |
| Tissue | Disease Stage | Enriched GO biological Processes |
| Colorectum | AD |  |
| Colorectum | SER |  |
| Colorectum | MSS |  |
| Colorectum | MSI-H |  |
| Colorectum | FAP |  |
| ∗Top 15 enriched GO BP terms are showed in the bar plot of each disease state in each tissue. Each row represents a significant GO biological process which is colored according to the -log10(p.adjust). |
| Page: 1 2 3 4 5 6 7 8 9 |
| GO ID | Tissue | Disease Stage | Description | Gene Ratio | Bg Ratio | pvalue | p.adjust | Count |
| Page: 1 |
| Pathway ID | Tissue | Disease Stage | Description | Gene Ratio | Bg Ratio | pvalue | p.adjust | qvalue | Count |
| Page: 1 |
Top |
Cell-cell communication analysis |
| Identification of potential cell-cell interactions between two cell types and their ligand-receptor pairs for different disease states |
| Ligand | Receptor | LRpair | Pathway | Tissue | Disease Stage |
| Page: 1 |
Top |
Single-cell gene regulatory network inference analysis |
| Find out the significant the regulons (TFs) and the target genes of each regulon across cell types for different disease states |
| TF | Cell Type | Tissue | Disease Stage | Target Gene | RSS | Regulon Activity |
| ∗The dot plots of a searched regulon are shown for all cell subpopulations in each disease state of each tissue based on the regulon specific score inferred using pySCENIC and by calculating the average expression. |
| Page: 1 |
Top |
Somatic mutation of malignant transformation related genes |
| Annotation of somatic variants for genes involved in malignant transformation |
| Hugo Symbol | Variant Class | Variant Classification | dbSNP RS | HGVSc | HGVSp | HGVSp Short | SWISSPROT | BIOTYPE | SIFT | PolyPhen | Tumor Sample Barcode | Tissue | Histology | Sex | Age | Stage | Therapy Types | Drugs | Outcome |
| TMEM99 | SNV | Missense_Mutation | rs757260462 | c.433G>A | p.Val145Ile | p.V145I | Q8N816 | protein_coding | deleterious_low_confidence(0) | benign(0.367) | TCGA-A1-A0SG-01 | Breast | breast invasive carcinoma | Female | <65 | I/II | Chemotherapy | SD | |
| TMEM99 | SNV | Missense_Mutation | c.707C>T | p.Ser236Phe | p.S236F | Q8N816 | protein_coding | deleterious_low_confidence(0.02) | possibly_damaging(0.862) | TCGA-A8-A0A7-01 | Breast | breast invasive carcinoma | Female | <65 | I/II | Unknown | Unknown | SD | |
| TMEM99 | SNV | Missense_Mutation | c.113C>T | p.Ser38Leu | p.S38L | Q8N816 | protein_coding | deleterious_low_confidence(0) | possibly_damaging(0.503) | TCGA-FU-A23K-01 | Cervix | cervical & endocervical cancer | Female | <65 | III/IV | Unknown | Unknown | SD | |
| TMEM99 | SNV | Missense_Mutation | c.223T>A | p.Ser75Thr | p.S75T | Q8N816 | protein_coding | deleterious_low_confidence(0) | benign(0.031) | TCGA-AA-3971-01 | Colorectum | colon adenocarcinoma | Male | <65 | III/IV | Chemotherapy | folinic | CR | |
| TMEM99 | insertion | Frame_Shift_Ins | rs745582426 | c.604_605insT | p.Leu204PhefsTer15 | p.L204Ffs*15 | Q8N816 | protein_coding | TCGA-AA-3672-01 | Colorectum | colon adenocarcinoma | Female | >=65 | III/IV | Unknown | Unknown | SD | ||
| TMEM99 | insertion | Frame_Shift_Ins | novel | c.753_765dupGTTTTCTACGTTT | p.Thr256ValfsTer37 | p.T256Vfs*37 | Q8N816 | protein_coding | TCGA-EI-6884-01 | Colorectum | rectum adenocarcinoma | Male | >=65 | III/IV | Chemotherapy | 5 | SD | ||
| TMEM99 | SNV | Missense_Mutation | rs374118264 | c.397N>A | p.Val133Ile | p.V133I | Q8N816 | protein_coding | tolerated_low_confidence(0.24) | benign(0.141) | TCGA-AJ-A3EL-01 | Endometrium | uterine corpus endometrioid carcinoma | Female | <65 | I/II | Unknown | Unknown | SD |
| TMEM99 | SNV | Missense_Mutation | rs749312743 | c.242N>A | p.Gly81Glu | p.G81E | Q8N816 | protein_coding | deleterious_low_confidence(0) | probably_damaging(0.988) | TCGA-AP-A059-01 | Endometrium | uterine corpus endometrioid carcinoma | Female | >=65 | I/II | Unknown | Unknown | SD |
| TMEM99 | SNV | Missense_Mutation | c.554N>C | p.Lys185Thr | p.K185T | Q8N816 | protein_coding | deleterious_low_confidence(0) | possibly_damaging(0.643) | TCGA-AX-A05Z-01 | Endometrium | uterine corpus endometrioid carcinoma | Female | <65 | III/IV | Chemotherapy | adriamycin | SD | |
| TMEM99 | SNV | Missense_Mutation | rs752360948 | c.269G>A | p.Arg90Gln | p.R90Q | Q8N816 | protein_coding | deleterious_low_confidence(0) | possibly_damaging(0.776) | TCGA-D1-A2G7-01 | Endometrium | uterine corpus endometrioid carcinoma | Female | >=65 | I/II | Unknown | Unknown | SD |
| Page: 1 2 |
Top |
Related drugs of malignant transformation related genes |
| Identification of chemicals and drugs interact with genes involved in malignant transfromation |
| (DGIdb 4.0) |
| Entrez ID | Symbol | Category | Interaction Types | Drug Claim Name | Drug Name | PMIDs |
| Page: 1 |

Copyright 2023-Present -The University of Texas Health Science Center at Houston |