Schematic overview of the cellular and molecular mechanisms involved in the cancer progression, including the proposed cellular and molecular mechanisms in cancer cells trajectory. AT1: alveolar type 1 cells; AT2: alveolar type 2 cells; AAH: atypical adenomatous hyperplasia; AIS: adenocarcinoma in situ; MIA: minimally invasive adenocarcinoma; IA: invasive adenocarcinoma; EMT: epithelial-mesenchymal transition

Home

Download

Statistics

Help

Contact

Center for Computational Systems Medicine
leaf

Gene summary

leaf

Malignant transformation analysis

leaf

Malignant transformation related pathway analysis

leaf

Cell-cell communication analysis

leaf

Single-cell gene regulatory network inference analysis

leaf

Somatic mutation of malignant transformation related genes

leaf

Related drugs of malignant transformation related genes

Gene: TMEM98

Gene summary for TMEM98

check button Gene summary.

Gene informationSpeciesHuman
Gene symbol

TMEM98

Gene ID

26022

Gene nametransmembrane protein 98
Gene AliasTADA1
Cytomap17q11.2
Gene Typeprotein-coding
GO ID

GO:0001775

UniProtAcc

Q9Y2Y6


Top

Malignant transformation analysis

check button Identification of the aberrant gene expression in precancerous and cancerous lesions by comparing the gene expression of stem-like cells in diseased tissues with normal stem cells
check button Malignant transformation involving gene list.
Entrez IDSymbolReplicatesSpeciesOrganTissueAdj P-valueLog2FCMalignancy
26022TMEM98HTA11_3410_2000001011HumanColorectumAD5.12e-032.53e-010.0155
26022TMEM98HTA11_2487_2000001011HumanColorectumSER9.20e-074.41e-01-0.1808
26022TMEM98HTA11_1938_2000001011HumanColorectumAD2.44e-034.79e-01-0.0811
26022TMEM98HTA11_78_2000001011HumanColorectumAD3.25e-096.80e-01-0.1088
26022TMEM98HTA11_347_2000001011HumanColorectumAD2.93e-328.76e-01-0.1954
26022TMEM98HTA11_411_2000001011HumanColorectumSER3.67e-081.04e+00-0.2602
26022TMEM98HTA11_3361_2000001011HumanColorectumAD2.94e-022.64e-01-0.1207
26022TMEM98HTA11_83_2000001011HumanColorectumSER1.29e-034.92e-01-0.1526
26022TMEM98HTA11_696_2000001011HumanColorectumAD1.49e-094.56e-01-0.1464
26022TMEM98HTA11_866_2000001011HumanColorectumAD3.55e-073.51e-01-0.1001
26022TMEM98HTA11_1391_2000001011HumanColorectumAD9.29e-074.71e-01-0.059
26022TMEM98HTA11_2992_2000001011HumanColorectumSER4.55e-058.17e-01-0.1706
26022TMEM98HTA11_5212_2000001011HumanColorectumAD4.55e-081.02e+00-0.2061
26022TMEM98HTA11_7862_2000001011HumanColorectumAD4.27e-107.47e-01-0.0179
26022TMEM98HTA11_866_3004761011HumanColorectumAD7.92e-186.06e-010.096
26022TMEM98HTA11_8622_2000001021HumanColorectumSER8.05e-076.50e-010.0528
26022TMEM98HTA11_7663_2000001011HumanColorectumSER1.44e-036.08e-010.0131
26022TMEM98HTA11_6801_2000001011HumanColorectumSER1.66e-069.36e-010.0171
26022TMEM98HTA11_7696_3000711011HumanColorectumAD7.36e-052.93e-010.0674
26022TMEM98HTA11_7469_2000001011HumanColorectumAD4.57e-069.24e-01-0.0124
Page: 1 2 3 4 5 6 7 8 

check button Transcriptomic changes along malignancy continuum.
TissueExpression DynamicsAbbreviation
Colorectum (GSE201348)The image shows the transcriptomic changes along malignancy continuum.log2FC in expression of this searched gene in stem-like cells from each diseased tissue sample relative to stem-like cells in normal samples in each tissue plotted against the malignancy continuum. Samples are colored based on if they are from different disease stage.FAP: Familial adenomatous polyposis
CRC: Colorectal cancer
Colorectum (HTA11)The image shows the transcriptomic changes along malignancy continuum.log2FC in expression of this searched gene in stem-like cells from each diseased tissue sample relative to stem-like cells in normal samples in each tissue plotted against the malignancy continuum. Samples are colored based on if they are from different disease stage.AD: Adenomas
SER: Sessile serrated lesions
MSI-H: Microsatellite-high colorectal cancer
MSS: Microsatellite stable colorectal cancer
EndometriumThe image shows the transcriptomic changes along malignancy continuum.log2FC in expression of this searched gene in stem-like cells from each diseased tissue sample relative to stem-like cells in normal samples in each tissue plotted against the malignancy continuum. Samples are colored based on if they are from different disease stage.
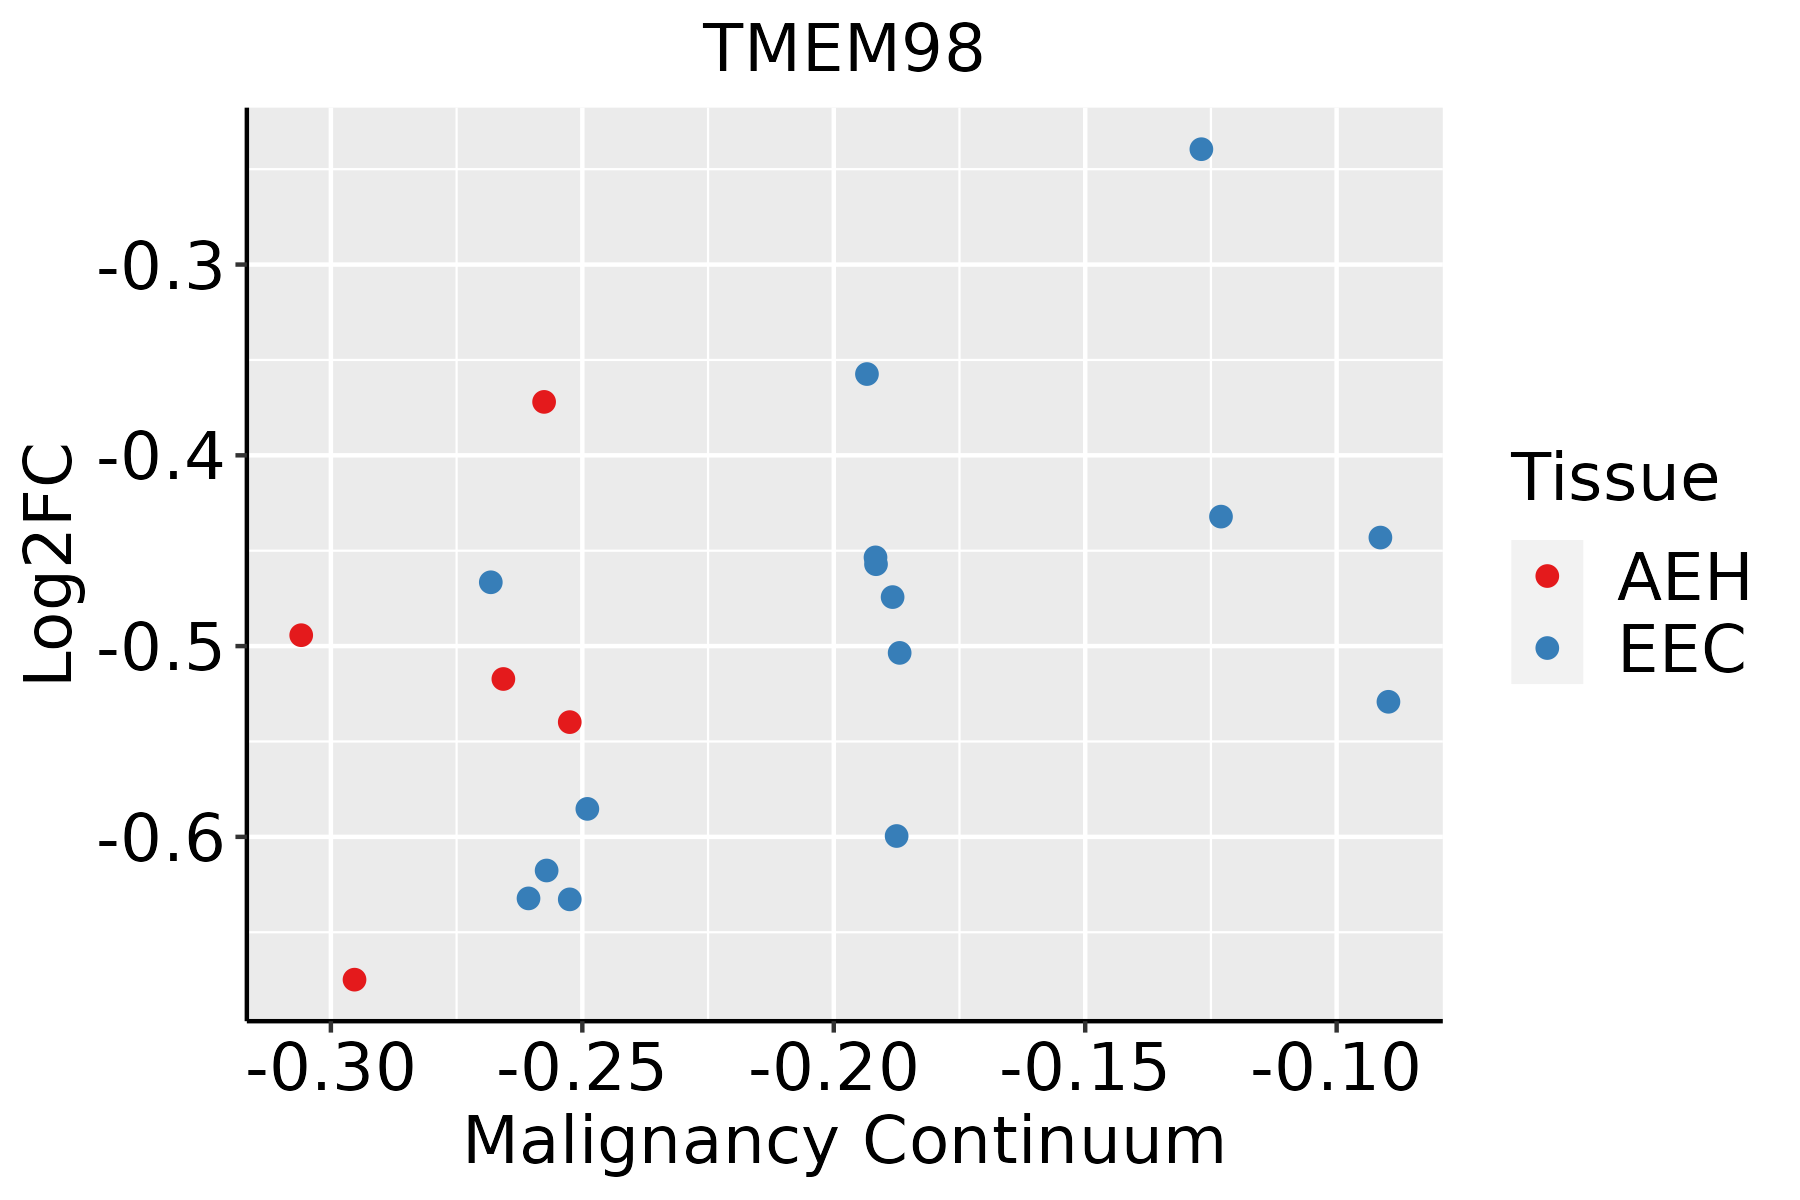
AEH: Atypical endometrial hyperplasia
EEC: Endometrioid Cancer
EsophagusThe image shows the transcriptomic changes along malignancy continuum.log2FC in expression of this searched gene in stem-like cells from each diseased tissue sample relative to stem-like cells in normal samples in each tissue plotted against the malignancy continuum. Samples are colored based on if they are from different disease stage.
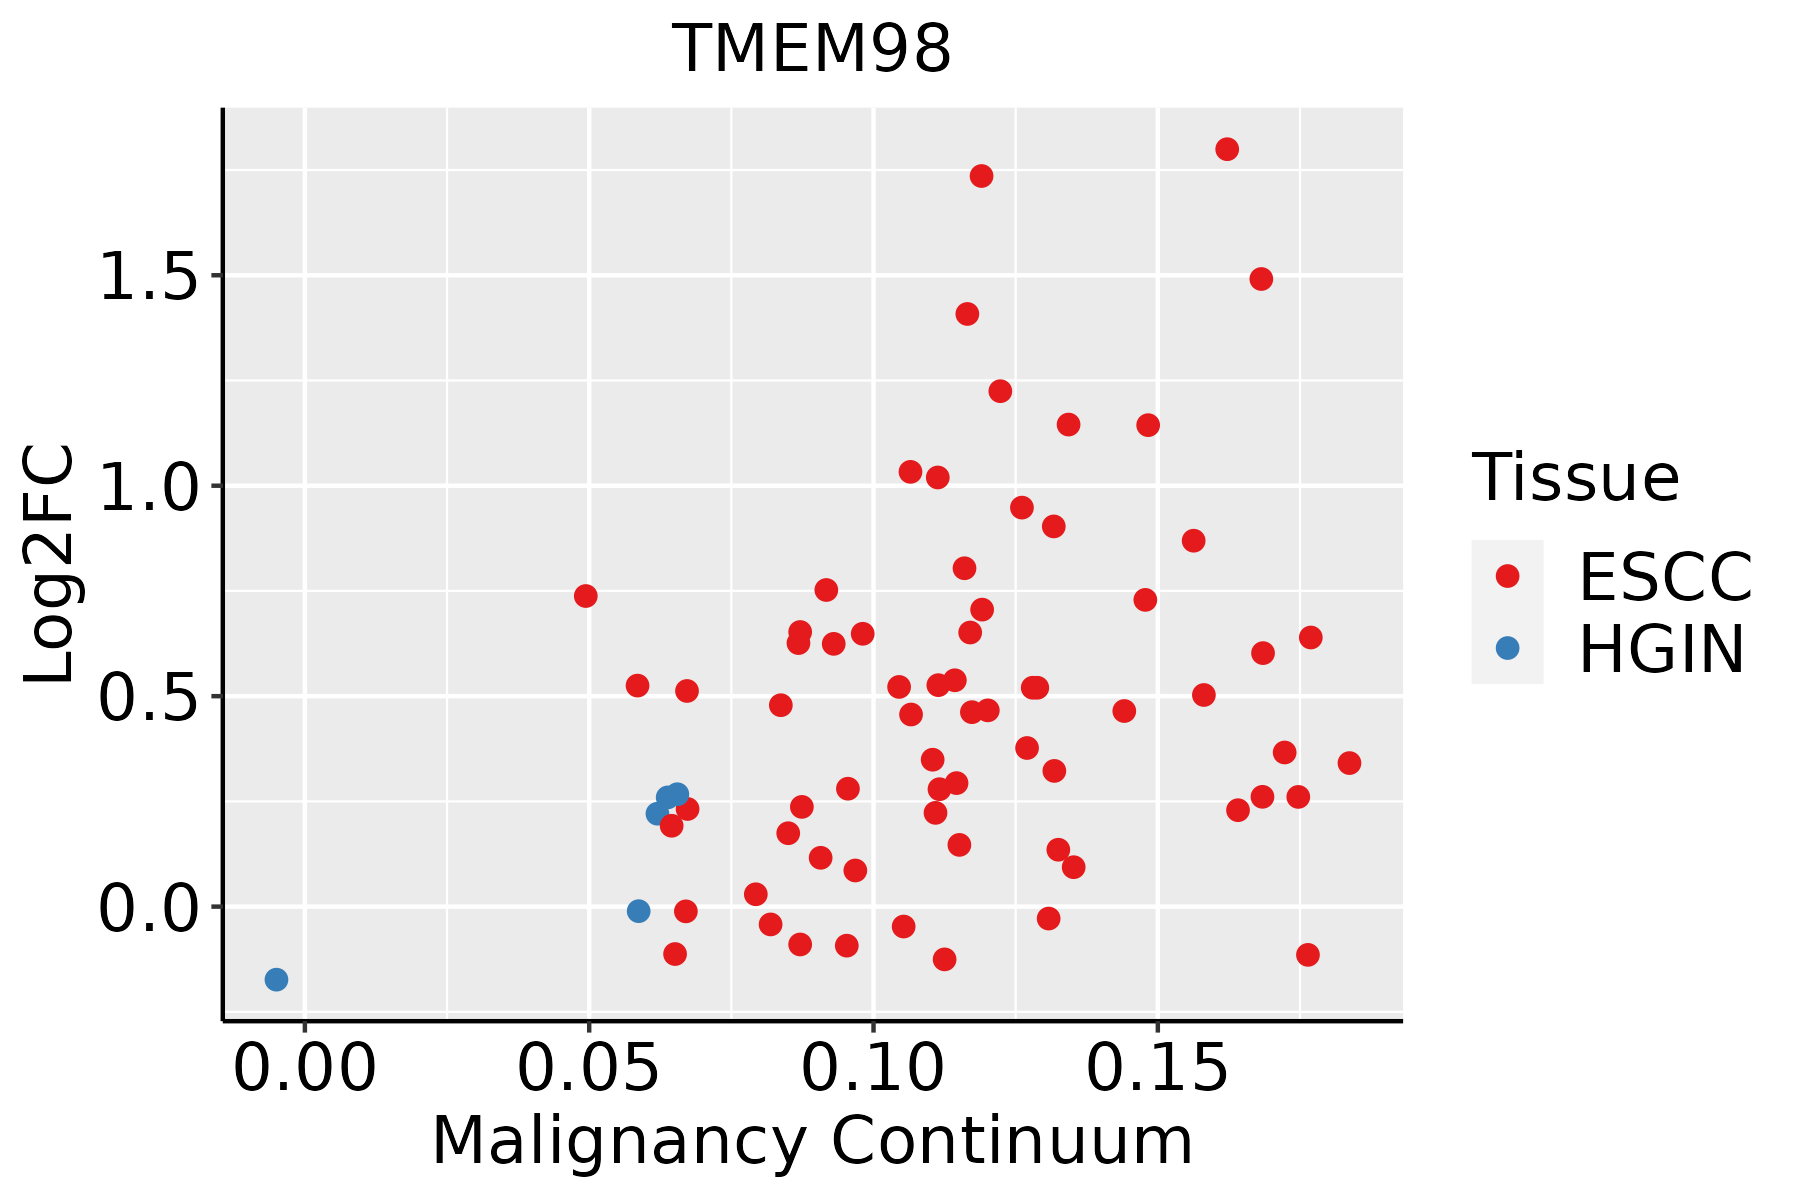
ESCC: Esophageal squamous cell carcinoma
HGIN: High-grade intraepithelial neoplasias
LGIN: Low-grade intraepithelial neoplasias
LiverThe image shows the transcriptomic changes along malignancy continuum.log2FC in expression of this searched gene in stem-like cells from each diseased tissue sample relative to stem-like cells in normal samples in each tissue plotted against the malignancy continuum. Samples are colored based on if they are from different disease stage.HCC: Hepatocellular carcinoma
NAFLD: Non-alcoholic fatty liver disease
Oral CavityThe image shows the transcriptomic changes along malignancy continuum.log2FC in expression of this searched gene in stem-like cells from each diseased tissue sample relative to stem-like cells in normal samples in each tissue plotted against the malignancy continuum. Samples are colored based on if they are from different disease stage.EOLP: Erosive Oral lichen planus
LP: leukoplakia
NEOLP: Non-erosive oral lichen planus
OSCC: Oral squamous cell carcinoma
ProstateThe image shows the transcriptomic changes along malignancy continuum.log2FC in expression of this searched gene in stem-like cells from each diseased tissue sample relative to stem-like cells in normal samples in each tissue plotted against the malignancy continuum. Samples are colored based on if they are from different disease stage.BPH: Benign Prostatic Hyperplasia
ThyroidThe image shows the transcriptomic changes along malignancy continuum.log2FC in expression of this searched gene in stem-like cells from each diseased tissue sample relative to stem-like cells in normal samples in each tissue plotted against the malignancy continuum. Samples are colored based on if they are from different disease stage.
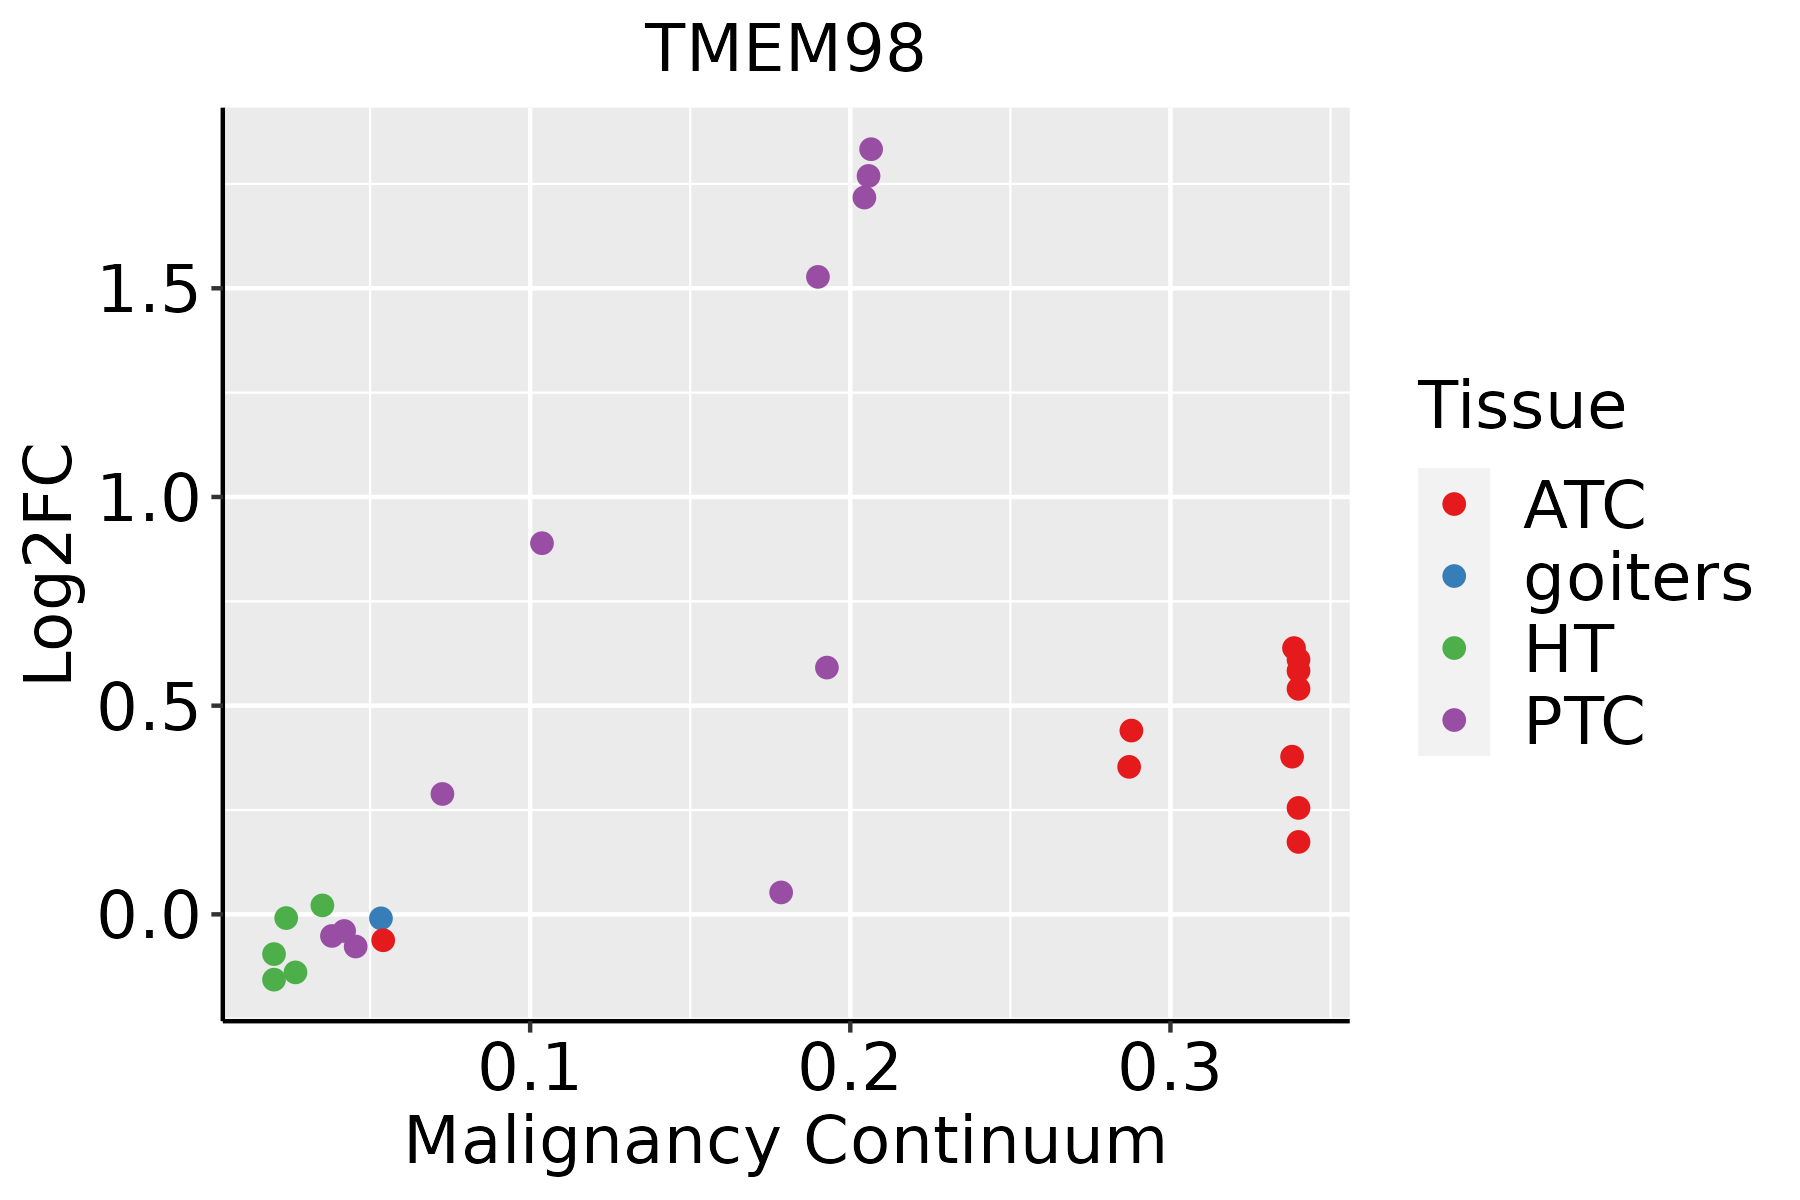
ATC: Anaplastic thyroid cancer
HT: Hashimoto's thyroiditis
PTC: Papillary thyroid cancer
∗log2FC in expression of this searched gene in stem-like cells from each diseased tissue sample relative to stem-like cells in normal samples in each tissue plotted against the malignancy continuum. Samples are colored based on if they are from different disease stage.

Top

Malignant transformation related pathway analysis

check buttonFind out the enriched GO biological processes and KEGG pathways involved in transition from healthy to precancer to cancer
check button Figure of enriched GO biological processes.
TissueDisease StageEnriched GO biological Processes
ColorectumADGO analysis - Figure of enriched GO biological processes: Top 15 enriched GO BP terms are showed in the bar plot of each disease state in each tissue. Each row represents a significant GO biological process which is colored according to the -log10(p.adjust).
ColorectumSERGO analysis - Figure of enriched GO biological processes: Top 15 enriched GO BP terms are showed in the bar plot of each disease state in each tissue. Each row represents a significant GO biological process which is colored according to the -log10(p.adjust).
ColorectumMSSGO analysis - Figure of enriched GO biological processes: Top 15 enriched GO BP terms are showed in the bar plot of each disease state in each tissue. Each row represents a significant GO biological process which is colored according to the -log10(p.adjust).
ColorectumMSI-HGO analysis - Figure of enriched GO biological processes: Top 15 enriched GO BP terms are showed in the bar plot of each disease state in each tissue. Each row represents a significant GO biological process which is colored according to the -log10(p.adjust).
ColorectumFAPGO analysis - Figure of enriched GO biological processes: Top 15 enriched GO BP terms are showed in the bar plot of each disease state in each tissue. Each row represents a significant GO biological process which is colored according to the -log10(p.adjust).
∗Top 15 enriched GO BP terms are showed in the bar plot of each disease state in each tissue. Each row represents a significant GO biological process which is colored according to the -log10(p.adjust).
Page: 1 2 3 4 5 6 7 8 9 

check button Enriched GO biological processes.
GO IDTissueDisease StageDescriptionGene RatioBg Ratiopvaluep.adjustCount
GO:1900180ColorectumADregulation of protein localization to nucleus55/3918136/187231.70e-077.34e-0655
GO:0034504ColorectumADprotein localization to nucleus94/3918290/187232.83e-068.09e-0594
GO:0045861ColorectumADnegative regulation of proteolysis106/3918351/187232.33e-054.57e-04106
GO:0051604ColorectumADprotein maturation85/3918294/187236.73e-046.91e-0385
GO:1903828ColorectumADnegative regulation of cellular protein localization39/3918117/187231.18e-031.06e-0239
GO:0050767ColorectumADregulation of neurogenesis99/3918364/187232.35e-031.82e-0299
GO:0016485ColorectumADprotein processing63/3918225/187236.77e-034.19e-0263
GO:19001801ColorectumSERregulation of protein localization to nucleus46/2897136/187238.50e-085.27e-0646
GO:00458611ColorectumSERnegative regulation of proteolysis88/2897351/187231.74e-067.50e-0588
GO:00345041ColorectumSERprotein localization to nucleus74/2897290/187235.74e-062.05e-0474
GO:00516041ColorectumSERprotein maturation73/2897294/187231.82e-055.38e-0473
GO:00164851ColorectumSERprotein processing55/2897225/187232.84e-044.67e-0355
GO:19038281ColorectumSERnegative regulation of cellular protein localization30/2897117/187232.96e-032.62e-0230
GO:19001802ColorectumMSSregulation of protein localization to nucleus54/3467136/187236.20e-093.95e-0754
GO:00345042ColorectumMSSprotein localization to nucleus92/3467290/187233.66e-081.98e-0692
GO:00458612ColorectumMSSnegative regulation of proteolysis97/3467351/187231.57e-053.54e-0497
GO:00507671ColorectumMSSregulation of neurogenesis94/3467364/187233.12e-044.06e-0394
GO:19038282ColorectumMSSnegative regulation of cellular protein localization36/3467117/187239.19e-049.34e-0336
GO:00516042ColorectumMSSprotein maturation75/3467294/187231.70e-031.53e-0275
GO:0050768ColorectumMSSnegative regulation of neurogenesis39/3467140/187234.30e-033.07e-0239
Page: 1 2 3 4 5 6 7 8 9 

check button Enriched KEGG pathways.
Pathway IDTissueDisease StageDescriptionGene RatioBg Ratiopvaluep.adjustqvalueCount
Page: 1 

Top

Cell-cell communication analysis

check buttonIdentification of potential cell-cell interactions between two cell types and their ligand-receptor pairs for different disease states
LigandReceptorLRpairPathwayTissueDisease Stage
Page: 1 

Top

Single-cell gene regulatory network inference analysis

check buttonFind out the significant the regulons (TFs) and the target genes of each regulon across cell types for different disease states
TFCell TypeTissueDisease StageTarget GeneRSSRegulon Activity
∗The dot plots of a searched regulon are shown for all cell subpopulations in each disease state of each tissue based on the regulon specific score inferred using pySCENIC and by calculating the average expression.
Page: 1 

Top

Somatic mutation of malignant transformation related genes

check buttonAnnotation of somatic variants for genes involved in malignant transformation
Hugo SymbolVariant ClassVariant ClassificationdbSNP RSHGVScHGVSpHGVSp ShortSWISSPROTBIOTYPESIFTPolyPhenTumor Sample BarcodeTissueHistologySexAgeStageTherapy TypesDrugsOutcome
TMEM98SNVMissense_Mutationnovelc.176N>Ap.Pro59Hisp.P59HQ9Y2Y6protein_codingtolerated(0.12)benign(0.232)TCGA-A8-A08H-01Breastbreast invasive carcinomaFemale>=65I/IIUnknownUnknownSD
TMEM98insertionNonsense_Mutationnovelc.610_611insGCTTCAGTTAACTATGTTTAAp.Ala204delinsGlyPheSerTerLeuCysLeuThrp.A204delinsGFS*LCLTQ9Y2Y6protein_codingTCGA-A8-A08H-01Breastbreast invasive carcinomaFemale>=65I/IIUnknownUnknownSD
TMEM98insertionFrame_Shift_Insnovelc.535_536insAATCCAACAATCCCACTCCTTGGTATTTATCCAAAp.Leu179GlnfsTer13p.L179Qfs*13Q9Y2Y6protein_codingTCGA-AN-A0XW-01Breastbreast invasive carcinomaFemale<65III/IVUnknownUnknownSD
TMEM98SNVMissense_Mutationc.196N>Ap.Asp66Asnp.D66NQ9Y2Y6protein_codingtolerated(0.07)benign(0.094)TCGA-FU-A3HZ-01Cervixcervical & endocervical cancerFemale<65I/IIChemotherapycisplatinCR
TMEM98SNVMissense_Mutationc.506N>Cp.Leu169Prop.L169PQ9Y2Y6protein_codingdeleterious(0)probably_damaging(0.999)TCGA-AA-3815-01Colorectumcolon adenocarcinomaFemale>=65I/IIUnknownUnknownSD
TMEM98SNVMissense_Mutationnovelc.578N>Ap.Ala193Aspp.A193DQ9Y2Y6protein_codingdeleterious(0.01)possibly_damaging(0.675)TCGA-F5-6814-01Colorectumrectum adenocarcinomaMale<65I/IIUnknownUnknownSD
TMEM98SNVMissense_Mutationnovelc.268N>Ap.Leu90Ilep.L90IQ9Y2Y6protein_codingdeleterious(0)probably_damaging(0.973)TCGA-A5-A0G2-01Endometriumuterine corpus endometrioid carcinomaFemale<65III/IVUnknownUnknownSD
TMEM98SNVMissense_Mutationrs753209256c.379N>Ap.Asp127Asnp.D127NQ9Y2Y6protein_codingdeleterious(0.03)possibly_damaging(0.555)TCGA-A5-A0G2-01Endometriumuterine corpus endometrioid carcinomaFemale<65III/IVUnknownUnknownSD
TMEM98SNVMissense_Mutationc.544N>Ap.Gly182Serp.G182SQ9Y2Y6protein_codingtolerated(1)benign(0)TCGA-AP-A056-01Endometriumuterine corpus endometrioid carcinomaFemale<65I/IIUnknownUnknownSD
TMEM98SNVMissense_Mutationnovelc.254N>Gp.Glu85Glyp.E85GQ9Y2Y6protein_codingtolerated(0.18)benign(0.266)TCGA-AX-A2H2-01Endometriumuterine corpus endometrioid carcinomaFemale>=65I/IIUnknownUnknownSD
Page: 1 2 3 

Top

Related drugs of malignant transformation related genes

check buttonIdentification of chemicals and drugs interact with genes involved in malignant transfromation
(DGIdb 4.0)
Entrez IDSymbolCategoryInteraction TypesDrug Claim NameDrug NamePMIDs
Page: 1