
|
|||||
|
 | |
| |
| |
| |
| |
| |
|
Gene: TMEM97 |
Gene summary for TMEM97 |
| Gene information | Species | Human | Gene symbol | TMEM97 | Gene ID | 27346 |
| Gene name | transmembrane protein 97 | |
| Gene Alias | MAC30 | |
| Cytomap | 17q11.2 | |
| Gene Type | protein-coding | GO ID | GO:0001558 | UniProtAcc | Q5BJF2 |
Top |
Malignant transformation analysis |
| Identification of the aberrant gene expression in precancerous and cancerous lesions by comparing the gene expression of stem-like cells in diseased tissues with normal stem cells |
| Entrez ID | Symbol | Replicates | Species | Organ | Tissue | Adj P-value | Log2FC | Malignancy |
| 27346 | TMEM97 | LZE2T | Human | Esophagus | ESCC | 3.43e-02 | 5.64e-01 | 0.082 |
| 27346 | TMEM97 | LZE4T | Human | Esophagus | ESCC | 4.15e-13 | 4.54e-01 | 0.0811 |
| 27346 | TMEM97 | LZE7T | Human | Esophagus | ESCC | 1.20e-07 | 4.17e-01 | 0.0667 |
| 27346 | TMEM97 | LZE22T | Human | Esophagus | ESCC | 2.31e-02 | 4.46e-01 | 0.068 |
| 27346 | TMEM97 | LZE24T | Human | Esophagus | ESCC | 1.16e-13 | 5.44e-01 | 0.0596 |
| 27346 | TMEM97 | LZE21T | Human | Esophagus | ESCC | 8.92e-03 | 4.84e-01 | 0.0655 |
| 27346 | TMEM97 | LZE6T | Human | Esophagus | ESCC | 3.84e-03 | 2.37e-01 | 0.0845 |
| 27346 | TMEM97 | P2T-E | Human | Esophagus | ESCC | 5.32e-43 | 1.01e+00 | 0.1177 |
| 27346 | TMEM97 | P4T-E | Human | Esophagus | ESCC | 1.20e-55 | 1.63e+00 | 0.1323 |
| 27346 | TMEM97 | P5T-E | Human | Esophagus | ESCC | 1.05e-23 | 6.46e-01 | 0.1327 |
| 27346 | TMEM97 | P8T-E | Human | Esophagus | ESCC | 9.41e-07 | 2.11e-01 | 0.0889 |
| 27346 | TMEM97 | P9T-E | Human | Esophagus | ESCC | 7.86e-09 | 3.58e-01 | 0.1131 |
| 27346 | TMEM97 | P10T-E | Human | Esophagus | ESCC | 3.33e-59 | 1.34e+00 | 0.116 |
| 27346 | TMEM97 | P11T-E | Human | Esophagus | ESCC | 4.56e-10 | 2.92e-01 | 0.1426 |
| 27346 | TMEM97 | P12T-E | Human | Esophagus | ESCC | 4.58e-26 | 6.59e-01 | 0.1122 |
| 27346 | TMEM97 | P15T-E | Human | Esophagus | ESCC | 1.77e-27 | 1.02e+00 | 0.1149 |
| 27346 | TMEM97 | P16T-E | Human | Esophagus | ESCC | 1.11e-47 | 9.93e-01 | 0.1153 |
| 27346 | TMEM97 | P19T-E | Human | Esophagus | ESCC | 3.19e-04 | 2.38e-01 | 0.1662 |
| 27346 | TMEM97 | P20T-E | Human | Esophagus | ESCC | 1.72e-10 | 3.36e-01 | 0.1124 |
| 27346 | TMEM97 | P21T-E | Human | Esophagus | ESCC | 4.50e-34 | 7.95e-01 | 0.1617 |
| Page: 1 2 3 4 5 |
| Tissue | Expression Dynamics | Abbreviation |
| Esophagus | 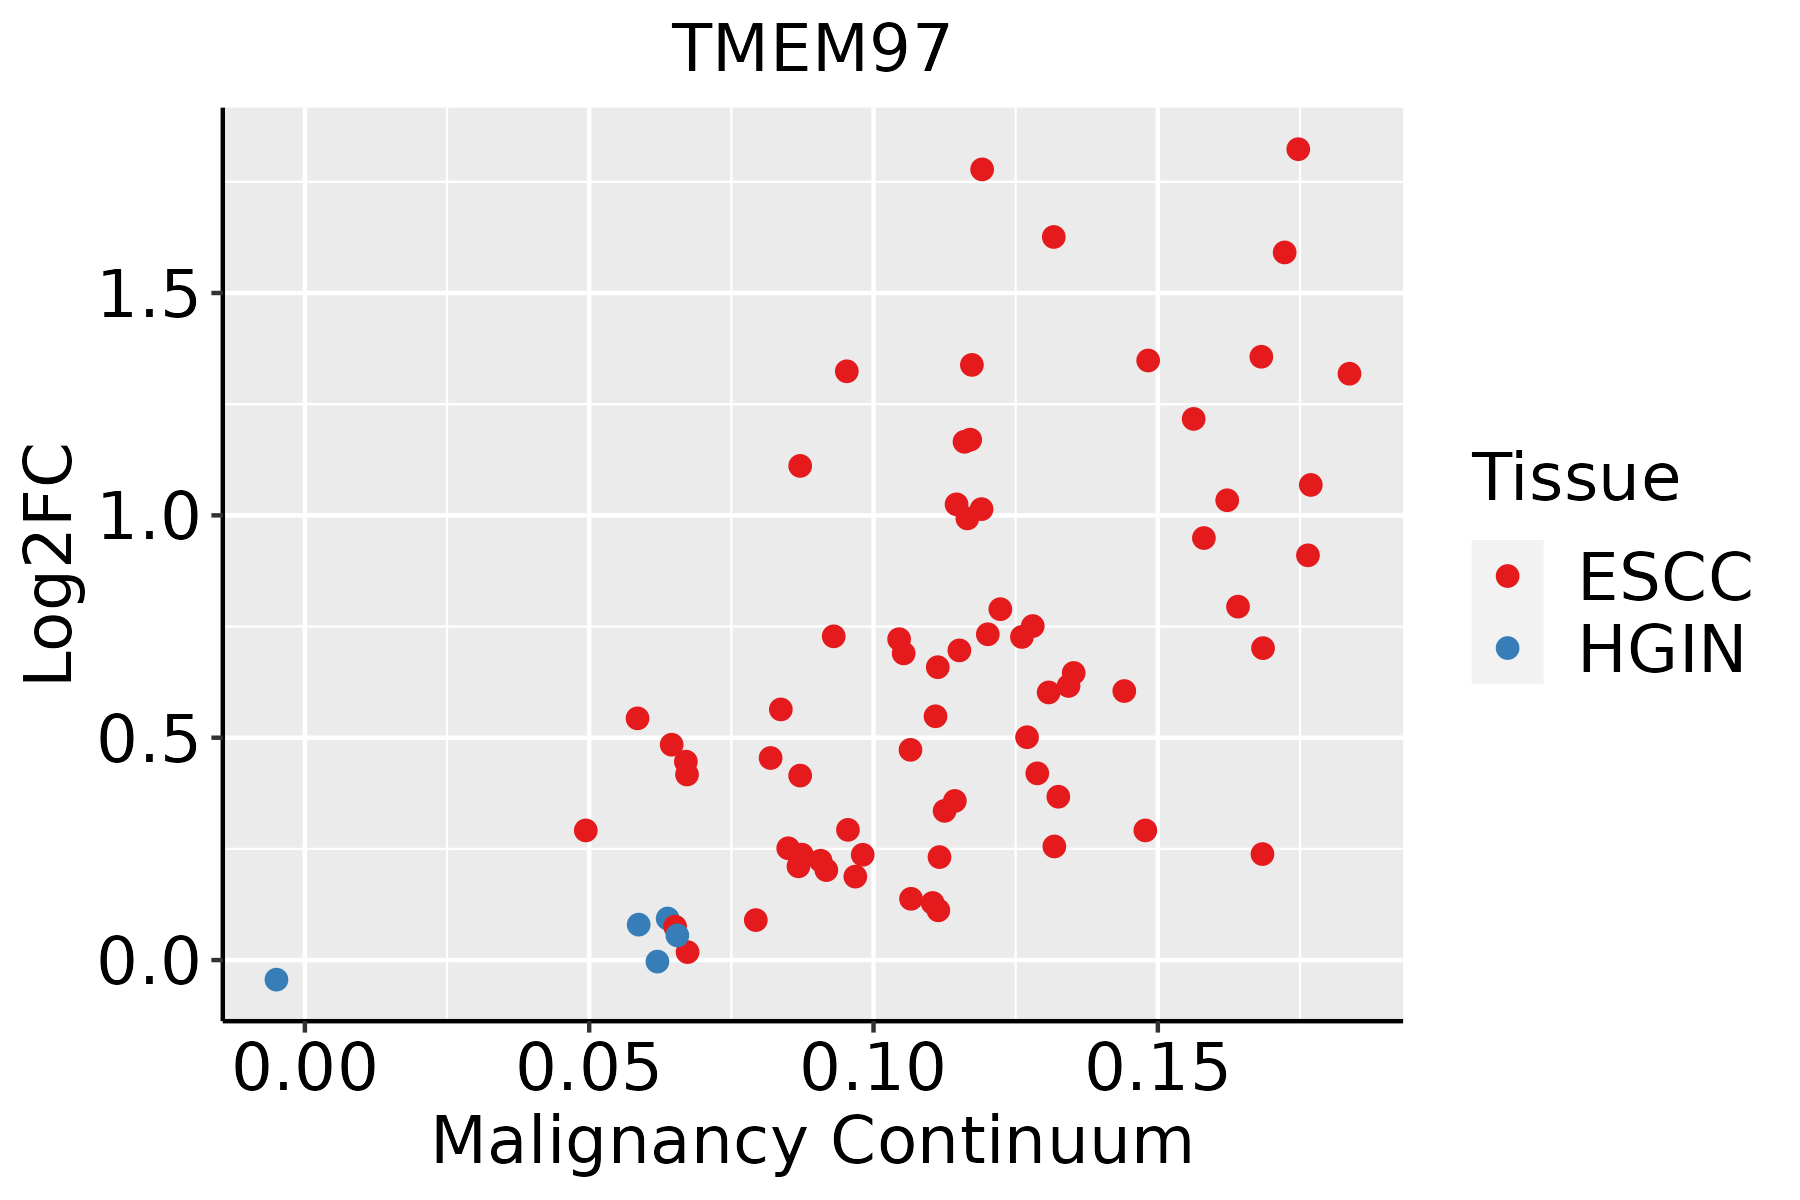 | ESCC: Esophageal squamous cell carcinoma |
| HGIN: High-grade intraepithelial neoplasias | ||
| LGIN: Low-grade intraepithelial neoplasias | ||
| Liver |  | HCC: Hepatocellular carcinoma |
| NAFLD: Non-alcoholic fatty liver disease | ||
| Oral Cavity | 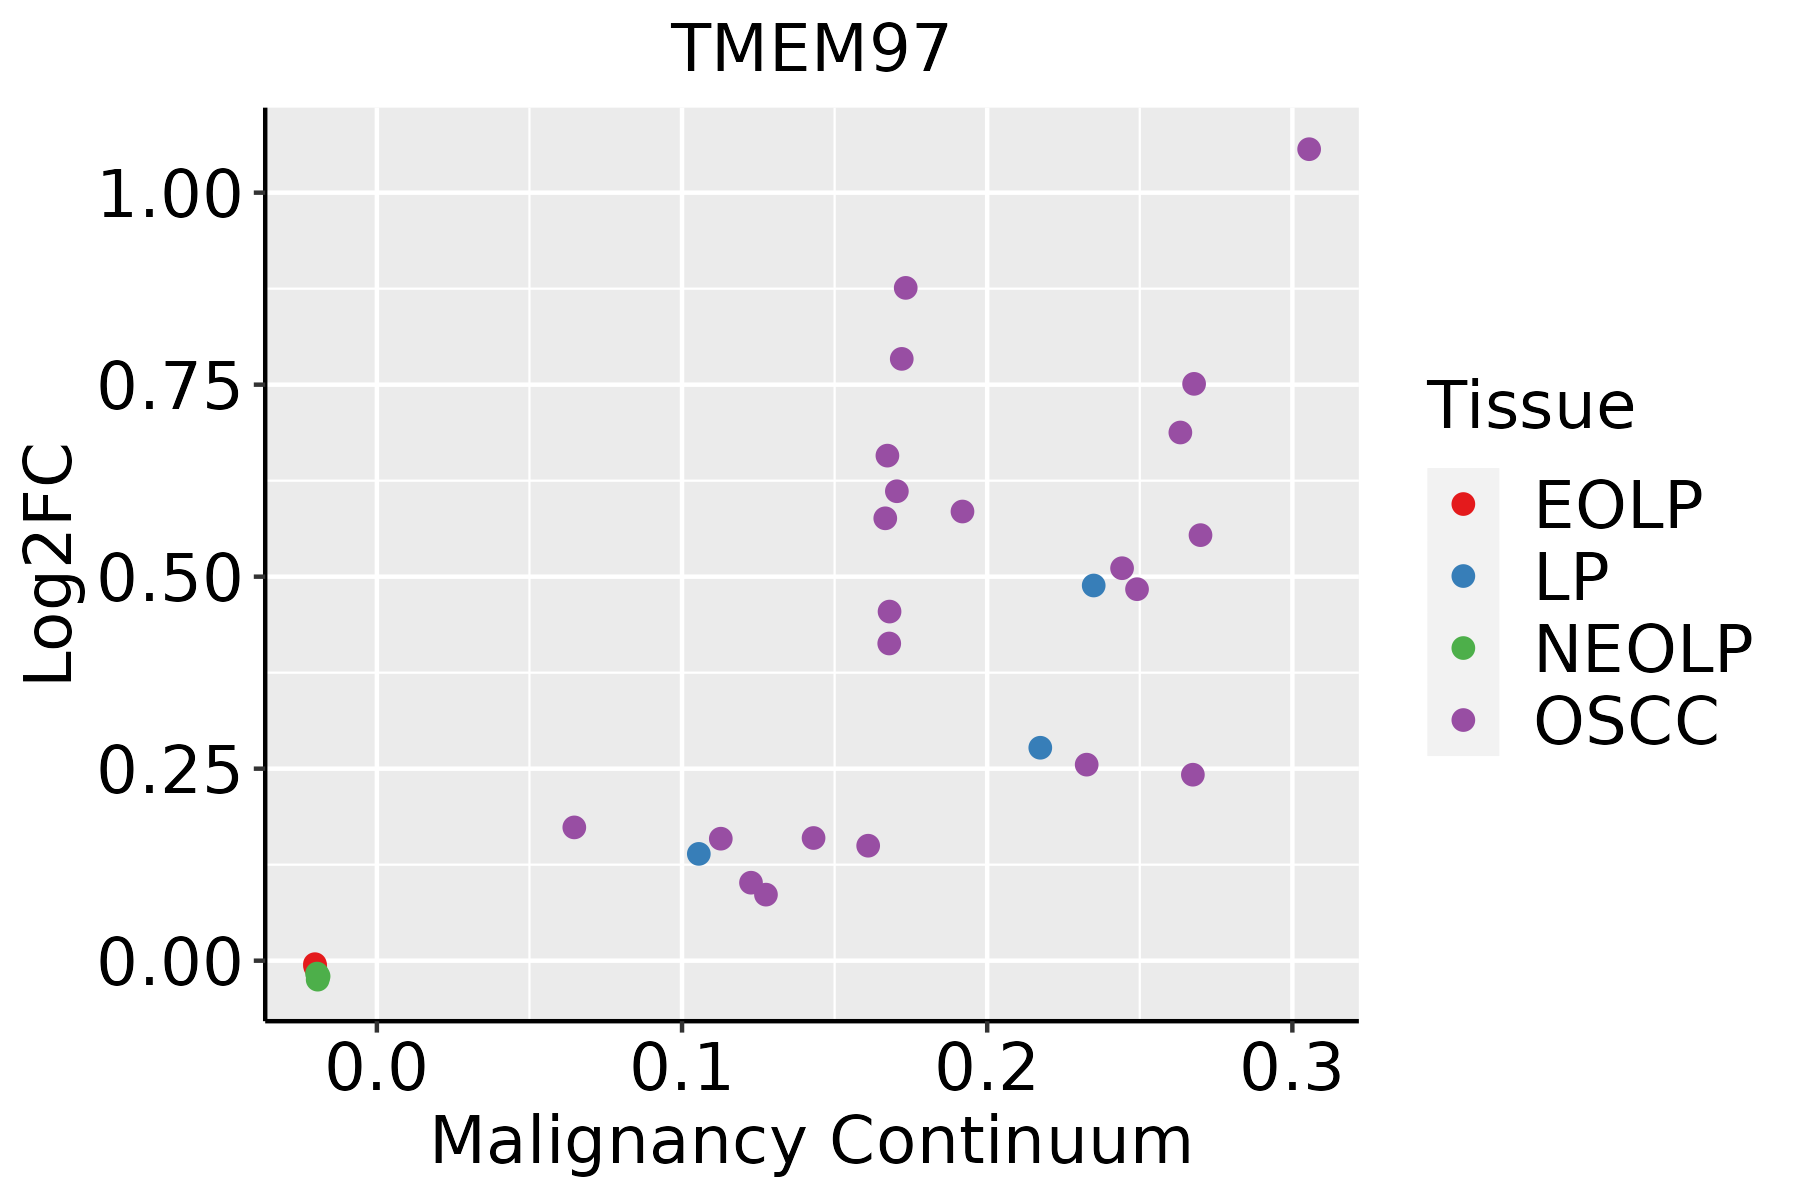 | EOLP: Erosive Oral lichen planus |
| LP: leukoplakia | ||
| NEOLP: Non-erosive oral lichen planus | ||
| OSCC: Oral squamous cell carcinoma | ||
| Skin | 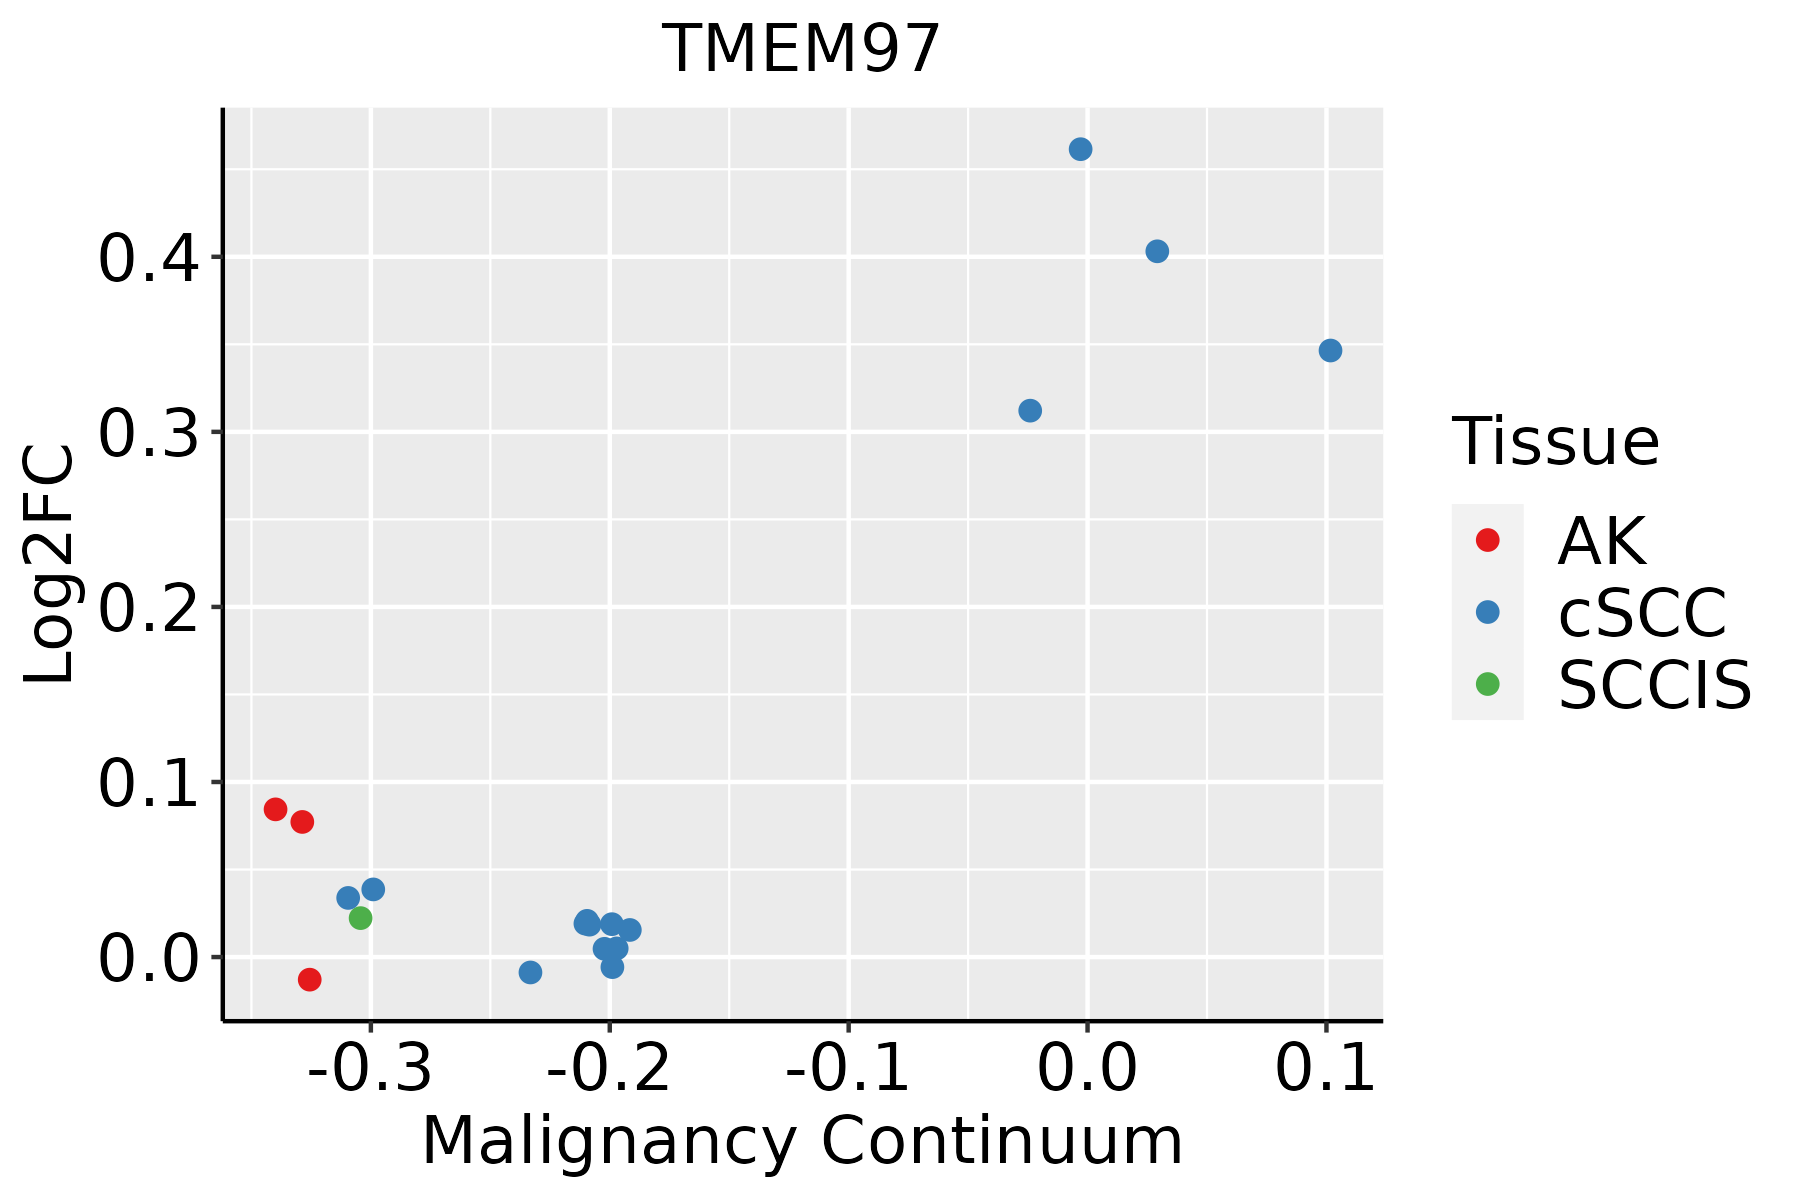 | AK: Actinic keratosis |
| cSCC: Cutaneous squamous cell carcinoma | ||
| SCCIS:squamous cell carcinoma in situ |
| ∗log2FC in expression of this searched gene in stem-like cells from each diseased tissue sample relative to stem-like cells in normal samples in each tissue plotted against the malignancy continuum. Samples are colored based on if they are from different disease stage. |
Top |
Malignant transformation related pathway analysis |
| Find out the enriched GO biological processes and KEGG pathways involved in transition from healthy to precancer to cancer |
| Tissue | Disease Stage | Enriched GO biological Processes |
| Colorectum | AD |  |
| Colorectum | SER |  |
| Colorectum | MSS |  |
| Colorectum | MSI-H |  |
| Colorectum | FAP |  |
| ∗Top 15 enriched GO BP terms are showed in the bar plot of each disease state in each tissue. Each row represents a significant GO biological process which is colored according to the -log10(p.adjust). |
| Page: 1 2 3 4 5 6 7 8 9 |
| GO ID | Tissue | Disease Stage | Description | Gene Ratio | Bg Ratio | pvalue | p.adjust | Count |
| GO:0016049110 | Esophagus | ESCC | cell growth | 289/8552 | 482/18723 | 1.29e-10 | 3.77e-09 | 289 |
| GO:000155819 | Esophagus | ESCC | regulation of cell growth | 248/8552 | 414/18723 | 2.97e-09 | 6.45e-08 | 248 |
| GO:005508811 | Liver | Cirrhotic | lipid homeostasis | 74/4634 | 167/18723 | 2.46e-08 | 8.51e-07 | 74 |
| GO:004263211 | Liver | Cirrhotic | cholesterol homeostasis | 46/4634 | 96/18723 | 7.15e-07 | 1.52e-05 | 46 |
| GO:005509211 | Liver | Cirrhotic | sterol homeostasis | 46/4634 | 97/18723 | 1.04e-06 | 2.13e-05 | 46 |
| GO:001604911 | Liver | Cirrhotic | cell growth | 160/4634 | 482/18723 | 1.50e-05 | 2.07e-04 | 160 |
| GO:000155811 | Liver | Cirrhotic | regulation of cell growth | 132/4634 | 414/18723 | 5.53e-04 | 4.36e-03 | 132 |
| GO:001604921 | Liver | HCC | cell growth | 269/7958 | 482/18723 | 1.84e-09 | 5.35e-08 | 269 |
| GO:000155821 | Liver | HCC | regulation of cell growth | 228/7958 | 414/18723 | 1.34e-07 | 2.55e-06 | 228 |
| GO:00550882 | Liver | HCC | lipid homeostasis | 103/7958 | 167/18723 | 4.27e-07 | 7.18e-06 | 103 |
| GO:005509221 | Liver | HCC | sterol homeostasis | 59/7958 | 97/18723 | 2.06e-04 | 1.58e-03 | 59 |
| GO:004263221 | Liver | HCC | cholesterol homeostasis | 58/7958 | 96/18723 | 2.99e-04 | 2.13e-03 | 58 |
| GO:001604917 | Oral cavity | OSCC | cell growth | 268/7305 | 482/18723 | 6.55e-14 | 3.51e-12 | 268 |
| GO:000155816 | Oral cavity | OSCC | regulation of cell growth | 228/7305 | 414/18723 | 1.74e-11 | 6.09e-10 | 228 |
| GO:001604918 | Oral cavity | LP | cell growth | 155/4623 | 482/18723 | 1.08e-04 | 1.31e-03 | 155 |
| GO:000155817 | Oral cavity | LP | regulation of cell growth | 134/4623 | 414/18723 | 2.25e-04 | 2.41e-03 | 134 |
| GO:001604925 | Skin | cSCC | cell growth | 173/4864 | 482/18723 | 7.21e-07 | 1.34e-05 | 173 |
| GO:000155824 | Skin | cSCC | regulation of cell growth | 140/4864 | 414/18723 | 2.07e-04 | 1.72e-03 | 140 |
| Page: 1 |
| Pathway ID | Tissue | Disease Stage | Description | Gene Ratio | Bg Ratio | pvalue | p.adjust | qvalue | Count |
| Page: 1 |
Top |
Cell-cell communication analysis |
| Identification of potential cell-cell interactions between two cell types and their ligand-receptor pairs for different disease states |
| Ligand | Receptor | LRpair | Pathway | Tissue | Disease Stage |
| Page: 1 |
Top |
Single-cell gene regulatory network inference analysis |
| Find out the significant the regulons (TFs) and the target genes of each regulon across cell types for different disease states |
| TF | Cell Type | Tissue | Disease Stage | Target Gene | RSS | Regulon Activity |
| ∗The dot plots of a searched regulon are shown for all cell subpopulations in each disease state of each tissue based on the regulon specific score inferred using pySCENIC and by calculating the average expression. |
| Page: 1 |
Top |
Somatic mutation of malignant transformation related genes |
| Annotation of somatic variants for genes involved in malignant transformation |
| Hugo Symbol | Variant Class | Variant Classification | dbSNP RS | HGVSc | HGVSp | HGVSp Short | SWISSPROT | BIOTYPE | SIFT | PolyPhen | Tumor Sample Barcode | Tissue | Histology | Sex | Age | Stage | Therapy Types | Drugs | Outcome |
| TMEM97 | SNV | Missense_Mutation | rs781934593 | c.254N>T | p.Thr85Met | p.T85M | Q5BJF2 | protein_coding | deleterious(0.02) | possibly_damaging(0.666) | TCGA-2W-A8YY-01 | Cervix | cervical & endocervical cancer | Female | <65 | I/II | Chemotherapy | cisplatin | CR |
| TMEM97 | SNV | Missense_Mutation | novel | c.505T>A | p.Tyr169Asn | p.Y169N | Q5BJF2 | protein_coding | tolerated(0.37) | benign(0.011) | TCGA-AA-A01T-01 | Colorectum | colon adenocarcinoma | Female | <65 | III/IV | Chemotherapy | 5-fluorouracil | CR |
| TMEM97 | SNV | Missense_Mutation | novel | c.505N>A | p.Tyr169Asn | p.Y169N | Q5BJF2 | protein_coding | tolerated(0.37) | benign(0.011) | TCGA-G4-6314-01 | Colorectum | colon adenocarcinoma | Female | >=65 | III/IV | Ancillary | leucovorin | SD |
| TMEM97 | SNV | Missense_Mutation | novel | c.266T>A | p.Leu89His | p.L89H | Q5BJF2 | protein_coding | deleterious(0.01) | benign(0.08) | TCGA-AG-3878-01 | Colorectum | rectum adenocarcinoma | Male | <65 | I/II | Unknown | Unknown | SD |
| TMEM97 | SNV | Missense_Mutation | novel | c.299N>T | p.Ala100Val | p.A100V | Q5BJF2 | protein_coding | tolerated(0.14) | benign(0.373) | TCGA-AP-A1DH-01 | Endometrium | uterine corpus endometrioid carcinoma | Female | <65 | I/II | Unknown | Unknown | SD |
| TMEM97 | SNV | Missense_Mutation | novel | c.191N>T | p.Ala64Val | p.A64V | Q5BJF2 | protein_coding | tolerated(0.52) | benign(0.001) | TCGA-AP-A1DK-01 | Endometrium | uterine corpus endometrioid carcinoma | Female | <65 | I/II | Unknown | Unknown | SD |
| TMEM97 | SNV | Missense_Mutation | novel | c.518N>T | p.Arg173Ile | p.R173I | Q5BJF2 | protein_coding | deleterious(0.04) | benign(0.012) | TCGA-AP-A1E0-01 | Endometrium | uterine corpus endometrioid carcinoma | Female | <65 | III/IV | Chemotherapy | paclitaxel | SD |
| TMEM97 | SNV | Missense_Mutation | novel | c.263T>C | p.Phe88Ser | p.F88S | Q5BJF2 | protein_coding | deleterious(0) | probably_damaging(0.969) | TCGA-B5-A3FC-01 | Endometrium | uterine corpus endometrioid carcinoma | Female | <65 | I/II | Unknown | Unknown | SD |
| TMEM97 | SNV | Missense_Mutation | c.148N>C | p.Tyr50His | p.Y50H | Q5BJF2 | protein_coding | tolerated(0.07) | benign(0.38) | TCGA-BS-A0TA-01 | Endometrium | uterine corpus endometrioid carcinoma | Female | <65 | III/IV | Chemotherapy | taxol | PD | |
| TMEM97 | SNV | Missense_Mutation | rs782388057 | c.290G>A | p.Arg97Gln | p.R97Q | Q5BJF2 | protein_coding | deleterious(0) | probably_damaging(0.996) | TCGA-D1-A17Q-01 | Endometrium | uterine corpus endometrioid carcinoma | Female | <65 | I/II | Unknown | Unknown | SD |
| Page: 1 2 |
Top |
Related drugs of malignant transformation related genes |
| Identification of chemicals and drugs interact with genes involved in malignant transfromation |
| (DGIdb 4.0) |
| Entrez ID | Symbol | Category | Interaction Types | Drug Claim Name | Drug Name | PMIDs |
| 27346 | TMEM97 | NA | ANAVEX 1007 | |||
| 27346 | TMEM97 | NA | N-substituted 9-azabicyclo[3.3.1]nonan-3alpha-yl-phenylcarbamate analog 3 | |||
| 27346 | TMEM97 | NA | PMID30185082-Compound-54 | |||
| 27346 | TMEM97 | NA | Fused aryl carbocycle derivative 3 | |||
| 27346 | TMEM97 | NA | Fused aryl carbocycle derivative 4 | |||
| 27346 | TMEM97 | NA | Benzamide derivative 9 | |||
| 27346 | TMEM97 | NA | PMID30185082-Compound-57 | |||
| 27346 | TMEM97 | NA | Piperazinyl methyl quinazolinone derivative 3 | |||
| 27346 | TMEM97 | NA | PMID30185082-Compound-28 | |||
| 27346 | TMEM97 | NA | PMID30185082-Compound-56 |
| Page: 1 2 3 4 5 6 |

Copyright 2023-Present -The University of Texas Health Science Center at Houston |