
|
|||||
|
 | |
| |
| |
| |
| |
| |
|
Gene: TMEM94 |
Gene summary for TMEM94 |
| Gene information | Species | Human | Gene symbol | TMEM94 | Gene ID | 9772 |
| Gene name | transmembrane protein 94 | |
| Gene Alias | IDDCDF | |
| Cytomap | 17q25.1 | |
| Gene Type | protein-coding | GO ID | GO:0005575 | UniProtAcc | B7Z9U5 |
Top |
Malignant transformation analysis |
| Identification of the aberrant gene expression in precancerous and cancerous lesions by comparing the gene expression of stem-like cells in diseased tissues with normal stem cells |
| Entrez ID | Symbol | Replicates | Species | Organ | Tissue | Adj P-value | Log2FC | Malignancy |
| 9772 | TMEM94 | HTA11_2487_2000001011 | Human | Colorectum | SER | 1.95e-04 | 2.56e-01 | -0.1808 |
| 9772 | TMEM94 | HTA11_347_2000001011 | Human | Colorectum | AD | 1.26e-06 | 3.41e-01 | -0.1954 |
| 9772 | TMEM94 | HTA11_411_2000001011 | Human | Colorectum | SER | 1.79e-04 | 8.13e-01 | -0.2602 |
| 9772 | TMEM94 | HTA11_83_2000001011 | Human | Colorectum | SER | 4.74e-03 | 3.38e-01 | -0.1526 |
| 9772 | TMEM94 | HTA11_696_2000001011 | Human | Colorectum | AD | 4.01e-02 | 2.52e-01 | -0.1464 |
| 9772 | TMEM94 | HTA11_1391_2000001011 | Human | Colorectum | AD | 9.22e-03 | 2.50e-01 | -0.059 |
| 9772 | TMEM94 | HTA11_7696_3000711011 | Human | Colorectum | AD | 2.33e-04 | 2.64e-01 | 0.0674 |
| 9772 | TMEM94 | HTA11_99999971662_82457 | Human | Colorectum | MSS | 1.81e-03 | 3.61e-01 | 0.3859 |
| 9772 | TMEM94 | HTA11_99999974143_84620 | Human | Colorectum | MSS | 3.69e-02 | 2.77e-01 | 0.3005 |
| 9772 | TMEM94 | LZE4T | Human | Esophagus | ESCC | 9.16e-04 | 9.11e-02 | 0.0811 |
| 9772 | TMEM94 | LZE7T | Human | Esophagus | ESCC | 3.18e-04 | 2.61e-01 | 0.0667 |
| 9772 | TMEM94 | LZE24T | Human | Esophagus | ESCC | 1.03e-08 | 3.63e-01 | 0.0596 |
| 9772 | TMEM94 | P1T-E | Human | Esophagus | ESCC | 6.43e-03 | 3.42e-01 | 0.0875 |
| 9772 | TMEM94 | P2T-E | Human | Esophagus | ESCC | 2.36e-14 | 1.97e-01 | 0.1177 |
| 9772 | TMEM94 | P4T-E | Human | Esophagus | ESCC | 3.86e-06 | 7.53e-02 | 0.1323 |
| 9772 | TMEM94 | P8T-E | Human | Esophagus | ESCC | 1.52e-12 | 2.47e-01 | 0.0889 |
| 9772 | TMEM94 | P10T-E | Human | Esophagus | ESCC | 5.55e-57 | 1.04e+00 | 0.116 |
| 9772 | TMEM94 | P11T-E | Human | Esophagus | ESCC | 2.83e-04 | 2.54e-01 | 0.1426 |
| 9772 | TMEM94 | P12T-E | Human | Esophagus | ESCC | 1.03e-17 | 2.84e-01 | 0.1122 |
| 9772 | TMEM94 | P15T-E | Human | Esophagus | ESCC | 5.91e-15 | 2.44e-01 | 0.1149 |
| Page: 1 2 3 4 |
| Tissue | Expression Dynamics | Abbreviation |
| Colorectum (GSE201348) |  | FAP: Familial adenomatous polyposis |
| CRC: Colorectal cancer | ||
| Colorectum (HTA11) |  | AD: Adenomas |
| SER: Sessile serrated lesions | ||
| MSI-H: Microsatellite-high colorectal cancer | ||
| MSS: Microsatellite stable colorectal cancer | ||
| Esophagus | 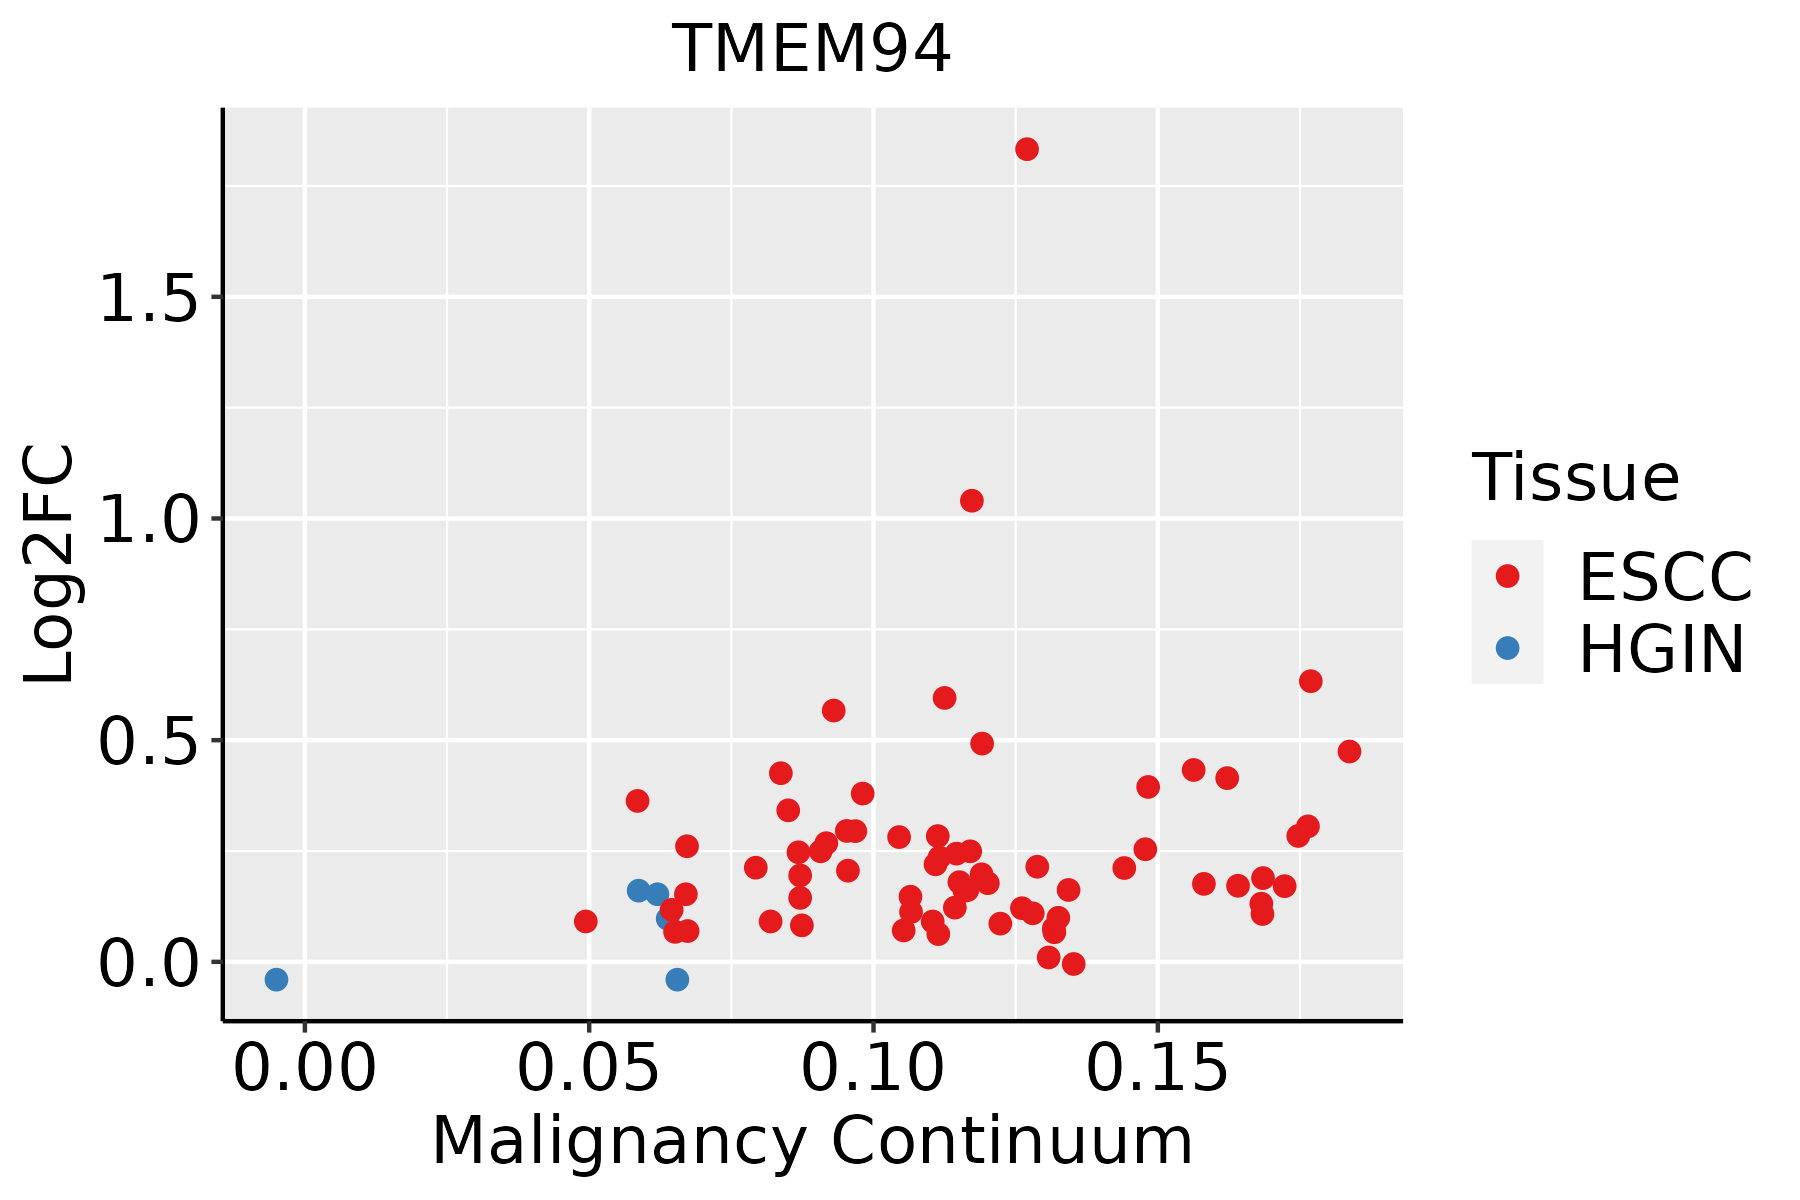 | ESCC: Esophageal squamous cell carcinoma |
| HGIN: High-grade intraepithelial neoplasias | ||
| LGIN: Low-grade intraepithelial neoplasias | ||
| Liver | 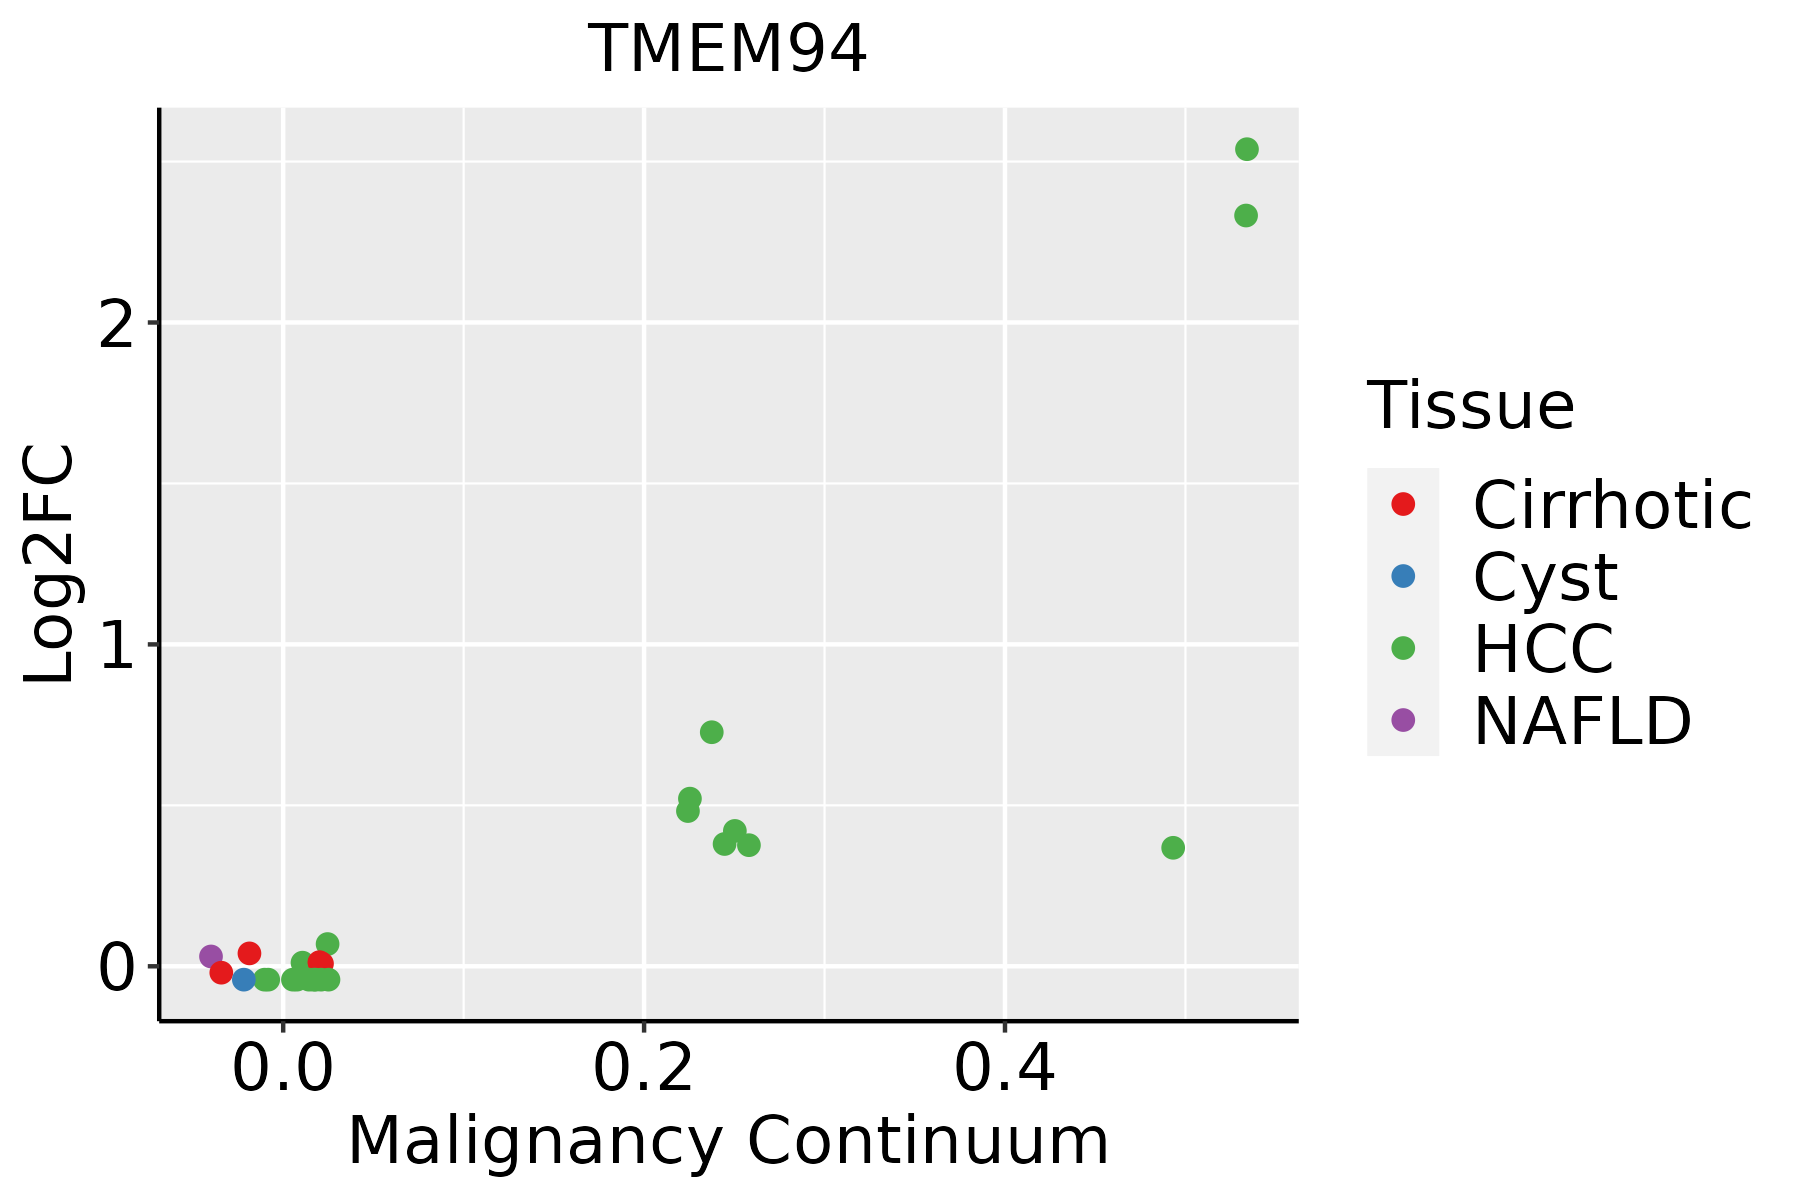 | HCC: Hepatocellular carcinoma |
| NAFLD: Non-alcoholic fatty liver disease |
| ∗log2FC in expression of this searched gene in stem-like cells from each diseased tissue sample relative to stem-like cells in normal samples in each tissue plotted against the malignancy continuum. Samples are colored based on if they are from different disease stage. |
Top |
Malignant transformation related pathway analysis |
| Find out the enriched GO biological processes and KEGG pathways involved in transition from healthy to precancer to cancer |
| Tissue | Disease Stage | Enriched GO biological Processes |
| Colorectum | AD |  |
| Colorectum | SER |  |
| Colorectum | MSS |  |
| Colorectum | MSI-H |  |
| Colorectum | FAP |  |
| ∗Top 15 enriched GO BP terms are showed in the bar plot of each disease state in each tissue. Each row represents a significant GO biological process which is colored according to the -log10(p.adjust). |
| Page: 1 2 3 4 5 6 7 8 9 |
| GO ID | Tissue | Disease Stage | Description | Gene Ratio | Bg Ratio | pvalue | p.adjust | Count |
| Page: 1 |
| Pathway ID | Tissue | Disease Stage | Description | Gene Ratio | Bg Ratio | pvalue | p.adjust | qvalue | Count |
| Page: 1 |
Top |
Cell-cell communication analysis |
| Identification of potential cell-cell interactions between two cell types and their ligand-receptor pairs for different disease states |
| Ligand | Receptor | LRpair | Pathway | Tissue | Disease Stage |
| Page: 1 |
Top |
Single-cell gene regulatory network inference analysis |
| Find out the significant the regulons (TFs) and the target genes of each regulon across cell types for different disease states |
| TF | Cell Type | Tissue | Disease Stage | Target Gene | RSS | Regulon Activity |
| ∗The dot plots of a searched regulon are shown for all cell subpopulations in each disease state of each tissue based on the regulon specific score inferred using pySCENIC and by calculating the average expression. |
| Page: 1 |
Top |
Somatic mutation of malignant transformation related genes |
| Annotation of somatic variants for genes involved in malignant transformation |
| Hugo Symbol | Variant Class | Variant Classification | dbSNP RS | HGVSc | HGVSp | HGVSp Short | SWISSPROT | BIOTYPE | SIFT | PolyPhen | Tumor Sample Barcode | Tissue | Histology | Sex | Age | Stage | Therapy Types | Drugs | Outcome |
| TMEM94 | SNV | Missense_Mutation | c.2914N>G | p.Leu972Val | p.L972V | protein_coding | deleterious(0.01) | probably_damaging(0.996) | TCGA-A2-A0T0-01 | Breast | breast invasive carcinoma | Female | <65 | I/II | Chemotherapy | taxotere | SD | ||
| TMEM94 | SNV | Missense_Mutation | c.2186N>T | p.Gly729Val | p.G729V | protein_coding | deleterious(0) | probably_damaging(0.981) | TCGA-A7-A26H-01 | Breast | breast invasive carcinoma | Female | >=65 | I/II | Hormone Therapy | anastrozole | PD | ||
| TMEM94 | SNV | Missense_Mutation | novel | c.1792N>C | p.Asn598His | p.N598H | protein_coding | deleterious(0.02) | possibly_damaging(0.534) | TCGA-AN-A046-01 | Breast | breast invasive carcinoma | Female | >=65 | I/II | Unknown | Unknown | SD | |
| TMEM94 | SNV | Missense_Mutation | rs369687856 | c.686N>A | p.Pro229His | p.P229H | protein_coding | tolerated(0.11) | probably_damaging(0.999) | TCGA-BH-A1FN-01 | Breast | breast invasive carcinoma | Female | <65 | I/II | Unknown | Unknown | PD | |
| TMEM94 | SNV | Missense_Mutation | novel | c.1886N>A | p.Ser629Asn | p.S629N | protein_coding | tolerated(0.42) | benign(0) | TCGA-BH-A28O-01 | Breast | breast invasive carcinoma | Female | <65 | III/IV | Chemotherapy | cytoxan | CR | |
| TMEM94 | SNV | Missense_Mutation | novel | c.584N>C | p.Gly195Ala | p.G195A | protein_coding | deleterious(0.01) | possibly_damaging(0.54) | TCGA-BH-A2L8-01 | Breast | breast invasive carcinoma | Female | <65 | I/II | Chemotherapy | cytoxan | CR | |
| TMEM94 | SNV | Missense_Mutation | c.2186N>C | p.Gly729Ala | p.G729A | protein_coding | deleterious(0) | possibly_damaging(0.886) | TCGA-C8-A26Y-01 | Breast | breast invasive carcinoma | Female | >=65 | I/II | Unknown | Unknown | SD | ||
| TMEM94 | SNV | Missense_Mutation | novel | c.1517N>T | p.Pro506Leu | p.P506L | protein_coding | deleterious(0.03) | benign(0.009) | TCGA-C8-A3M8-01 | Breast | breast invasive carcinoma | Female | >=65 | I/II | Hormone Therapy | tamoxiphen | CR | |
| TMEM94 | insertion | Frame_Shift_Ins | novel | c.2635dupA | p.Met879AsnfsTer18 | p.M879Nfs*18 | protein_coding | TCGA-A8-A075-01 | Breast | breast invasive carcinoma | Female | <65 | I/II | Chemotherapy | epirubicin | CR | |||
| TMEM94 | insertion | Frame_Shift_Ins | novel | c.774_775insGTTG | p.Pro259ValfsTer5 | p.P259Vfs*5 | protein_coding | TCGA-A8-A08H-01 | Breast | breast invasive carcinoma | Female | >=65 | I/II | Unknown | Unknown | SD |
| Page: 1 2 3 4 5 6 7 8 9 10 11 12 13 14 15 16 |
Top |
Related drugs of malignant transformation related genes |
| Identification of chemicals and drugs interact with genes involved in malignant transfromation |
| (DGIdb 4.0) |
| Entrez ID | Symbol | Category | Interaction Types | Drug Claim Name | Drug Name | PMIDs |
| Page: 1 |

Copyright 2023-Present -The University of Texas Health Science Center at Houston |