Schematic overview of the cellular and molecular mechanisms involved in the cancer progression, including the proposed cellular and molecular mechanisms in cancer cells trajectory. AT1: alveolar type 1 cells; AT2: alveolar type 2 cells; AAH: atypical adenomatous hyperplasia; AIS: adenocarcinoma in situ; MIA: minimally invasive adenocarcinoma; IA: invasive adenocarcinoma; EMT: epithelial-mesenchymal transition

Home

Download

Statistics

Help

Contact

Center for Computational Systems Medicine
leaf

Gene summary

leaf

Malignant transformation analysis

leaf

Malignant transformation related pathway analysis

leaf

Cell-cell communication analysis

leaf

Single-cell gene regulatory network inference analysis

leaf

Somatic mutation of malignant transformation related genes

leaf

Related drugs of malignant transformation related genes

Gene: TMEM9

Gene summary for TMEM9

check button Gene summary.

Gene informationSpeciesHuman
Gene symbol

TMEM9

Gene ID

252839

Gene nametransmembrane protein 9
Gene AliasDERM4
Cytomap1q32.1
Gene Typeprotein-coding
GO ID

GO:0006807

UniProtAcc

A0A024R967


Top

Malignant transformation analysis

check button Identification of the aberrant gene expression in precancerous and cancerous lesions by comparing the gene expression of stem-like cells in diseased tissues with normal stem cells
check button Malignant transformation involving gene list.
Entrez IDSymbolReplicatesSpeciesOrganTissueAdj P-valueLog2FCMalignancy
252839TMEM9HTA11_3410_2000001011HumanColorectumAD6.69e-051.42e-010.0155
252839TMEM9HTA11_1938_2000001011HumanColorectumAD5.76e-083.29e-01-0.0811
252839TMEM9HTA11_347_2000001011HumanColorectumAD2.98e-051.65e-01-0.1954
252839TMEM9HTA11_3361_2000001011HumanColorectumAD2.12e-022.45e-01-0.1207
252839TMEM9HTA11_696_2000001011HumanColorectumAD1.97e-112.51e-01-0.1464
252839TMEM9HTA11_1391_2000001011HumanColorectumAD1.09e-113.88e-01-0.059
252839TMEM9HTA11_866_3004761011HumanColorectumAD4.91e-194.22e-010.096
252839TMEM9HTA11_4255_2000001011HumanColorectumSER1.98e-064.19e-010.0446
252839TMEM9HTA11_7663_2000001011HumanColorectumSER2.09e-053.12e-010.0131
252839TMEM9HTA11_10711_2000001011HumanColorectumAD1.76e-072.89e-010.0338
252839TMEM9HTA11_7696_3000711011HumanColorectumAD5.60e-092.43e-010.0674
252839TMEM9HTA11_6818_2000001011HumanColorectumAD6.78e-042.70e-010.0112
252839TMEM9HTA11_6818_2000001021HumanColorectumAD1.38e-114.67e-010.0588
252839TMEM9HTA11_99999970781_79442HumanColorectumMSS1.66e-184.02e-010.294
252839TMEM9HTA11_99999965062_69753HumanColorectumMSI-H1.15e-056.10e-010.3487
252839TMEM9HTA11_99999965104_69814HumanColorectumMSS6.85e-103.18e-010.281
252839TMEM9HTA11_99999971662_82457HumanColorectumMSS3.09e-276.41e-010.3859
252839TMEM9HTA11_99999974143_84620HumanColorectumMSS7.00e-132.93e-010.3005
252839TMEM9AEH-subject1HumanEndometriumAEH5.28e-15-3.73e-01-0.3059
252839TMEM9AEH-subject2HumanEndometriumAEH2.99e-16-3.90e-01-0.2525
Page: 1 2 3 4 5 6 7 8 9 

check button Transcriptomic changes along malignancy continuum.
TissueExpression DynamicsAbbreviation
Colorectum (GSE201348)The image shows the transcriptomic changes along malignancy continuum.log2FC in expression of this searched gene in stem-like cells from each diseased tissue sample relative to stem-like cells in normal samples in each tissue plotted against the malignancy continuum. Samples are colored based on if they are from different disease stage.FAP: Familial adenomatous polyposis
CRC: Colorectal cancer
Colorectum (HTA11)The image shows the transcriptomic changes along malignancy continuum.log2FC in expression of this searched gene in stem-like cells from each diseased tissue sample relative to stem-like cells in normal samples in each tissue plotted against the malignancy continuum. Samples are colored based on if they are from different disease stage.AD: Adenomas
SER: Sessile serrated lesions
MSI-H: Microsatellite-high colorectal cancer
MSS: Microsatellite stable colorectal cancer
EndometriumThe image shows the transcriptomic changes along malignancy continuum.log2FC in expression of this searched gene in stem-like cells from each diseased tissue sample relative to stem-like cells in normal samples in each tissue plotted against the malignancy continuum. Samples are colored based on if they are from different disease stage.AEH: Atypical endometrial hyperplasia
EEC: Endometrioid Cancer
EsophagusThe image shows the transcriptomic changes along malignancy continuum.log2FC in expression of this searched gene in stem-like cells from each diseased tissue sample relative to stem-like cells in normal samples in each tissue plotted against the malignancy continuum. Samples are colored based on if they are from different disease stage.ESCC: Esophageal squamous cell carcinoma
HGIN: High-grade intraepithelial neoplasias
LGIN: Low-grade intraepithelial neoplasias
LiverThe image shows the transcriptomic changes along malignancy continuum.log2FC in expression of this searched gene in stem-like cells from each diseased tissue sample relative to stem-like cells in normal samples in each tissue plotted against the malignancy continuum. Samples are colored based on if they are from different disease stage.
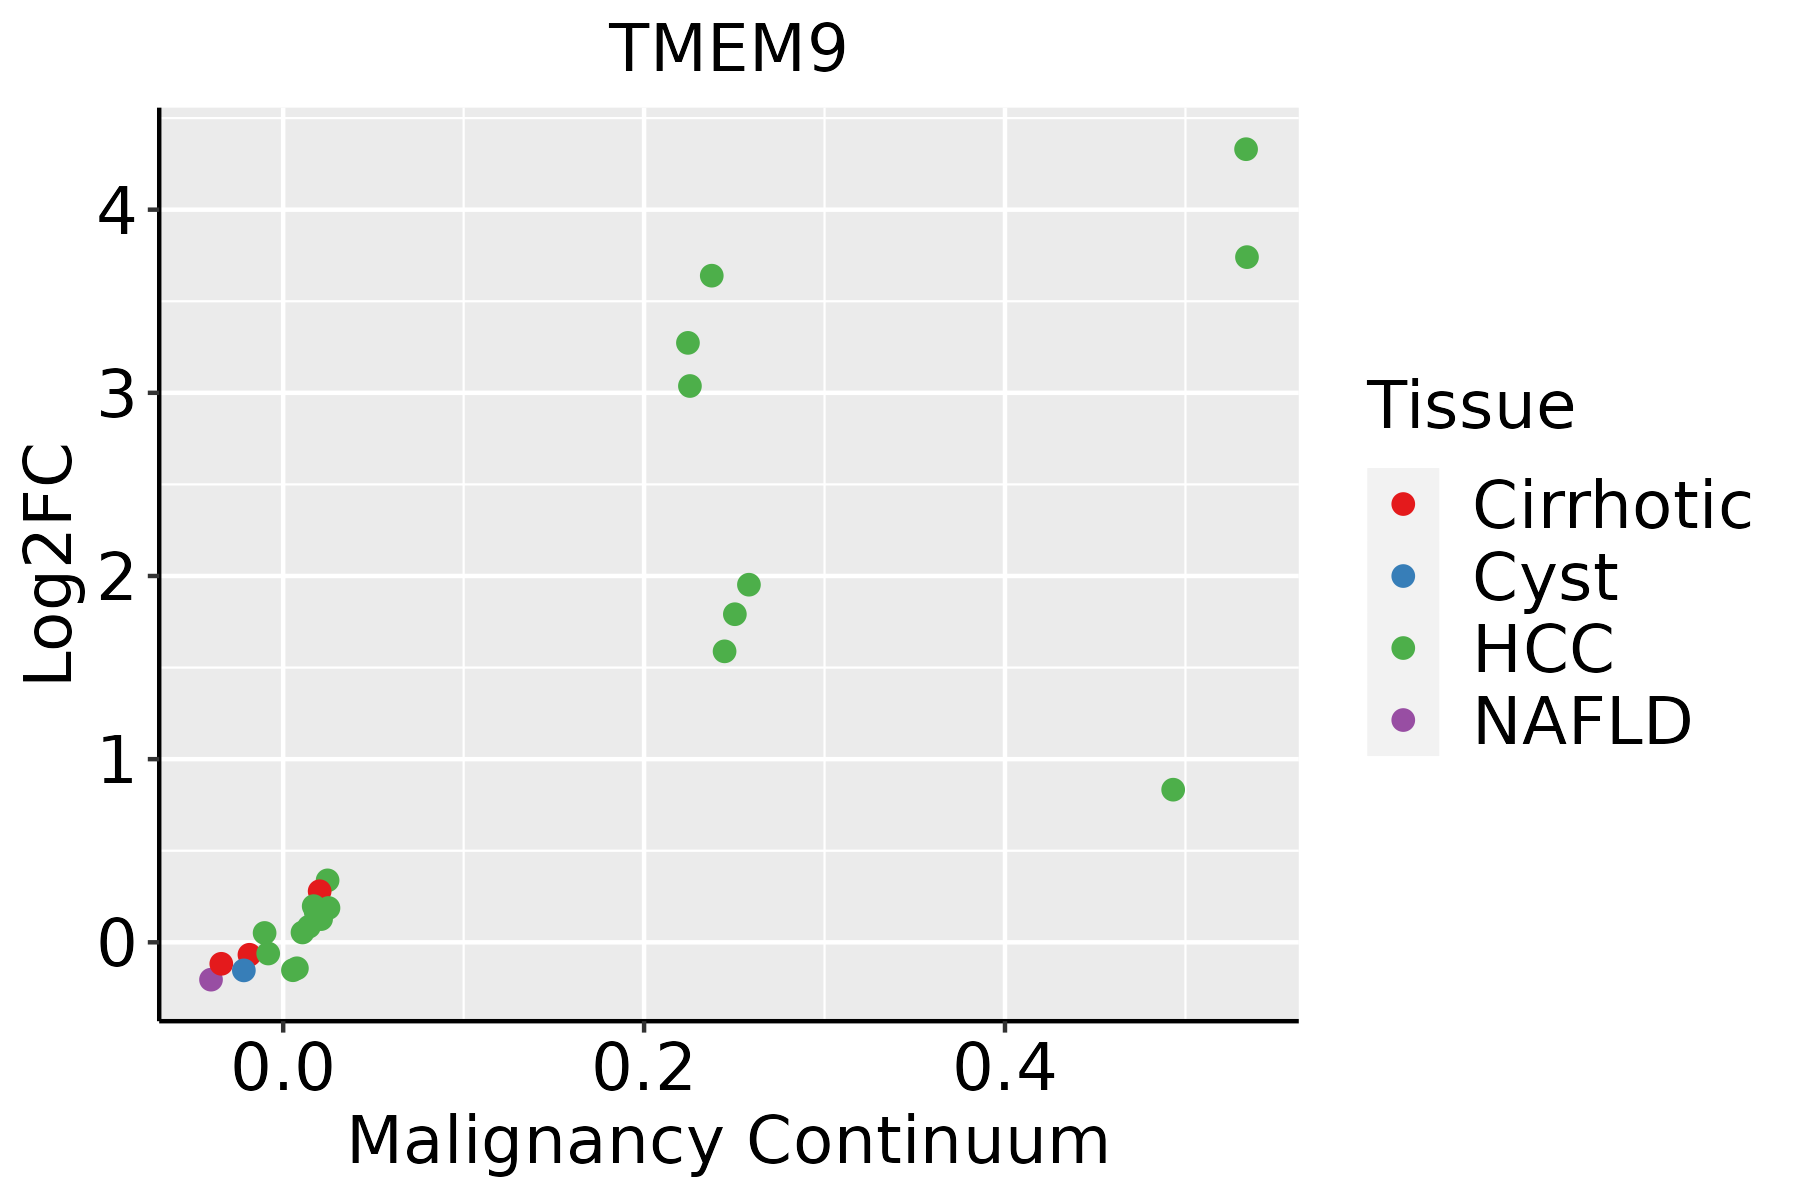
HCC: Hepatocellular carcinoma
NAFLD: Non-alcoholic fatty liver disease
Oral CavityThe image shows the transcriptomic changes along malignancy continuum.log2FC in expression of this searched gene in stem-like cells from each diseased tissue sample relative to stem-like cells in normal samples in each tissue plotted against the malignancy continuum. Samples are colored based on if they are from different disease stage.
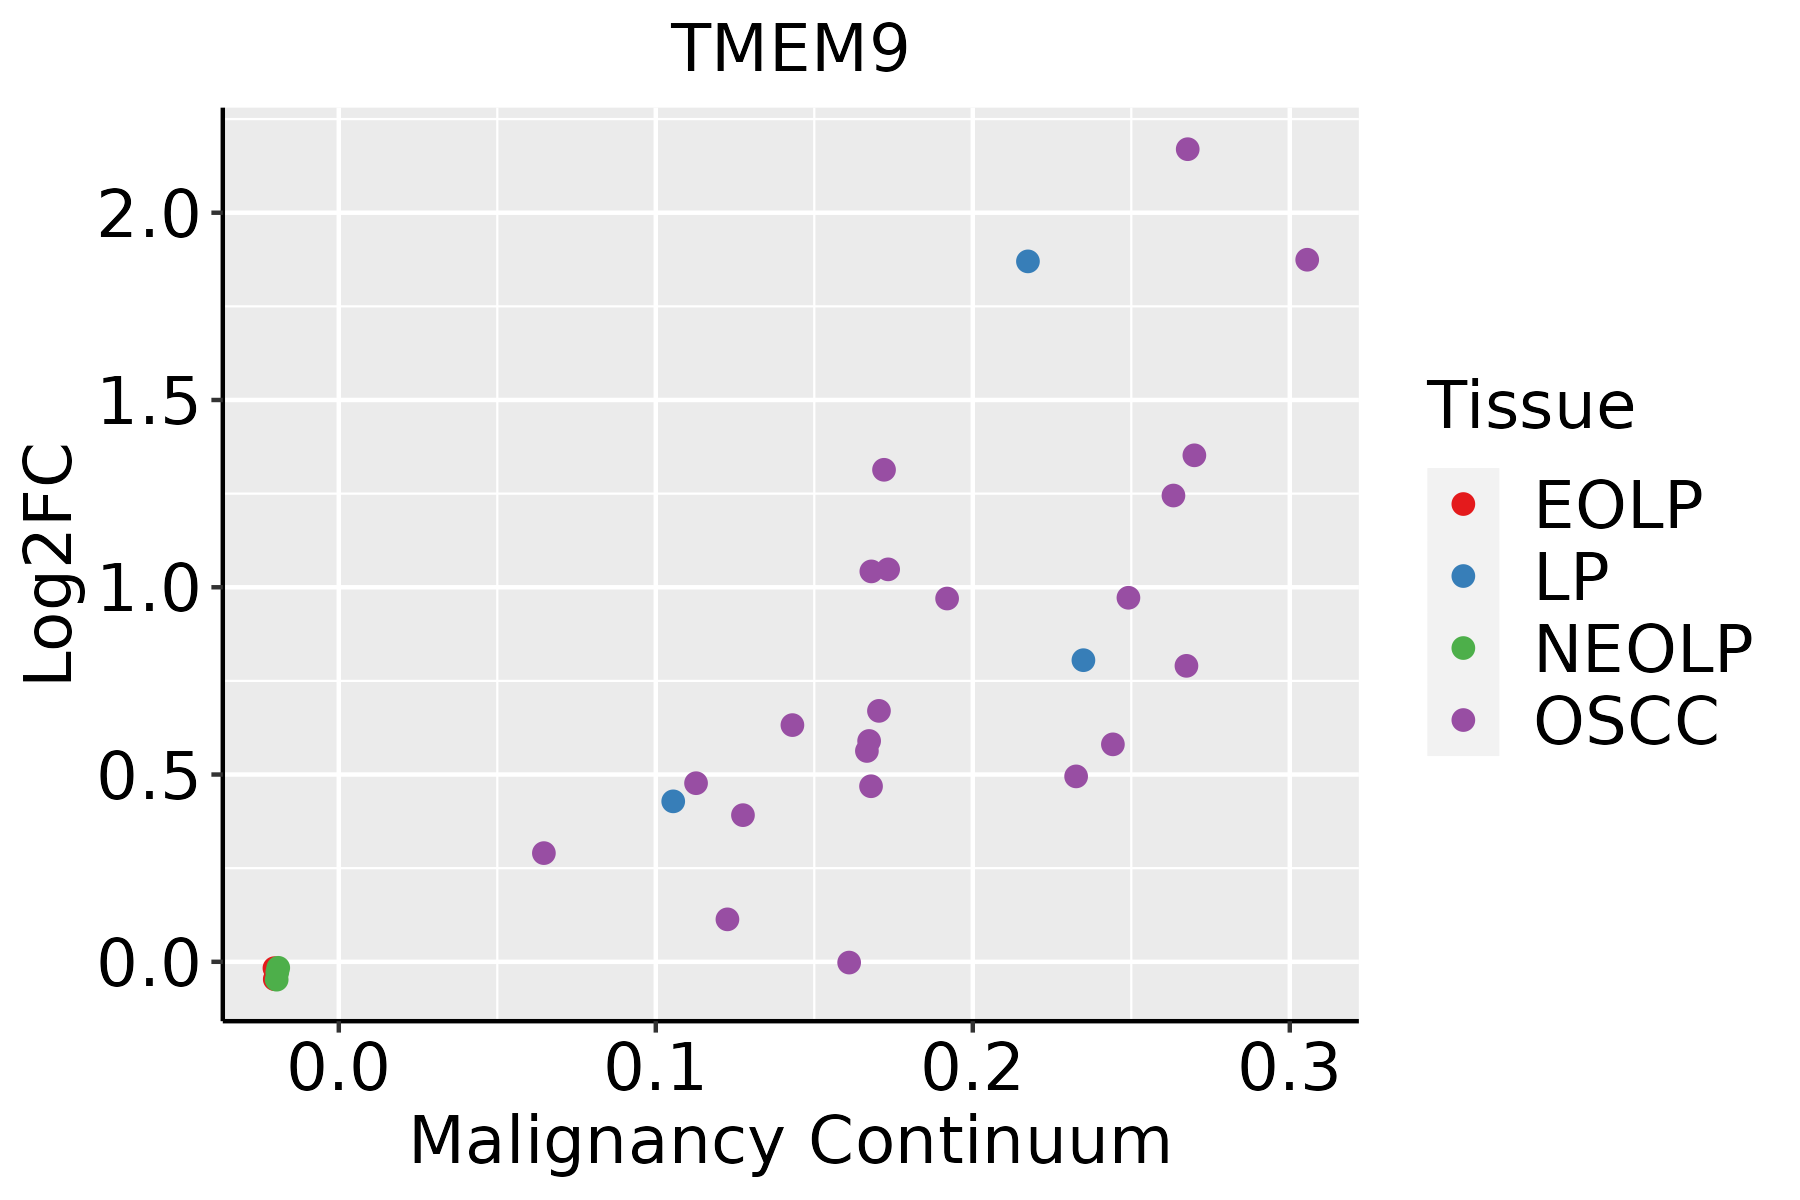
EOLP: Erosive Oral lichen planus
LP: leukoplakia
NEOLP: Non-erosive oral lichen planus
OSCC: Oral squamous cell carcinoma
ProstateThe image shows the transcriptomic changes along malignancy continuum.log2FC in expression of this searched gene in stem-like cells from each diseased tissue sample relative to stem-like cells in normal samples in each tissue plotted against the malignancy continuum. Samples are colored based on if they are from different disease stage.
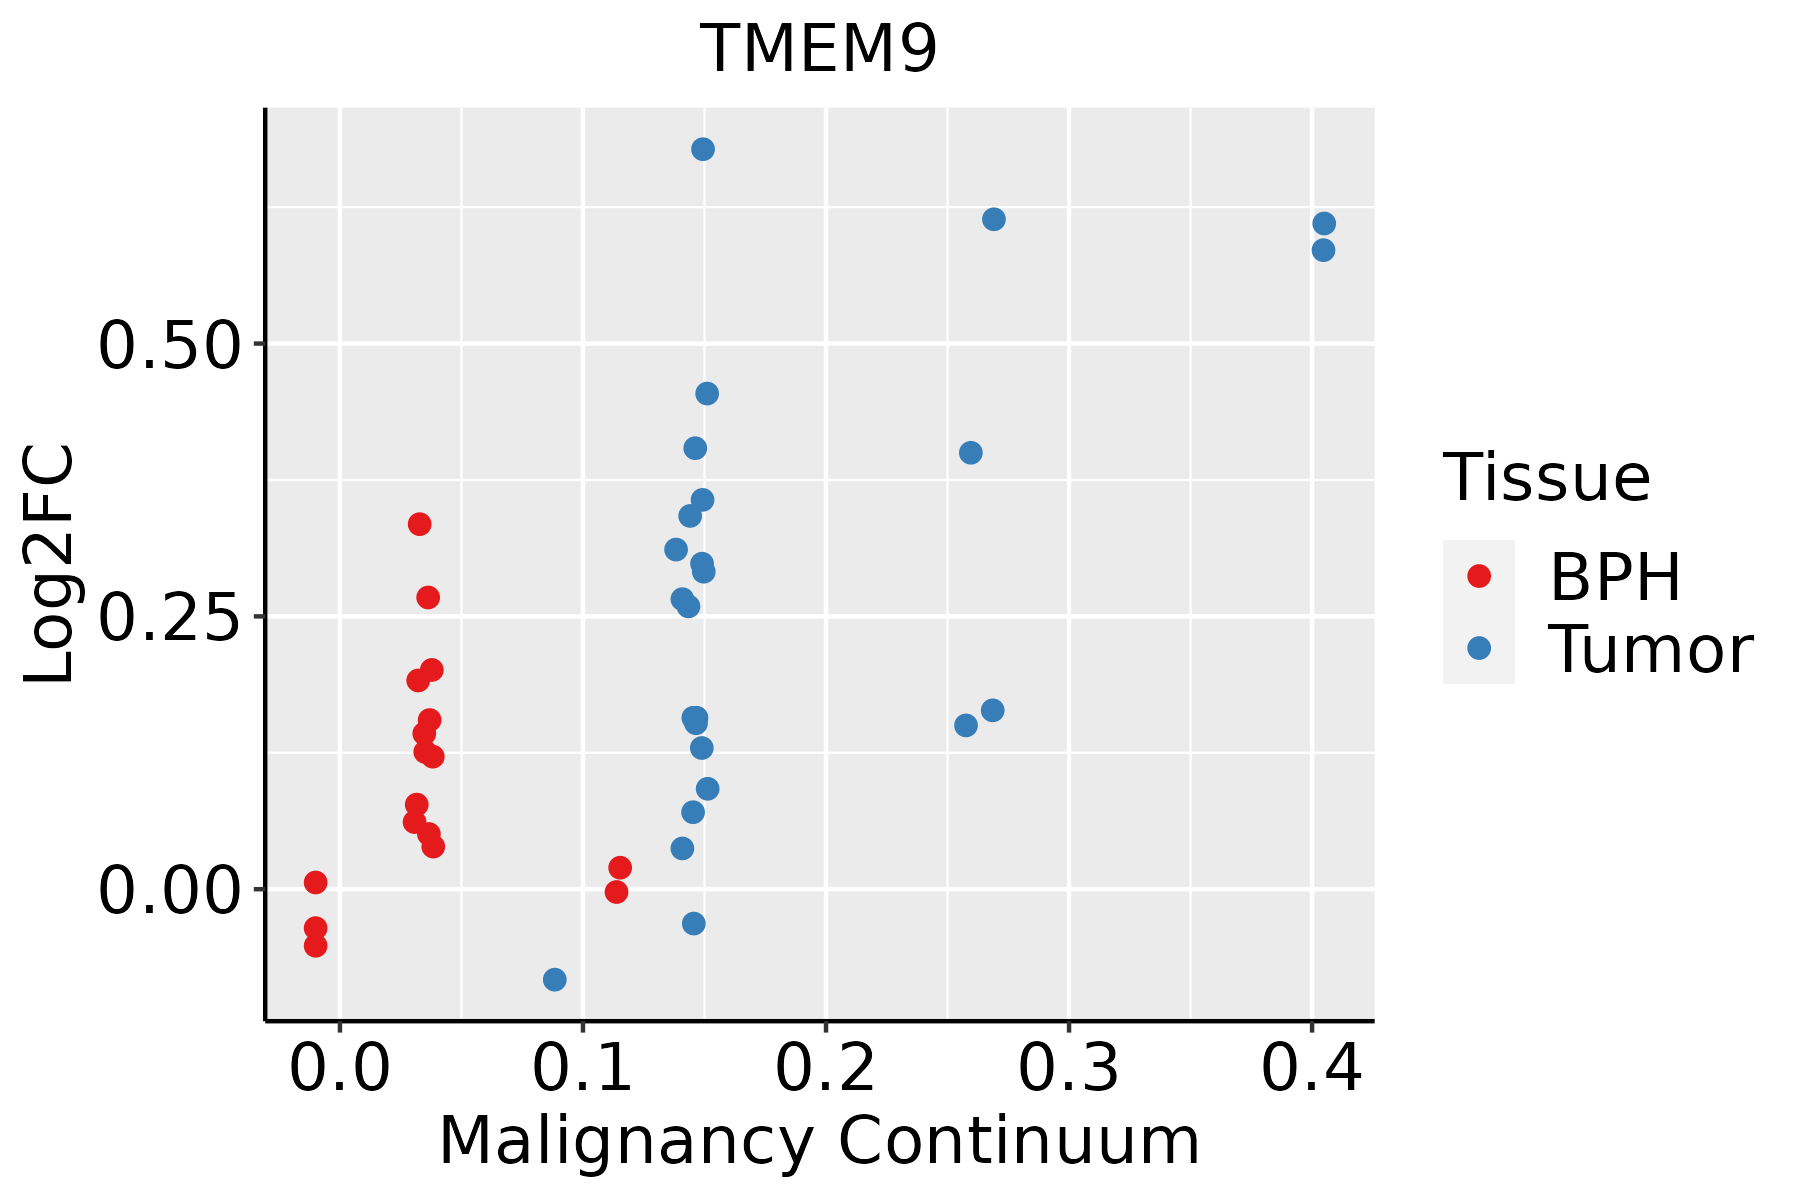
BPH: Benign Prostatic Hyperplasia
SkinThe image shows the transcriptomic changes along malignancy continuum.log2FC in expression of this searched gene in stem-like cells from each diseased tissue sample relative to stem-like cells in normal samples in each tissue plotted against the malignancy continuum. Samples are colored based on if they are from different disease stage.
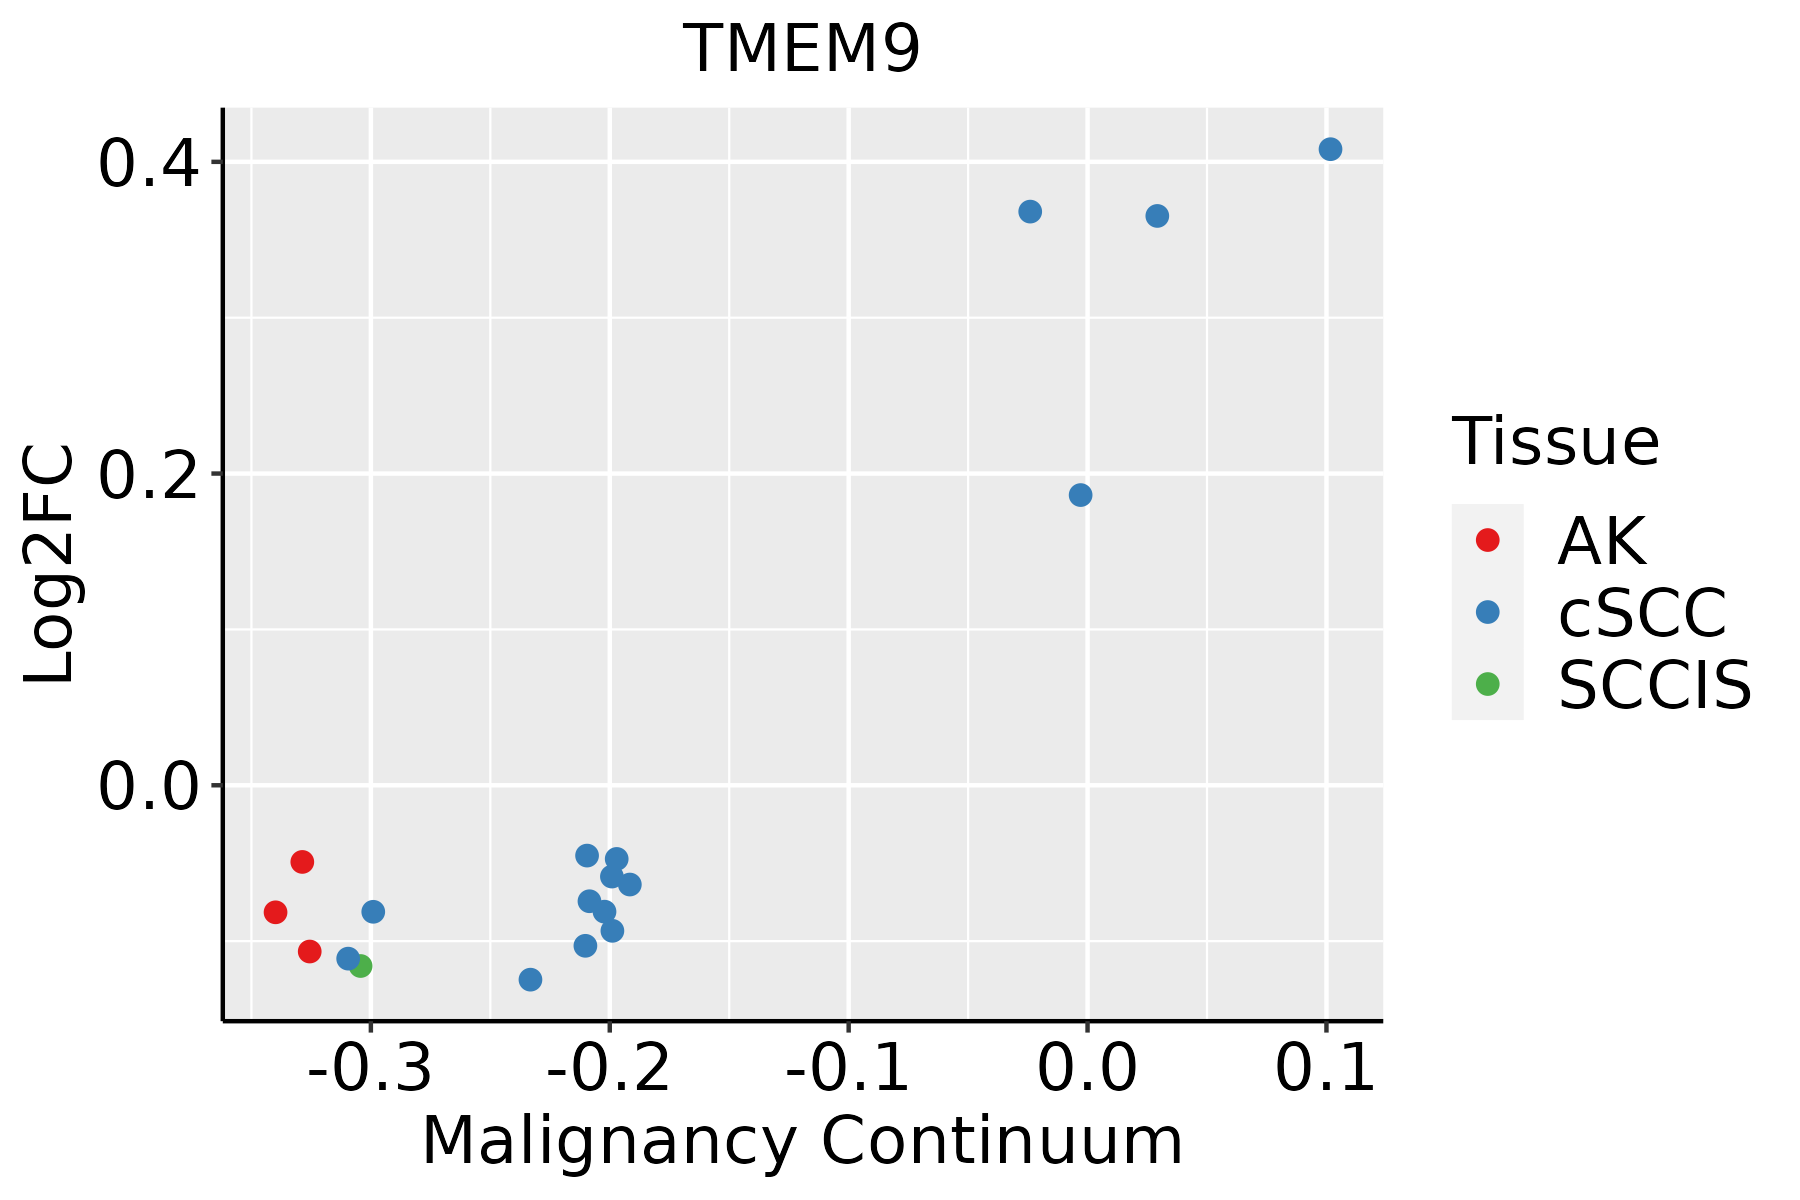
AK: Actinic keratosis
cSCC: Cutaneous squamous cell carcinoma
SCCIS:squamous cell carcinoma in situ
ThyroidThe image shows the transcriptomic changes along malignancy continuum.log2FC in expression of this searched gene in stem-like cells from each diseased tissue sample relative to stem-like cells in normal samples in each tissue plotted against the malignancy continuum. Samples are colored based on if they are from different disease stage.ATC: Anaplastic thyroid cancer
HT: Hashimoto's thyroiditis
PTC: Papillary thyroid cancer
∗log2FC in expression of this searched gene in stem-like cells from each diseased tissue sample relative to stem-like cells in normal samples in each tissue plotted against the malignancy continuum. Samples are colored based on if they are from different disease stage.

Top

Malignant transformation related pathway analysis

check buttonFind out the enriched GO biological processes and KEGG pathways involved in transition from healthy to precancer to cancer
check button Figure of enriched GO biological processes.
TissueDisease StageEnriched GO biological Processes
ColorectumADGO analysis - Figure of enriched GO biological processes: Top 15 enriched GO BP terms are showed in the bar plot of each disease state in each tissue. Each row represents a significant GO biological process which is colored according to the -log10(p.adjust).
ColorectumSERGO analysis - Figure of enriched GO biological processes: Top 15 enriched GO BP terms are showed in the bar plot of each disease state in each tissue. Each row represents a significant GO biological process which is colored according to the -log10(p.adjust).
ColorectumMSSGO analysis - Figure of enriched GO biological processes: Top 15 enriched GO BP terms are showed in the bar plot of each disease state in each tissue. Each row represents a significant GO biological process which is colored according to the -log10(p.adjust).
ColorectumMSI-HGO analysis - Figure of enriched GO biological processes: Top 15 enriched GO BP terms are showed in the bar plot of each disease state in each tissue. Each row represents a significant GO biological process which is colored according to the -log10(p.adjust).
ColorectumFAPGO analysis - Figure of enriched GO biological processes: Top 15 enriched GO BP terms are showed in the bar plot of each disease state in each tissue. Each row represents a significant GO biological process which is colored according to the -log10(p.adjust).
∗Top 15 enriched GO BP terms are showed in the bar plot of each disease state in each tissue. Each row represents a significant GO biological process which is colored according to the -log10(p.adjust).
Page: 1 2 3 4 5 6 7 8 9 

check button Enriched GO biological processes.
GO IDTissueDisease StageDescriptionGene RatioBg Ratiopvaluep.adjustCount
GO:00072496BreastPrecancerI-kappaB kinase/NF-kappaB signaling27/1080281/187236.58e-034.53e-0227
GO:00431227BreastIDCregulation of I-kappaB kinase/NF-kappaB signaling34/1434249/187237.18e-048.77e-0334
GO:000724914BreastIDCI-kappaB kinase/NF-kappaB signaling37/1434281/187238.58e-049.98e-0337
GO:00431236BreastIDCpositive regulation of I-kappaB kinase/NF-kappaB signaling26/1434186/187232.06e-031.95e-0226
GO:004312214BreastDCISregulation of I-kappaB kinase/NF-kappaB signaling32/1390249/187231.67e-031.66e-0232
GO:000724923BreastDCISI-kappaB kinase/NF-kappaB signaling35/1390281/187231.80e-031.74e-0235
GO:004312313BreastDCISpositive regulation of I-kappaB kinase/NF-kappaB signaling24/1390186/187235.66e-034.09e-0224
GO:0042176ColorectumADregulation of protein catabolic process160/3918391/187231.06e-197.34e-17160
GO:0016050ColorectumADvesicle organization101/3918300/187231.65e-077.17e-06101
GO:1900180ColorectumADregulation of protein localization to nucleus55/3918136/187231.70e-077.34e-0655
GO:0034504ColorectumADprotein localization to nucleus94/3918290/187232.83e-068.09e-0594
GO:0030111ColorectumADregulation of Wnt signaling pathway102/3918328/187238.51e-062.03e-04102
GO:0016055ColorectumADWnt signaling pathway130/3918444/187231.60e-053.37e-04130
GO:0198738ColorectumADcell-cell signaling by wnt130/3918446/187232.02e-054.10e-04130
GO:0045861ColorectumADnegative regulation of proteolysis106/3918351/187232.33e-054.57e-04106
GO:0007032ColorectumADendosome organization33/391882/187235.30e-059.01e-0433
GO:0060070ColorectumADcanonical Wnt signaling pathway90/3918303/187231.76e-042.38e-0390
GO:0043123ColorectumADpositive regulation of I-kappaB kinase/NF-kappaB signaling60/3918186/187231.91e-042.56e-0360
GO:0043122ColorectumADregulation of I-kappaB kinase/NF-kappaB signaling76/3918249/187232.17e-042.85e-0376
GO:0060828ColorectumADregulation of canonical Wnt signaling pathway77/3918253/187232.19e-042.87e-0377
Page: 1 2 3 4 5 6 7 8 9 10 11 12 13 14 15 16 17 18 19 20 21 22 23 24 

check button Enriched KEGG pathways.
Pathway IDTissueDisease StageDescriptionGene RatioBg Ratiopvaluep.adjustqvalueCount
Page: 1 

Top

Cell-cell communication analysis

check buttonIdentification of potential cell-cell interactions between two cell types and their ligand-receptor pairs for different disease states
LigandReceptorLRpairPathwayTissueDisease Stage
Page: 1 

Top

Single-cell gene regulatory network inference analysis

check buttonFind out the significant the regulons (TFs) and the target genes of each regulon across cell types for different disease states
TFCell TypeTissueDisease StageTarget GeneRSSRegulon Activity
∗The dot plots of a searched regulon are shown for all cell subpopulations in each disease state of each tissue based on the regulon specific score inferred using pySCENIC and by calculating the average expression.
Page: 1 

Top

Somatic mutation of malignant transformation related genes

check buttonAnnotation of somatic variants for genes involved in malignant transformation
Hugo SymbolVariant ClassVariant ClassificationdbSNP RSHGVScHGVSpHGVSp ShortSWISSPROTBIOTYPESIFTPolyPhenTumor Sample BarcodeTissueHistologySexAgeStageTherapy TypesDrugsOutcome
TMEM9SNVMissense_Mutationc.377C>Gp.Thr126Serp.T126Sprotein_codingtolerated(1)benign(0.427)TCGA-AN-A0FX-01Breastbreast invasive carcinomaFemale<65I/IIUnknownUnknownSD
TMEM9SNVMissense_Mutationrs776119463c.529A>Gp.Thr177Alap.T177Aprotein_codingdeleterious(0.04)probably_damaging(0.983)TCGA-CK-5914-01Colorectumcolon adenocarcinomaMale>=65III/IVUnknownUnknownSD
TMEM9SNVMissense_Mutationnovelc.458N>Ap.Ala153Glup.A153Eprotein_codingdeleterious(0.01)possibly_damaging(0.798)TCGA-G4-6320-01Colorectumcolon adenocarcinomaMale>=65III/IVChemotherapyoxaliplatinSD
TMEM9SNVMissense_Mutationnovelc.532G>Tp.Val178Phep.V178Fprotein_codingdeleterious(0)probably_damaging(0.997)TCGA-A5-A1OF-01Endometriumuterine corpus endometrioid carcinomaFemale<65I/IIUnknownUnknownSD
TMEM9SNVMissense_Mutationnovelc.181G>Ap.Val61Metp.V61Mprotein_codingdeleterious(0.04)possibly_damaging(0.554)TCGA-A5-A1OF-01Endometriumuterine corpus endometrioid carcinomaFemale<65I/IIUnknownUnknownSD
TMEM9SNVMissense_Mutationc.538G>Ap.Asp180Asnp.D180Nprotein_codingdeleterious(0)probably_damaging(0.994)TCGA-B5-A0JY-01Endometriumuterine corpus endometrioid carcinomaFemale<65III/IVChemotherapydoxorubicinSD
TMEM9SNVMissense_Mutationrs746735599c.452C>Tp.Pro151Leup.P151Lprotein_codingdeleterious(0.04)benign(0.017)TCGA-B5-A11H-01Endometriumuterine corpus endometrioid carcinomaFemale>=65III/IVHormone TherapymegaceSD
TMEM9SNVMissense_Mutationnovelc.238N>Ap.Glu80Lysp.E80Kprotein_codingtolerated(0.07)probably_damaging(0.993)TCGA-B5-A3FA-01Endometriumuterine corpus endometrioid carcinomaFemale>=65I/IIUnknownUnknownSD
TMEM9SNVMissense_Mutationnovelc.519G>Tp.Glu173Aspp.E173Dprotein_codingdeleterious(0)probably_damaging(0.983)TCGA-BG-A3EW-01Endometriumuterine corpus endometrioid carcinomaFemale<65III/IVUnknownUnknownSD
TMEM9SNVMissense_Mutationc.5N>Tp.Lys2Metp.K2Mprotein_codingdeleterious_low_confidence(0)probably_damaging(0.984)TCGA-D1-A15X-01Endometriumuterine corpus endometrioid carcinomaFemale<65I/IIUnknownUnknownSD
Page: 1 2 

Top

Related drugs of malignant transformation related genes

check buttonIdentification of chemicals and drugs interact with genes involved in malignant transfromation
(DGIdb 4.0)
Entrez IDSymbolCategoryInteraction TypesDrug Claim NameDrug NamePMIDs
Page: 1