
|
|||||
|
 | |
| |
| |
| |
| |
| |
|
Gene: TMEM8A |
Gene summary for TMEM8A |
| Gene information | Species | Human | Gene symbol | TMEM8A | Gene ID | 58986 |
| Gene name | post-glycosylphosphatidylinositol attachment to proteins 6 | |
| Gene Alias | GPI-PLA2 | |
| Cytomap | 16p13.3 | |
| Gene Type | protein-coding | GO ID | GO:0008150 | UniProtAcc | Q9HCN3 |
Top |
Malignant transformation analysis |
| Identification of the aberrant gene expression in precancerous and cancerous lesions by comparing the gene expression of stem-like cells in diseased tissues with normal stem cells |
| Entrez ID | Symbol | Replicates | Species | Organ | Tissue | Adj P-value | Log2FC | Malignancy |
| 58986 | TMEM8A | HCC1_Meng | Human | Liver | HCC | 2.83e-47 | 1.06e-01 | 0.0246 |
| 58986 | TMEM8A | HCC2_Meng | Human | Liver | HCC | 5.83e-25 | 1.95e-01 | 0.0107 |
| 58986 | TMEM8A | HCC2 | Human | Liver | HCC | 4.43e-18 | 3.43e+00 | 0.5341 |
| 58986 | TMEM8A | S014 | Human | Liver | HCC | 1.59e-22 | 6.77e-01 | 0.2254 |
| 58986 | TMEM8A | S015 | Human | Liver | HCC | 1.34e-18 | 7.80e-01 | 0.2375 |
| 58986 | TMEM8A | S016 | Human | Liver | HCC | 3.72e-17 | 6.14e-01 | 0.2243 |
| 58986 | TMEM8A | S027 | Human | Liver | HCC | 4.97e-07 | 5.25e-01 | 0.2446 |
| 58986 | TMEM8A | S028 | Human | Liver | HCC | 6.39e-28 | 9.16e-01 | 0.2503 |
| 58986 | TMEM8A | S029 | Human | Liver | HCC | 1.28e-23 | 8.24e-01 | 0.2581 |
| 58986 | TMEM8A | male-WTA | Human | Thyroid | PTC | 6.49e-23 | 2.41e-01 | 0.1037 |
| 58986 | TMEM8A | PTC01 | Human | Thyroid | PTC | 1.05e-07 | 7.44e-02 | 0.1899 |
| 58986 | TMEM8A | PTC04 | Human | Thyroid | PTC | 1.65e-14 | 2.58e-01 | 0.1927 |
| 58986 | TMEM8A | PTC05 | Human | Thyroid | PTC | 8.81e-15 | 4.22e-01 | 0.2065 |
| 58986 | TMEM8A | PTC06 | Human | Thyroid | PTC | 4.64e-20 | 5.53e-01 | 0.2057 |
| 58986 | TMEM8A | PTC07 | Human | Thyroid | PTC | 1.46e-23 | 3.64e-01 | 0.2044 |
| 58986 | TMEM8A | ATC09 | Human | Thyroid | ATC | 1.93e-05 | 2.65e-01 | 0.2871 |
| 58986 | TMEM8A | ATC11 | Human | Thyroid | ATC | 2.22e-04 | 3.74e-01 | 0.3386 |
| 58986 | TMEM8A | ATC12 | Human | Thyroid | ATC | 2.46e-19 | 4.21e-01 | 0.34 |
| 58986 | TMEM8A | ATC13 | Human | Thyroid | ATC | 3.75e-18 | 2.68e-01 | 0.34 |
| 58986 | TMEM8A | ATC1 | Human | Thyroid | ATC | 5.47e-06 | 2.82e-01 | 0.2878 |
| Page: 1 2 |
| Tissue | Expression Dynamics | Abbreviation |
| Liver | 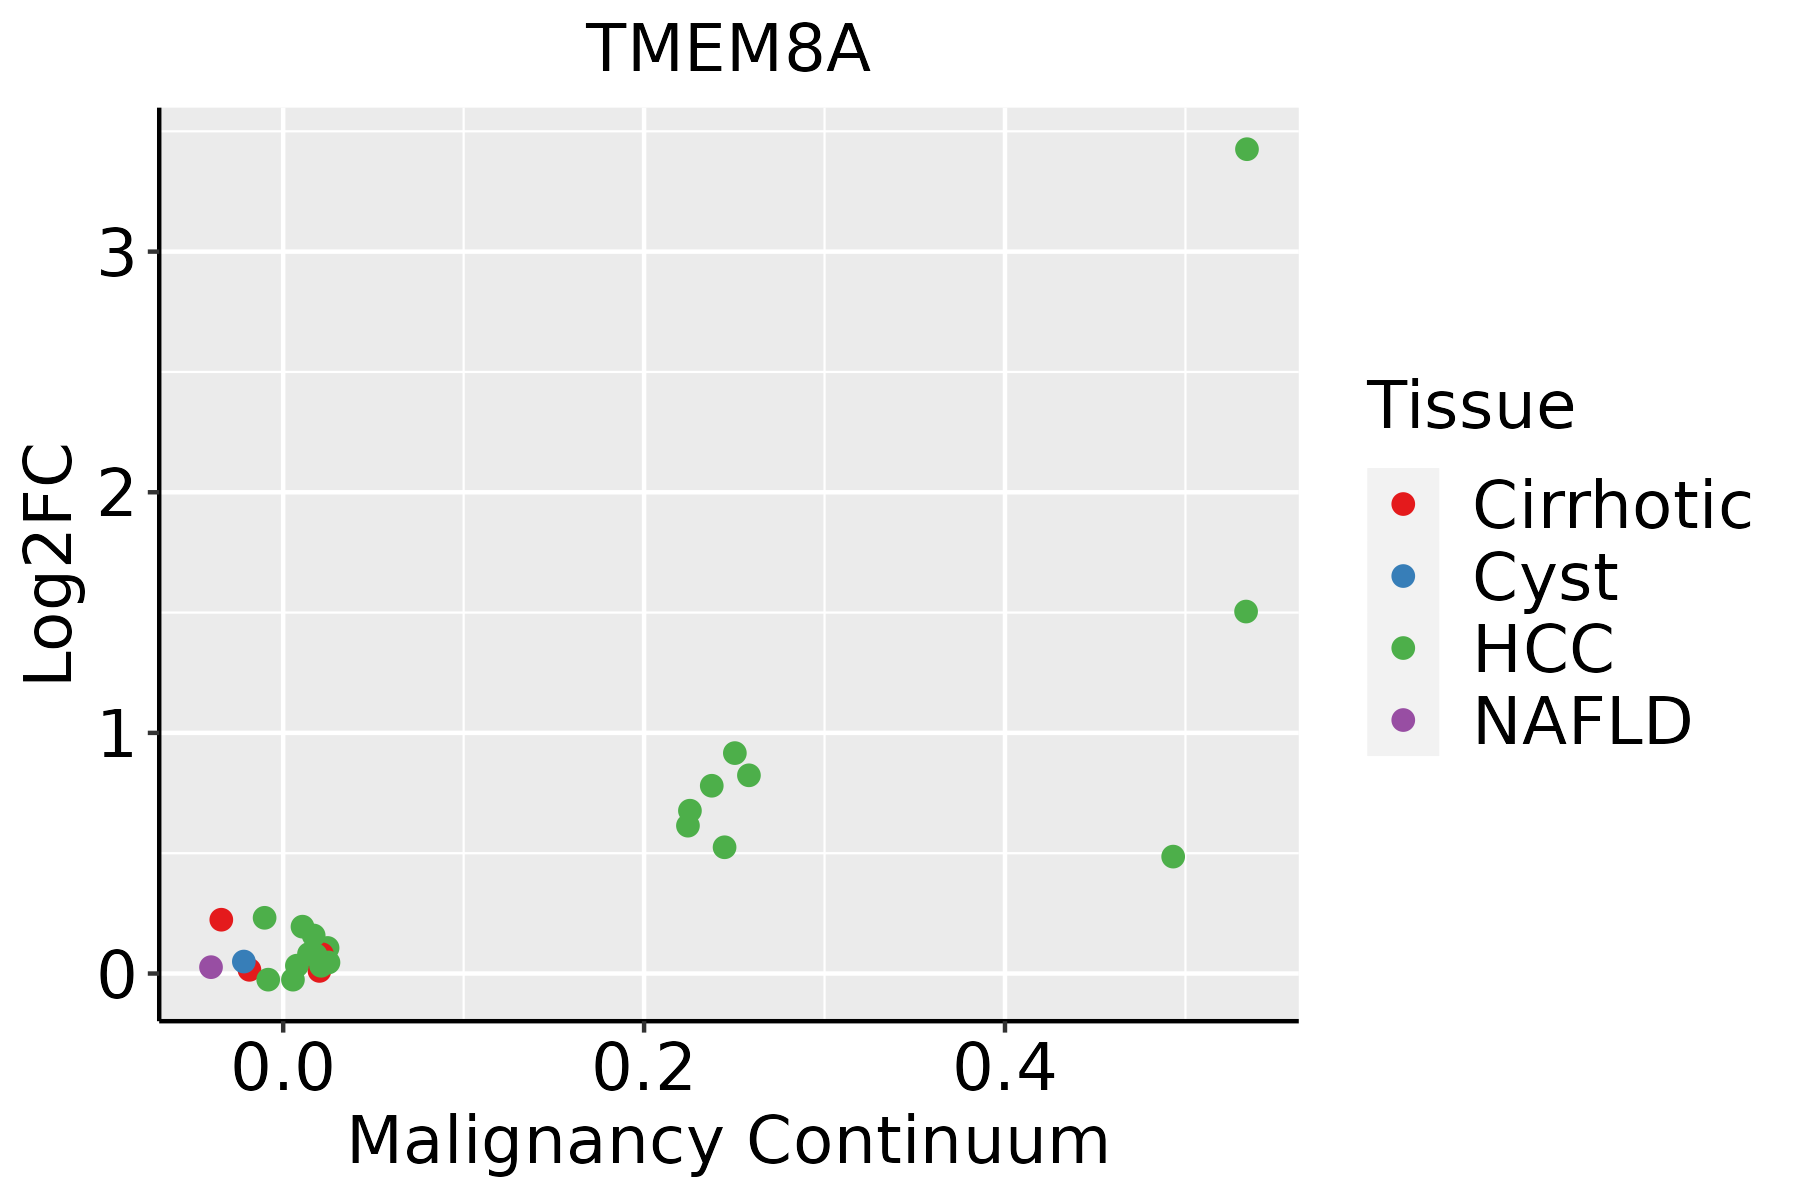 | HCC: Hepatocellular carcinoma |
| NAFLD: Non-alcoholic fatty liver disease | ||
| Thyroid | 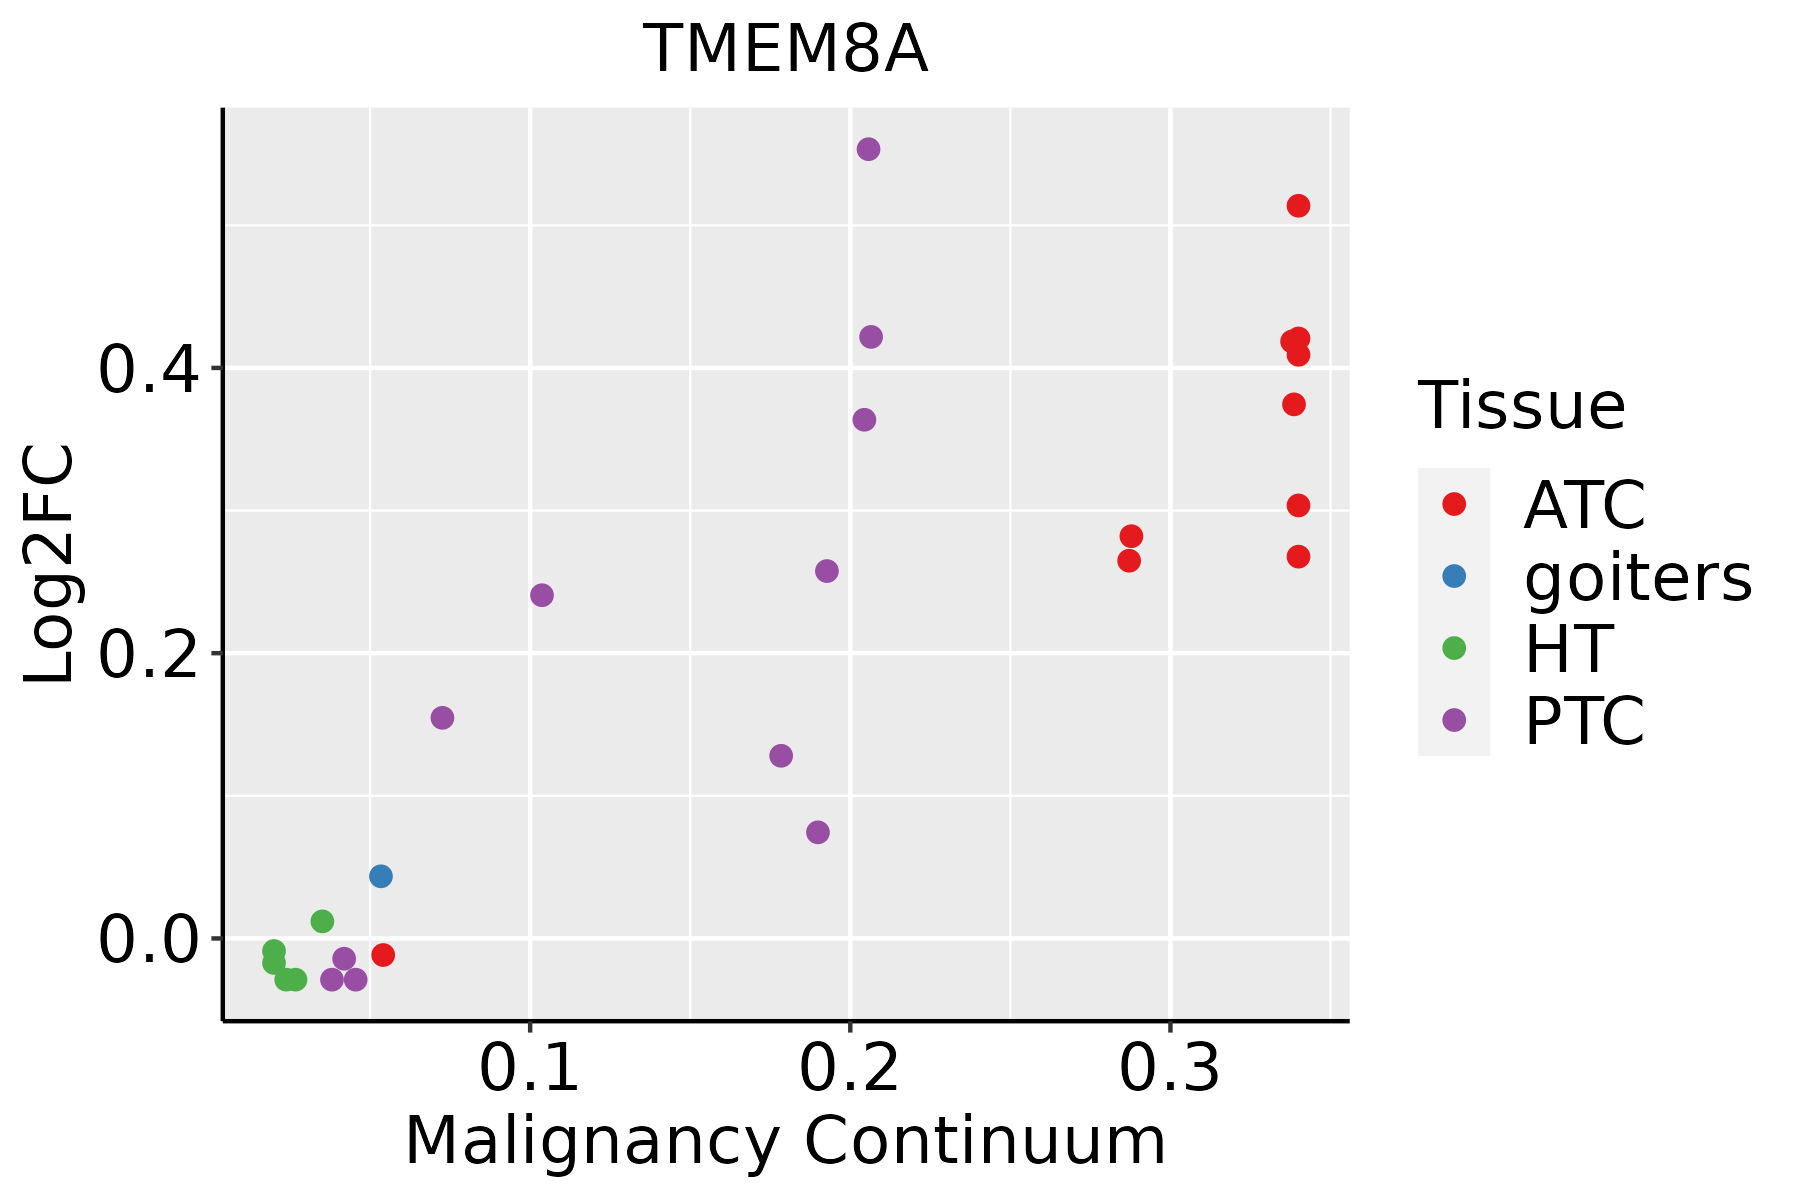 | ATC: Anaplastic thyroid cancer |
| HT: Hashimoto's thyroiditis | ||
| PTC: Papillary thyroid cancer |
| ∗log2FC in expression of this searched gene in stem-like cells from each diseased tissue sample relative to stem-like cells in normal samples in each tissue plotted against the malignancy continuum. Samples are colored based on if they are from different disease stage. |
Top |
Malignant transformation related pathway analysis |
| Find out the enriched GO biological processes and KEGG pathways involved in transition from healthy to precancer to cancer |
| Tissue | Disease Stage | Enriched GO biological Processes |
| Colorectum | AD |  |
| Colorectum | SER |  |
| Colorectum | MSS |  |
| Colorectum | MSI-H |  |
| Colorectum | FAP |  |
| ∗Top 15 enriched GO BP terms are showed in the bar plot of each disease state in each tissue. Each row represents a significant GO biological process which is colored according to the -log10(p.adjust). |
| Page: 1 2 3 4 5 6 7 8 9 |
| GO ID | Tissue | Disease Stage | Description | Gene Ratio | Bg Ratio | pvalue | p.adjust | Count |
| Page: 1 |
| Pathway ID | Tissue | Disease Stage | Description | Gene Ratio | Bg Ratio | pvalue | p.adjust | qvalue | Count |
| Page: 1 |
Top |
Cell-cell communication analysis |
| Identification of potential cell-cell interactions between two cell types and their ligand-receptor pairs for different disease states |
| Ligand | Receptor | LRpair | Pathway | Tissue | Disease Stage |
| Page: 1 |
Top |
Single-cell gene regulatory network inference analysis |
| Find out the significant the regulons (TFs) and the target genes of each regulon across cell types for different disease states |
| TF | Cell Type | Tissue | Disease Stage | Target Gene | RSS | Regulon Activity |
| ∗The dot plots of a searched regulon are shown for all cell subpopulations in each disease state of each tissue based on the regulon specific score inferred using pySCENIC and by calculating the average expression. |
| Page: 1 |
Top |
Somatic mutation of malignant transformation related genes |
| Annotation of somatic variants for genes involved in malignant transformation |
| Hugo Symbol | Variant Class | Variant Classification | dbSNP RS | HGVSc | HGVSp | HGVSp Short | SWISSPROT | BIOTYPE | SIFT | PolyPhen | Tumor Sample Barcode | Tissue | Histology | Sex | Age | Stage | Therapy Types | Drugs | Outcome |
| TMEM8A | SNV | Missense_Mutation | rs747839281 | c.659N>A | p.Arg220Gln | p.R220Q | Q9HCN3 | protein_coding | tolerated(0.91) | benign(0) | TCGA-BH-A203-01 | Breast | breast invasive carcinoma | Female | >=65 | I/II | Unknown | Unknown | PD |
| TMEM8A | SNV | Missense_Mutation | novel | c.1320C>G | p.Phe440Leu | p.F440L | Q9HCN3 | protein_coding | tolerated(0.18) | benign(0.119) | TCGA-LD-A74U-01 | Breast | breast invasive carcinoma | Female | >=65 | III/IV | Chemotherapy | taxotere | SD |
| TMEM8A | SNV | Missense_Mutation | rs771178017 | c.1751C>T | p.Ser584Phe | p.S584F | Q9HCN3 | protein_coding | deleterious(0) | probably_damaging(1) | TCGA-EK-A3GK-01 | Cervix | cervical & endocervical cancer | Female | <65 | I/II | Unknown | Unknown | SD |
| TMEM8A | SNV | Missense_Mutation | c.2073N>T | p.Trp691Cys | p.W691C | Q9HCN3 | protein_coding | deleterious(0) | probably_damaging(1) | TCGA-IR-A3L7-01 | Cervix | cervical & endocervical cancer | Female | <65 | I/II | Chemotherapy | cisplatin | CR | |
| TMEM8A | SNV | Missense_Mutation | rs764747772 | c.238C>T | p.Arg80Cys | p.R80C | Q9HCN3 | protein_coding | deleterious(0) | probably_damaging(0.941) | TCGA-VS-A8QM-01 | Cervix | cervical & endocervical cancer | Female | <65 | I/II | Chemotherapy | cisplatin | PD |
| TMEM8A | SNV | Missense_Mutation | rs757760544 | c.2119N>A | p.Ala707Thr | p.A707T | Q9HCN3 | protein_coding | tolerated(0.4) | benign(0.061) | TCGA-A6-2686-01 | Colorectum | colon adenocarcinoma | Female | >=65 | I/II | Unknown | Unknown | SD |
| TMEM8A | SNV | Missense_Mutation | rs757017387 | c.211C>T | p.Arg71Cys | p.R71C | Q9HCN3 | protein_coding | deleterious(0) | possibly_damaging(0.828) | TCGA-AA-3947-01 | Colorectum | colon adenocarcinoma | Female | <65 | I/II | Unknown | Unknown | SD |
| TMEM8A | SNV | Missense_Mutation | c.1579T>A | p.Trp527Arg | p.W527R | Q9HCN3 | protein_coding | deleterious(0) | probably_damaging(0.999) | TCGA-CK-4951-01 | Colorectum | colon adenocarcinoma | Female | >=65 | I/II | Unknown | Unknown | PD | |
| TMEM8A | SNV | Missense_Mutation | c.1876N>A | p.Ala626Thr | p.A626T | Q9HCN3 | protein_coding | deleterious(0) | probably_damaging(0.979) | TCGA-CK-5916-01 | Colorectum | colon adenocarcinoma | Female | >=65 | I/II | Unknown | Unknown | PD | |
| TMEM8A | SNV | Missense_Mutation | rs745477438 | c.1213N>T | p.Arg405Trp | p.R405W | Q9HCN3 | protein_coding | tolerated(0.12) | benign(0) | TCGA-CK-5916-01 | Colorectum | colon adenocarcinoma | Female | >=65 | I/II | Unknown | Unknown | PD |
| Page: 1 2 3 4 5 6 7 |
Top |
Related drugs of malignant transformation related genes |
| Identification of chemicals and drugs interact with genes involved in malignant transfromation |
| (DGIdb 4.0) |
| Entrez ID | Symbol | Category | Interaction Types | Drug Claim Name | Drug Name | PMIDs |
| Page: 1 |

Copyright 2023-Present -The University of Texas Health Science Center at Houston |