
|
|||||
|
 | |
| |
| |
| |
| |
| |
|
Gene: TMEM79 |
Gene summary for TMEM79 |
| Gene information | Species | Human | Gene symbol | TMEM79 | Gene ID | 84283 |
| Gene name | transmembrane protein 79 | |
| Gene Alias | MATT | |
| Cytomap | 1q22 | |
| Gene Type | protein-coding | GO ID | GO:0001942 | UniProtAcc | Q9BSE2 |
Top |
Malignant transformation analysis |
| Identification of the aberrant gene expression in precancerous and cancerous lesions by comparing the gene expression of stem-like cells in diseased tissues with normal stem cells |
| Entrez ID | Symbol | Replicates | Species | Organ | Tissue | Adj P-value | Log2FC | Malignancy |
| 84283 | TMEM79 | LZE24T | Human | Esophagus | ESCC | 1.05e-02 | 8.53e-02 | 0.0596 |
| 84283 | TMEM79 | P2T-E | Human | Esophagus | ESCC | 1.87e-06 | 7.37e-02 | 0.1177 |
| 84283 | TMEM79 | P4T-E | Human | Esophagus | ESCC | 7.97e-12 | 2.64e-01 | 0.1323 |
| 84283 | TMEM79 | P5T-E | Human | Esophagus | ESCC | 1.36e-18 | 1.30e-01 | 0.1327 |
| 84283 | TMEM79 | P8T-E | Human | Esophagus | ESCC | 9.95e-15 | 1.90e-01 | 0.0889 |
| 84283 | TMEM79 | P9T-E | Human | Esophagus | ESCC | 3.84e-03 | 2.97e-02 | 0.1131 |
| 84283 | TMEM79 | P10T-E | Human | Esophagus | ESCC | 1.21e-07 | 1.82e-01 | 0.116 |
| 84283 | TMEM79 | P12T-E | Human | Esophagus | ESCC | 1.81e-07 | 1.81e-01 | 0.1122 |
| 84283 | TMEM79 | P15T-E | Human | Esophagus | ESCC | 2.68e-10 | 2.20e-01 | 0.1149 |
| 84283 | TMEM79 | P16T-E | Human | Esophagus | ESCC | 1.11e-08 | 7.47e-02 | 0.1153 |
| 84283 | TMEM79 | P17T-E | Human | Esophagus | ESCC | 4.74e-04 | 2.20e-01 | 0.1278 |
| 84283 | TMEM79 | P20T-E | Human | Esophagus | ESCC | 1.40e-14 | 2.32e-01 | 0.1124 |
| 84283 | TMEM79 | P21T-E | Human | Esophagus | ESCC | 1.73e-15 | 2.85e-01 | 0.1617 |
| 84283 | TMEM79 | P22T-E | Human | Esophagus | ESCC | 5.10e-18 | 1.77e-01 | 0.1236 |
| 84283 | TMEM79 | P23T-E | Human | Esophagus | ESCC | 2.72e-07 | 1.28e-01 | 0.108 |
| 84283 | TMEM79 | P24T-E | Human | Esophagus | ESCC | 8.42e-09 | 3.11e-01 | 0.1287 |
| 84283 | TMEM79 | P26T-E | Human | Esophagus | ESCC | 2.65e-14 | 3.09e-01 | 0.1276 |
| 84283 | TMEM79 | P27T-E | Human | Esophagus | ESCC | 2.54e-14 | 3.38e-01 | 0.1055 |
| 84283 | TMEM79 | P28T-E | Human | Esophagus | ESCC | 1.32e-11 | 3.40e-01 | 0.1149 |
| 84283 | TMEM79 | P30T-E | Human | Esophagus | ESCC | 4.55e-02 | 2.04e-01 | 0.137 |
| Page: 1 2 3 4 |
| Tissue | Expression Dynamics | Abbreviation |
| Esophagus | 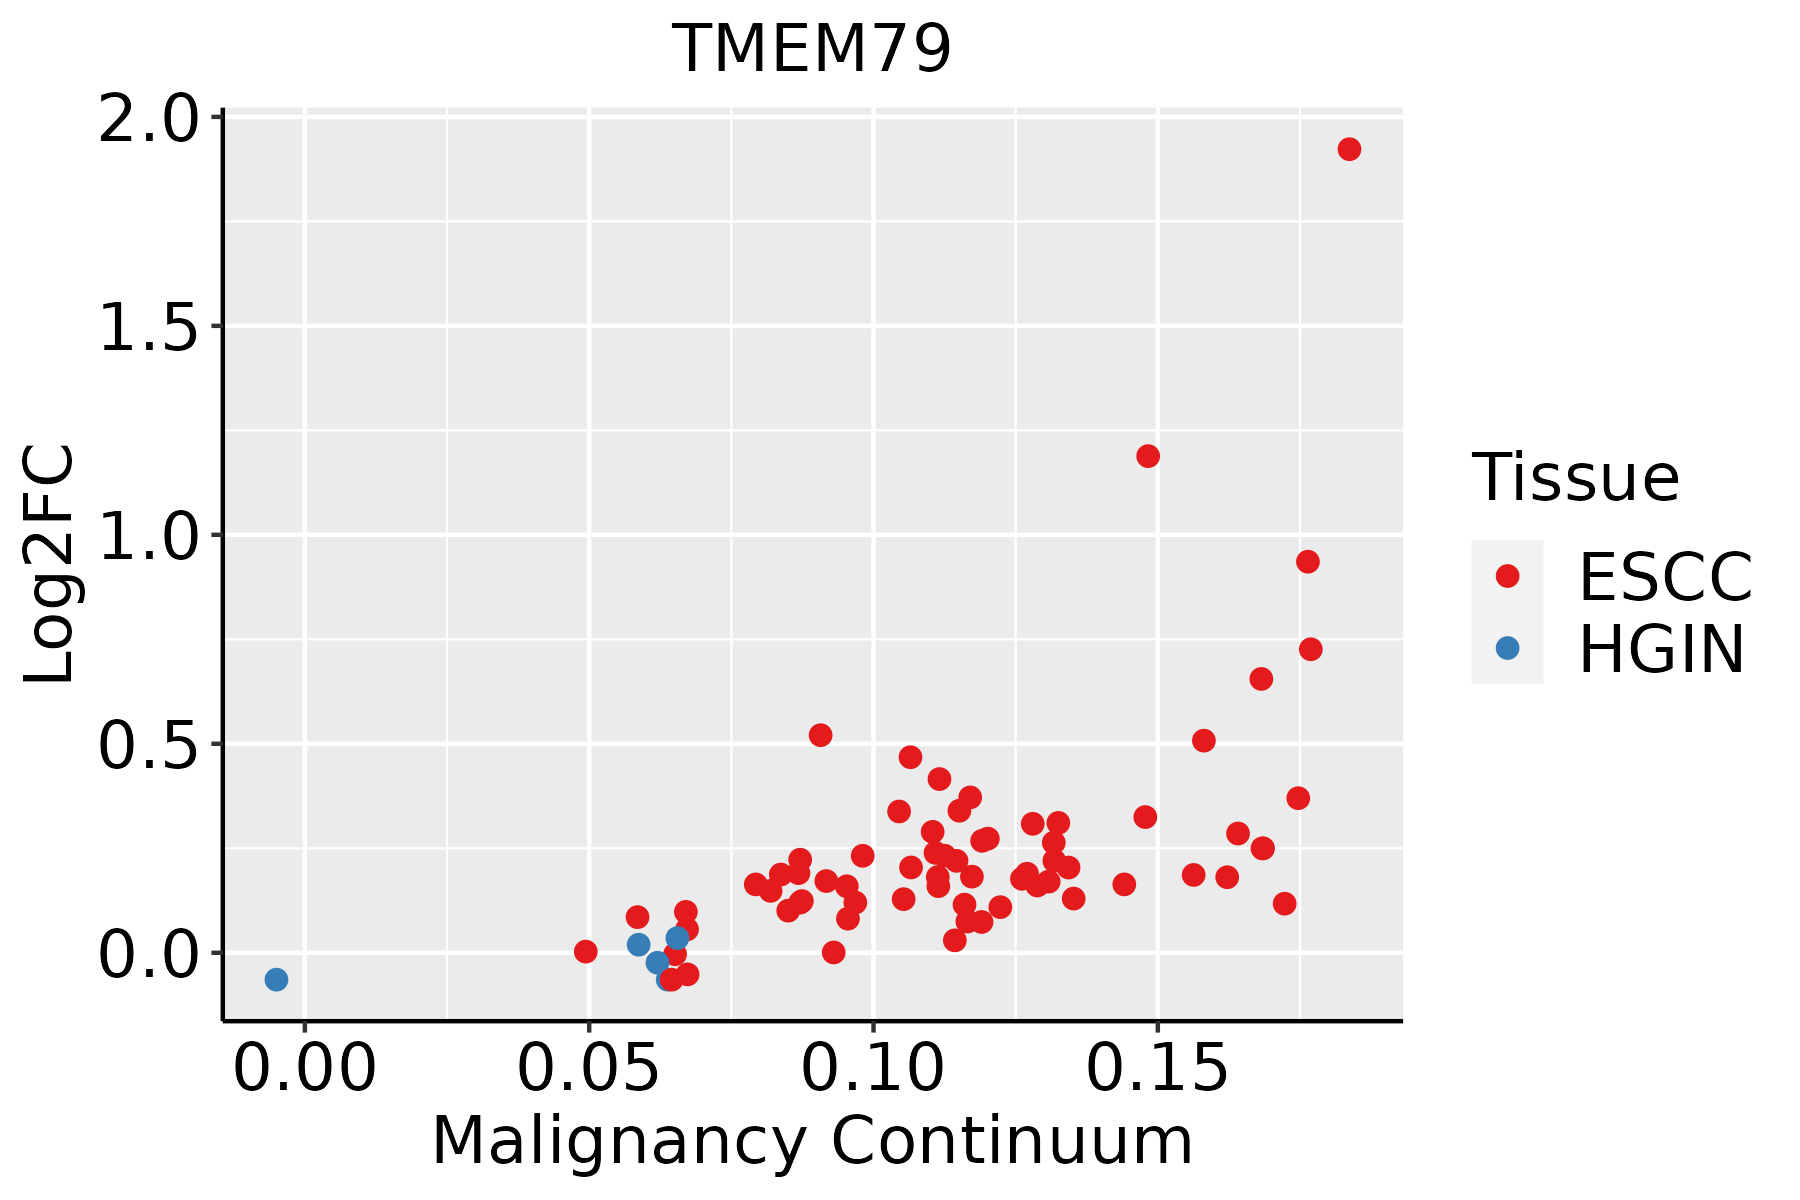 | ESCC: Esophageal squamous cell carcinoma |
| HGIN: High-grade intraepithelial neoplasias | ||
| LGIN: Low-grade intraepithelial neoplasias | ||
| Oral Cavity | 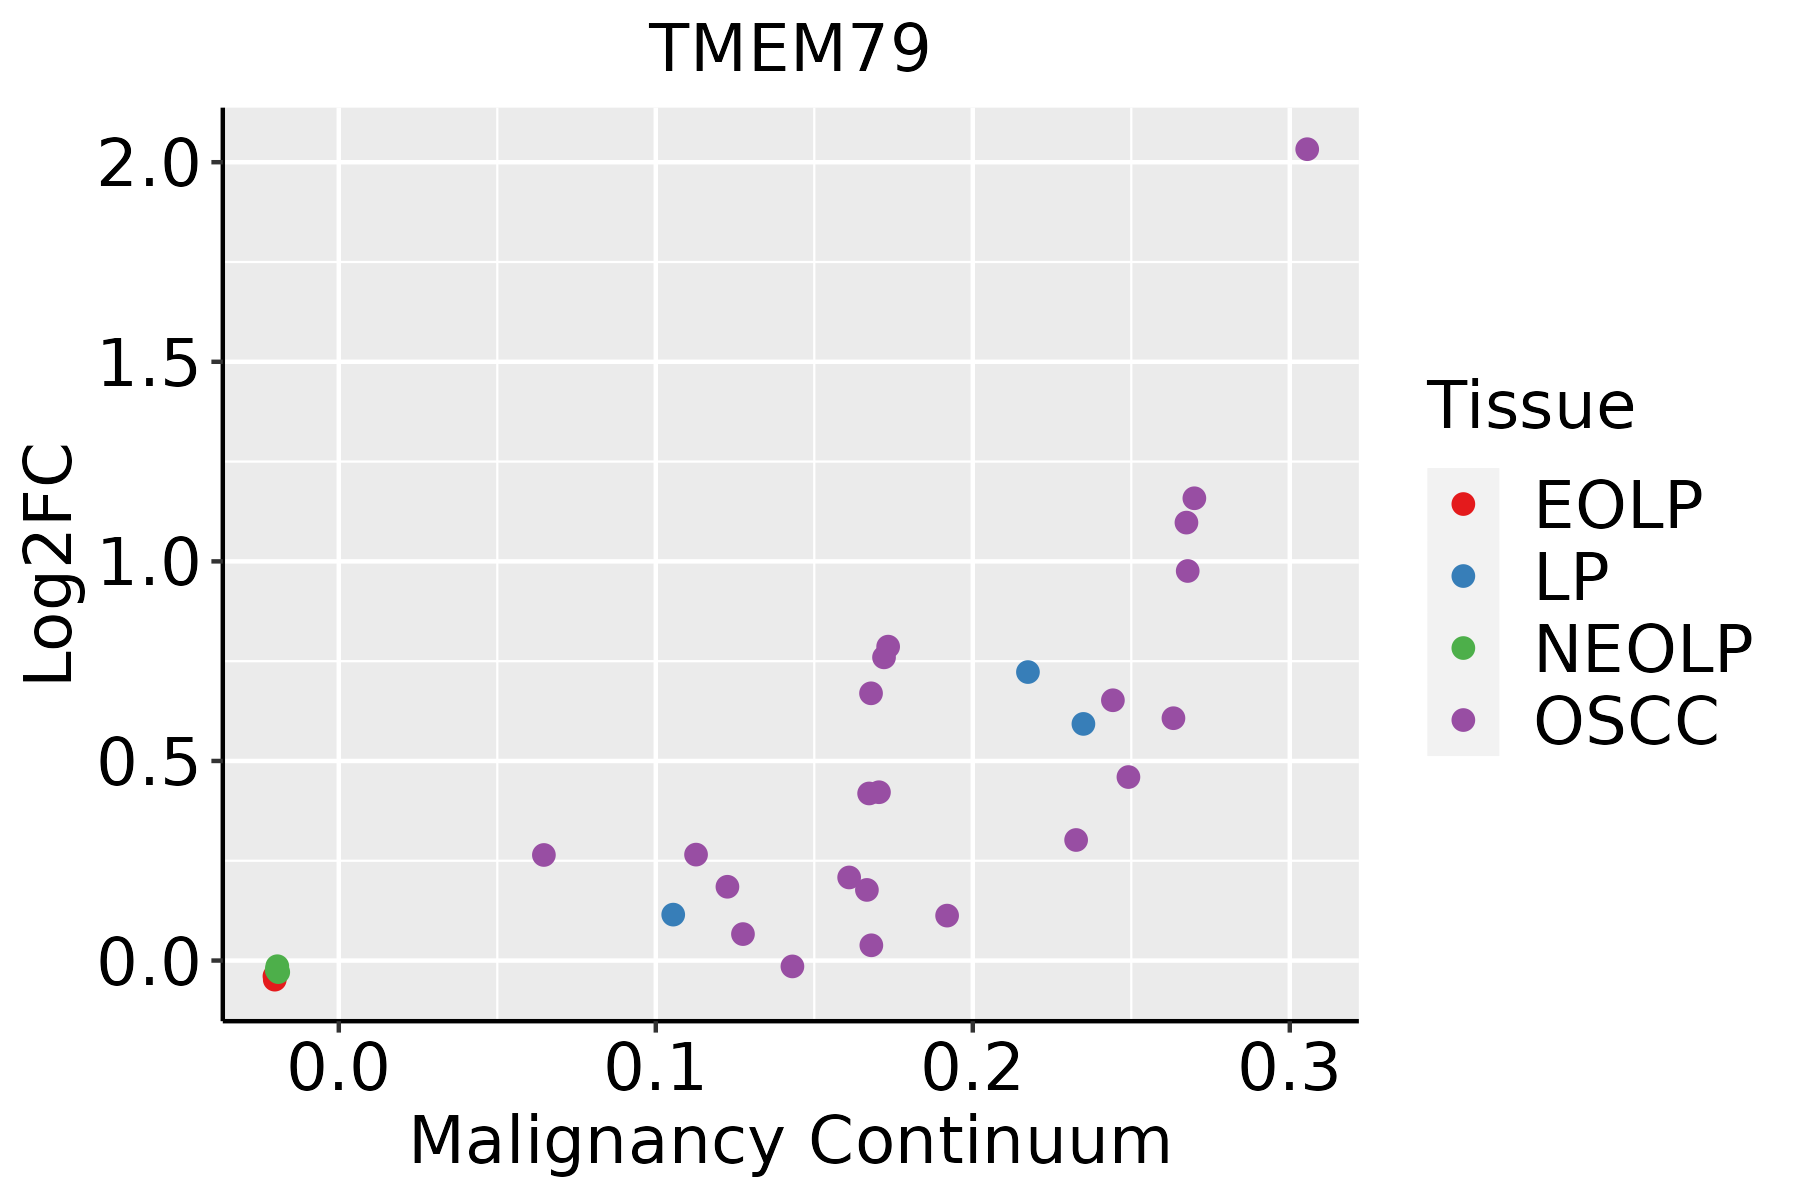 | EOLP: Erosive Oral lichen planus |
| LP: leukoplakia | ||
| NEOLP: Non-erosive oral lichen planus | ||
| OSCC: Oral squamous cell carcinoma | ||
| Prostate | 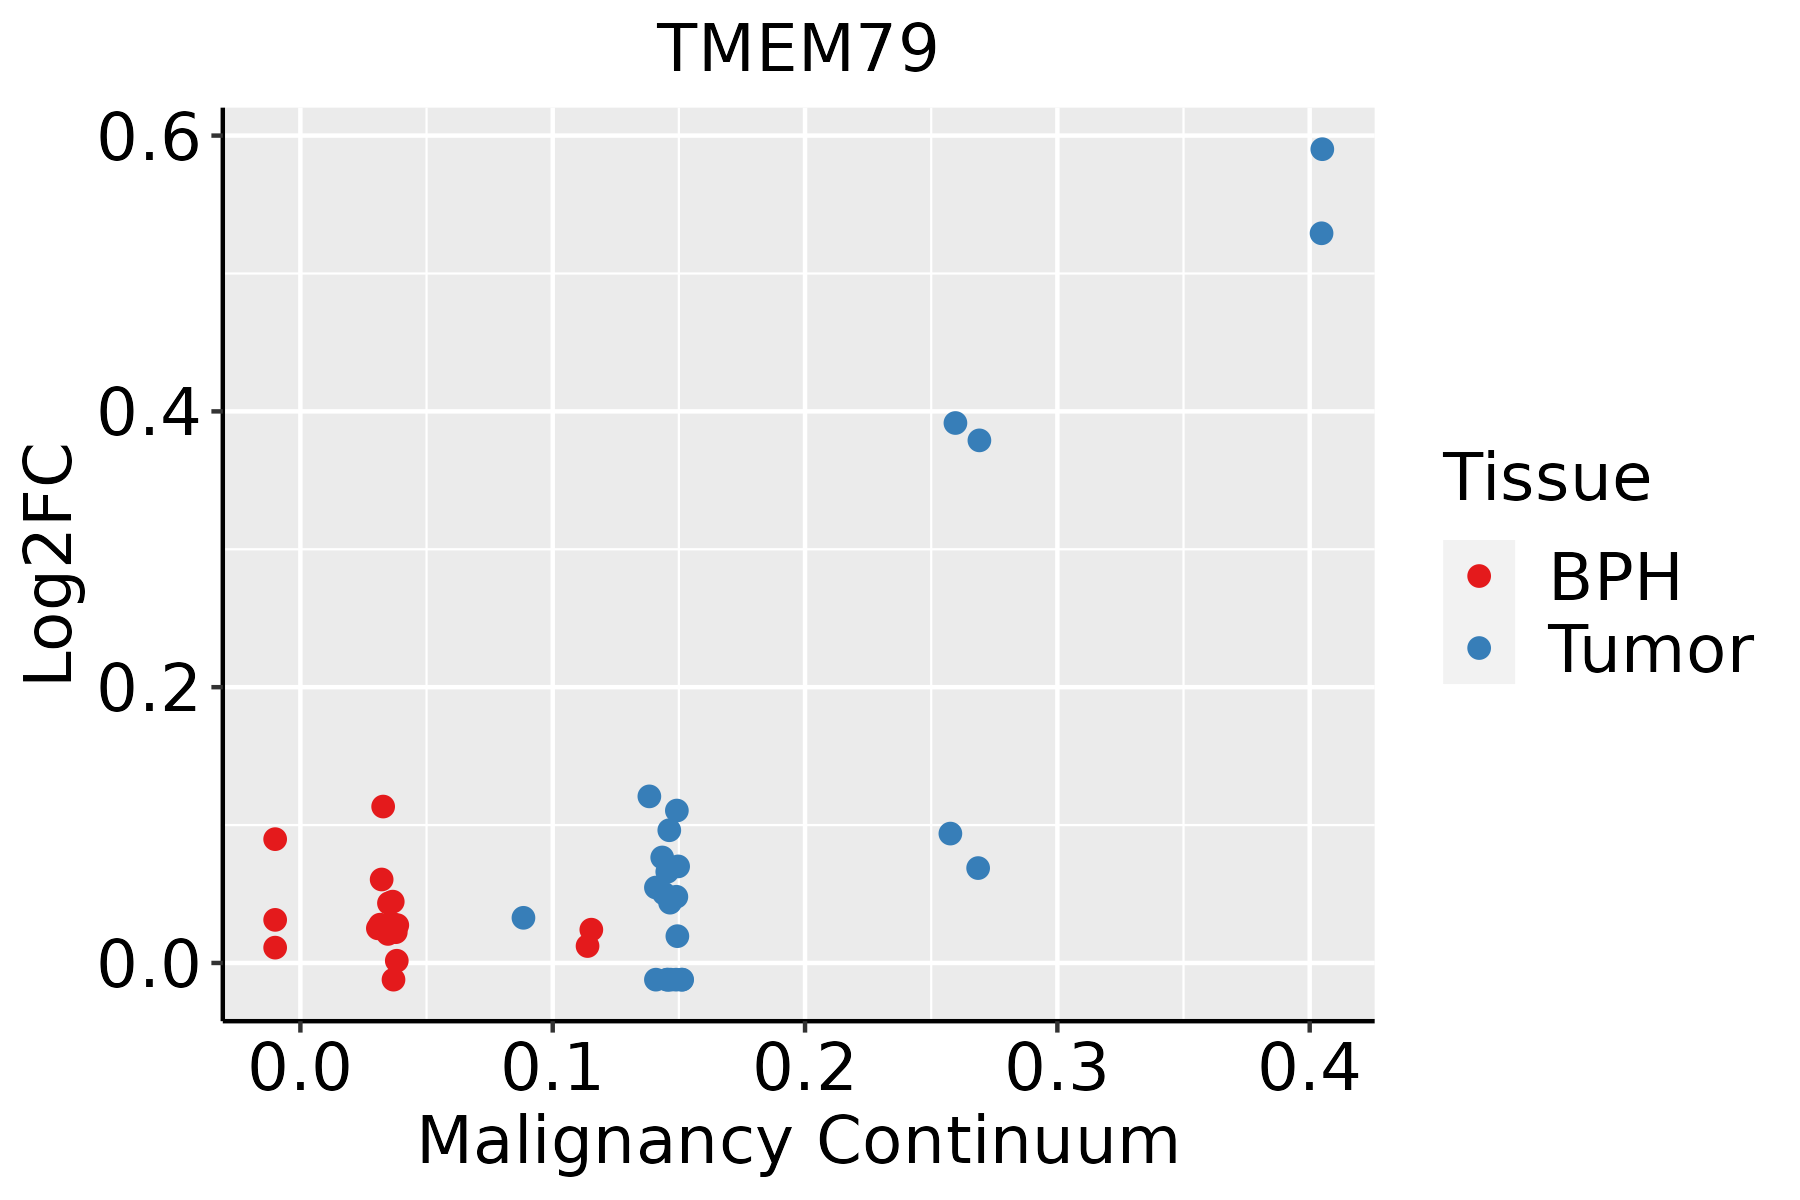 | BPH: Benign Prostatic Hyperplasia |
| Skin | 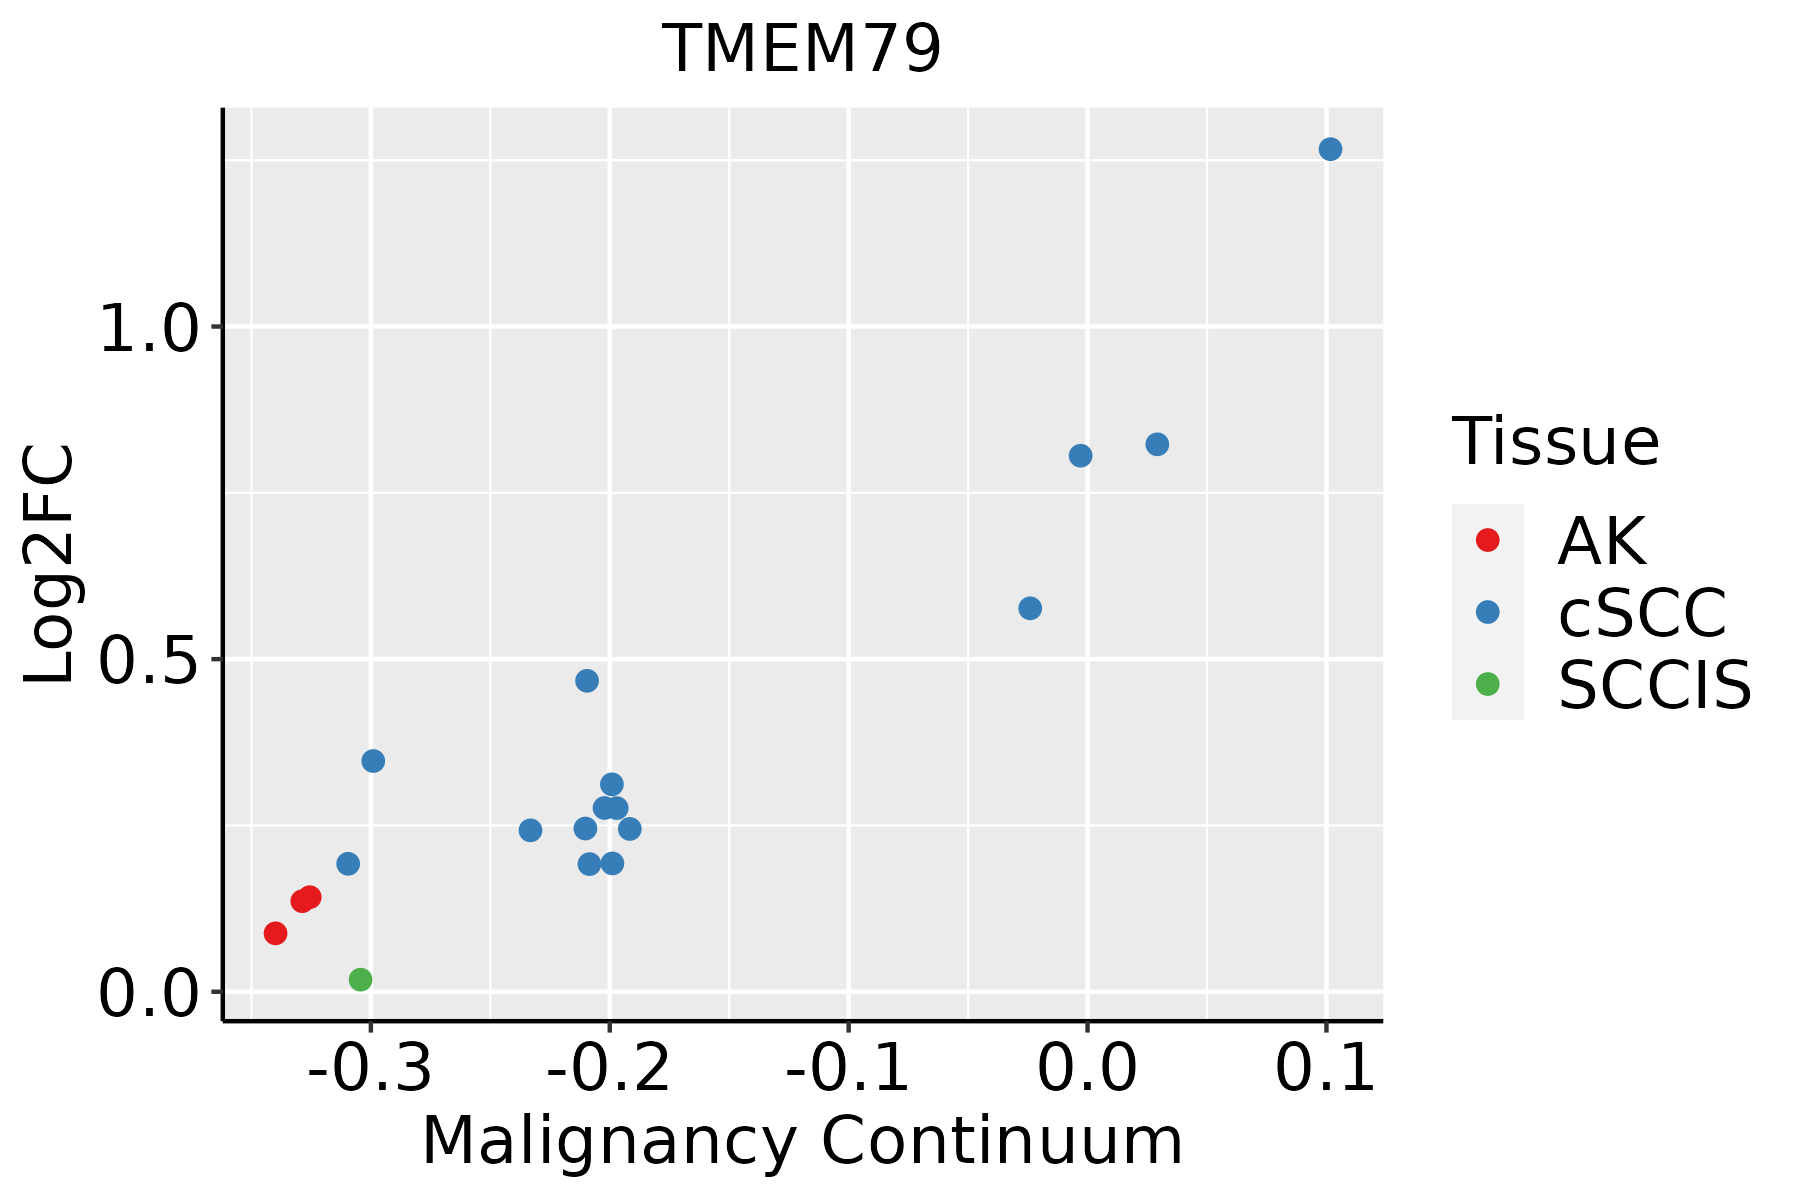 | AK: Actinic keratosis |
| cSCC: Cutaneous squamous cell carcinoma | ||
| SCCIS:squamous cell carcinoma in situ |
| ∗log2FC in expression of this searched gene in stem-like cells from each diseased tissue sample relative to stem-like cells in normal samples in each tissue plotted against the malignancy continuum. Samples are colored based on if they are from different disease stage. |
Top |
Malignant transformation related pathway analysis |
| Find out the enriched GO biological processes and KEGG pathways involved in transition from healthy to precancer to cancer |
| Tissue | Disease Stage | Enriched GO biological Processes |
| Colorectum | AD |  |
| Colorectum | SER |  |
| Colorectum | MSS |  |
| Colorectum | MSI-H |  |
| Colorectum | FAP |  |
| ∗Top 15 enriched GO BP terms are showed in the bar plot of each disease state in each tissue. Each row represents a significant GO biological process which is colored according to the -log10(p.adjust). |
| Page: 1 2 3 4 5 6 7 8 9 |
| GO ID | Tissue | Disease Stage | Description | Gene Ratio | Bg Ratio | pvalue | p.adjust | Count |
| GO:00435888 | Esophagus | ESCC | skin development | 163/8552 | 263/18723 | 6.48e-08 | 1.14e-06 | 163 |
| GO:000854410 | Esophagus | ESCC | epidermis development | 193/8552 | 324/18723 | 2.87e-07 | 4.19e-06 | 193 |
| GO:000206420 | Esophagus | ESCC | epithelial cell development | 136/8552 | 220/18723 | 9.50e-07 | 1.21e-05 | 136 |
| GO:000991310 | Esophagus | ESCC | epidermal cell differentiation | 122/8552 | 202/18723 | 1.69e-05 | 1.51e-04 | 122 |
| GO:00456826 | Esophagus | ESCC | regulation of epidermis development | 46/8552 | 65/18723 | 3.65e-05 | 2.97e-04 | 46 |
| GO:00302167 | Esophagus | ESCC | keratinocyte differentiation | 86/8552 | 139/18723 | 8.53e-05 | 6.19e-04 | 86 |
| GO:00224043 | Esophagus | ESCC | molting cycle process | 53/8552 | 84/18723 | 9.62e-04 | 4.88e-03 | 53 |
| GO:00224053 | Esophagus | ESCC | hair cycle process | 53/8552 | 84/18723 | 9.62e-04 | 4.88e-03 | 53 |
| GO:0001942 | Esophagus | ESCC | hair follicle development | 51/8552 | 81/18723 | 1.27e-03 | 6.14e-03 | 51 |
| GO:0098773 | Esophagus | ESCC | skin epidermis development | 53/8552 | 85/18723 | 1.43e-03 | 6.77e-03 | 53 |
| GO:00423033 | Esophagus | ESCC | molting cycle | 64/8552 | 107/18723 | 2.24e-03 | 9.85e-03 | 64 |
| GO:00426333 | Esophagus | ESCC | hair cycle | 64/8552 | 107/18723 | 2.24e-03 | 9.85e-03 | 64 |
| GO:00456841 | Esophagus | ESCC | positive regulation of epidermis development | 23/8552 | 32/18723 | 2.43e-03 | 1.06e-02 | 23 |
| GO:00435887 | Oral cavity | OSCC | skin development | 143/7305 | 263/18723 | 2.77e-07 | 4.27e-06 | 143 |
| GO:00085449 | Oral cavity | OSCC | epidermis development | 171/7305 | 324/18723 | 2.89e-07 | 4.43e-06 | 171 |
| GO:00302166 | Oral cavity | OSCC | keratinocyte differentiation | 81/7305 | 139/18723 | 3.16e-06 | 3.81e-05 | 81 |
| GO:00099139 | Oral cavity | OSCC | epidermal cell differentiation | 109/7305 | 202/18723 | 1.08e-05 | 1.14e-04 | 109 |
| GO:000206419 | Oral cavity | OSCC | epithelial cell development | 116/7305 | 220/18723 | 2.34e-05 | 2.21e-04 | 116 |
| GO:00456825 | Oral cavity | OSCC | regulation of epidermis development | 41/7305 | 65/18723 | 7.29e-05 | 5.73e-04 | 41 |
| GO:005087819 | Oral cavity | OSCC | regulation of body fluid levels | 179/7305 | 379/18723 | 6.19e-04 | 3.50e-03 | 179 |
| Page: 1 2 3 4 |
| Pathway ID | Tissue | Disease Stage | Description | Gene Ratio | Bg Ratio | pvalue | p.adjust | qvalue | Count |
| Page: 1 |
Top |
Cell-cell communication analysis |
| Identification of potential cell-cell interactions between two cell types and their ligand-receptor pairs for different disease states |
| Ligand | Receptor | LRpair | Pathway | Tissue | Disease Stage |
| Page: 1 |
Top |
Single-cell gene regulatory network inference analysis |
| Find out the significant the regulons (TFs) and the target genes of each regulon across cell types for different disease states |
| TF | Cell Type | Tissue | Disease Stage | Target Gene | RSS | Regulon Activity |
| ∗The dot plots of a searched regulon are shown for all cell subpopulations in each disease state of each tissue based on the regulon specific score inferred using pySCENIC and by calculating the average expression. |
| Page: 1 |
Top |
Somatic mutation of malignant transformation related genes |
| Annotation of somatic variants for genes involved in malignant transformation |
| Hugo Symbol | Variant Class | Variant Classification | dbSNP RS | HGVSc | HGVSp | HGVSp Short | SWISSPROT | BIOTYPE | SIFT | PolyPhen | Tumor Sample Barcode | Tissue | Histology | Sex | Age | Stage | Therapy Types | Drugs | Outcome |
| TMEM79 | SNV | Missense_Mutation | c.896N>T | p.Ala299Val | p.A299V | Q9BSE2 | protein_coding | tolerated(0.11) | possibly_damaging(0.781) | TCGA-A8-A09Z-01 | Breast | breast invasive carcinoma | Female | >=65 | I/II | Unknown | Unknown | SD | |
| TMEM79 | SNV | Missense_Mutation | c.178G>C | p.Glu60Gln | p.E60Q | Q9BSE2 | protein_coding | tolerated(0.08) | benign(0.361) | TCGA-AC-A23H-01 | Breast | breast invasive carcinoma | Female | >=65 | I/II | Unknown | Unknown | PD | |
| TMEM79 | SNV | Missense_Mutation | rs762068186 | c.658N>A | p.Ala220Thr | p.A220T | Q9BSE2 | protein_coding | tolerated(0.29) | benign(0.003) | TCGA-Z7-A8R5-01 | Breast | breast invasive carcinoma | Female | <65 | III/IV | Chemotherapy | adriamycin | PD |
| TMEM79 | SNV | Missense_Mutation | novel | c.1021N>A | p.Gly341Ser | p.G341S | Q9BSE2 | protein_coding | deleterious(0) | probably_damaging(0.996) | TCGA-EA-A3HS-01 | Cervix | cervical & endocervical cancer | Female | <65 | I/II | Unknown | Unknown | SD |
| TMEM79 | SNV | Missense_Mutation | rs748534614 | c.890N>G | p.Asn297Ser | p.N297S | Q9BSE2 | protein_coding | deleterious(0.01) | probably_damaging(0.962) | TCGA-A6-3808-01 | Colorectum | colon adenocarcinoma | Male | >=65 | I/II | Unknown | Unknown | SD |
| TMEM79 | SNV | Missense_Mutation | c.979N>C | p.Tyr327His | p.Y327H | Q9BSE2 | protein_coding | deleterious(0) | probably_damaging(0.995) | TCGA-AA-3975-01 | Colorectum | colon adenocarcinoma | Male | >=65 | I/II | Unknown | Unknown | SD | |
| TMEM79 | SNV | Missense_Mutation | c.172G>T | p.Ala58Ser | p.A58S | Q9BSE2 | protein_coding | tolerated(0.05) | benign(0.168) | TCGA-CK-4951-01 | Colorectum | colon adenocarcinoma | Female | >=65 | I/II | Unknown | Unknown | PD | |
| TMEM79 | SNV | Missense_Mutation | novel | c.891C>G | p.Asn297Lys | p.N297K | Q9BSE2 | protein_coding | deleterious(0.01) | probably_damaging(0.946) | TCGA-AG-3726-01 | Colorectum | rectum adenocarcinoma | Female | <65 | I/II | Unknown | Unknown | SD |
| TMEM79 | SNV | Missense_Mutation | rs750729853 | c.610G>A | p.Val204Met | p.V204M | Q9BSE2 | protein_coding | tolerated(0.41) | benign(0.024) | TCGA-AG-A02N-01 | Colorectum | rectum adenocarcinoma | Male | >=65 | I/II | Chemotherapy | folinic | CR |
| TMEM79 | SNV | Missense_Mutation | rs151038552 | c.343G>A | p.Glu115Lys | p.E115K | Q9BSE2 | protein_coding | tolerated(0.16) | benign(0.015) | TCGA-F5-6814-01 | Colorectum | rectum adenocarcinoma | Male | <65 | I/II | Unknown | Unknown | SD |
| Page: 1 2 3 4 5 |
Top |
Related drugs of malignant transformation related genes |
| Identification of chemicals and drugs interact with genes involved in malignant transfromation |
| (DGIdb 4.0) |
| Entrez ID | Symbol | Category | Interaction Types | Drug Claim Name | Drug Name | PMIDs |
| Page: 1 |

Copyright 2023-Present -The University of Texas Health Science Center at Houston |