
|
|||||
|
 | |
| |
| |
| |
| |
| |
|
Gene: TMEM67 |
Gene summary for TMEM67 |
| Gene information | Species | Human | Gene symbol | TMEM67 | Gene ID | 91147 |
| Gene name | transmembrane protein 67 | |
| Gene Alias | JBTS6 | |
| Cytomap | 8q22.1 | |
| Gene Type | protein-coding | GO ID | GO:0000226 | UniProtAcc | Q5HYA8 |
Top |
Malignant transformation analysis |
| Identification of the aberrant gene expression in precancerous and cancerous lesions by comparing the gene expression of stem-like cells in diseased tissues with normal stem cells |
| Entrez ID | Symbol | Replicates | Species | Organ | Tissue | Adj P-value | Log2FC | Malignancy |
| 91147 | TMEM67 | HCC1_Meng | Human | Liver | HCC | 4.01e-21 | -2.39e-02 | 0.0246 |
| 91147 | TMEM67 | HCC2_Meng | Human | Liver | HCC | 6.06e-14 | 4.43e-02 | 0.0107 |
| 91147 | TMEM67 | S014 | Human | Liver | HCC | 2.80e-11 | 6.13e-01 | 0.2254 |
| 91147 | TMEM67 | S015 | Human | Liver | HCC | 3.33e-09 | 5.82e-01 | 0.2375 |
| 91147 | TMEM67 | S016 | Human | Liver | HCC | 1.04e-23 | 1.12e+00 | 0.2243 |
| 91147 | TMEM67 | S028 | Human | Liver | HCC | 1.58e-02 | 3.16e-01 | 0.2503 |
| 91147 | TMEM67 | S029 | Human | Liver | HCC | 1.01e-02 | 3.03e-01 | 0.2581 |
| 91147 | TMEM67 | PTC01 | Human | Thyroid | PTC | 9.29e-11 | 1.47e-01 | 0.1899 |
| 91147 | TMEM67 | PTC04 | Human | Thyroid | PTC | 2.17e-08 | 1.08e-01 | 0.1927 |
| 91147 | TMEM67 | PTC05 | Human | Thyroid | PTC | 1.73e-08 | 3.19e-01 | 0.2065 |
| 91147 | TMEM67 | PTC06 | Human | Thyroid | PTC | 1.93e-14 | 3.08e-01 | 0.2057 |
| 91147 | TMEM67 | PTC07 | Human | Thyroid | PTC | 3.89e-12 | 2.16e-01 | 0.2044 |
| 91147 | TMEM67 | ATC09 | Human | Thyroid | ATC | 3.14e-05 | 2.96e-01 | 0.2871 |
| 91147 | TMEM67 | ATC11 | Human | Thyroid | ATC | 3.80e-02 | 3.44e-01 | 0.3386 |
| 91147 | TMEM67 | ATC12 | Human | Thyroid | ATC | 1.91e-04 | 7.38e-02 | 0.34 |
| 91147 | TMEM67 | ATC13 | Human | Thyroid | ATC | 1.24e-35 | 6.20e-01 | 0.34 |
| 91147 | TMEM67 | ATC1 | Human | Thyroid | ATC | 1.71e-05 | 3.37e-01 | 0.2878 |
| 91147 | TMEM67 | ATC4 | Human | Thyroid | ATC | 1.25e-08 | 1.05e-01 | 0.34 |
| 91147 | TMEM67 | ATC5 | Human | Thyroid | ATC | 1.34e-39 | 6.60e-01 | 0.34 |
| Page: 1 |
| Tissue | Expression Dynamics | Abbreviation |
| Liver | 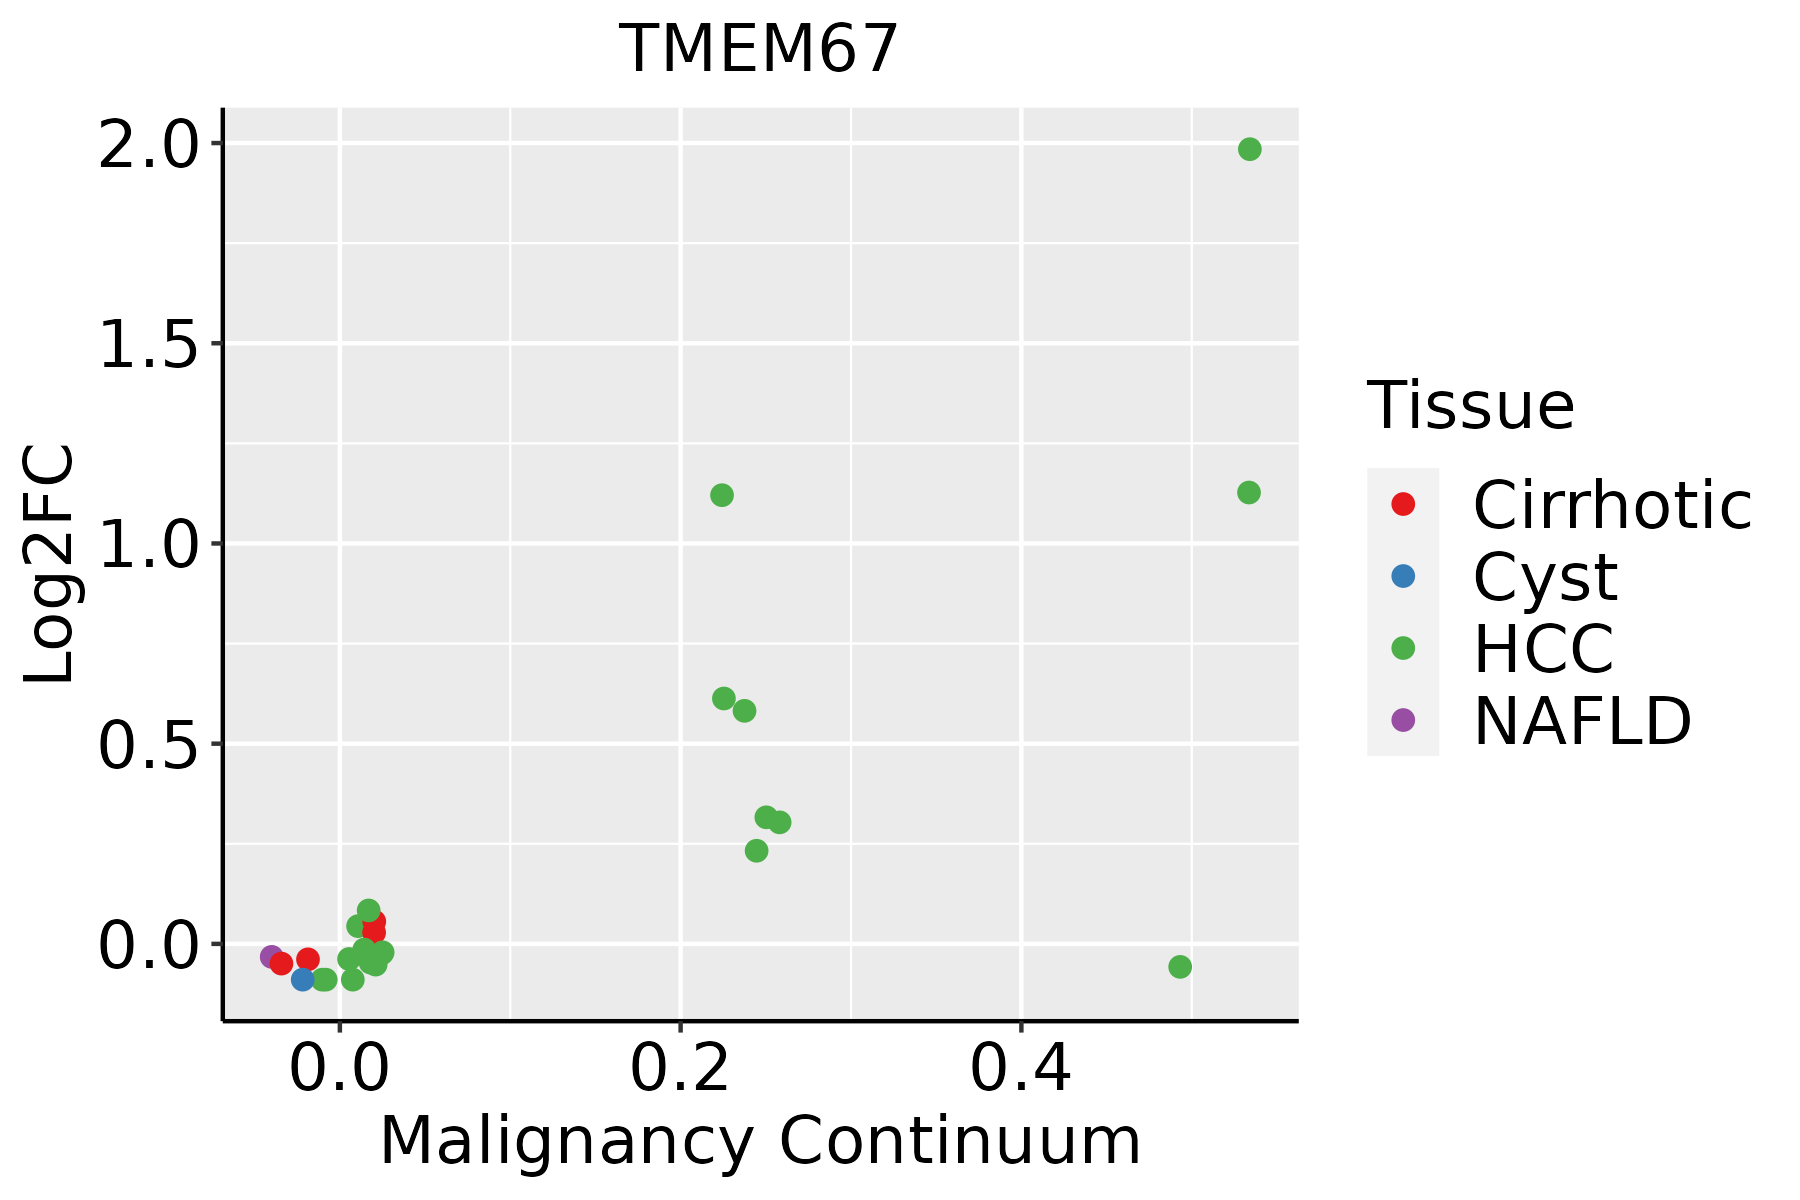 | HCC: Hepatocellular carcinoma |
| NAFLD: Non-alcoholic fatty liver disease | ||
| Thyroid | 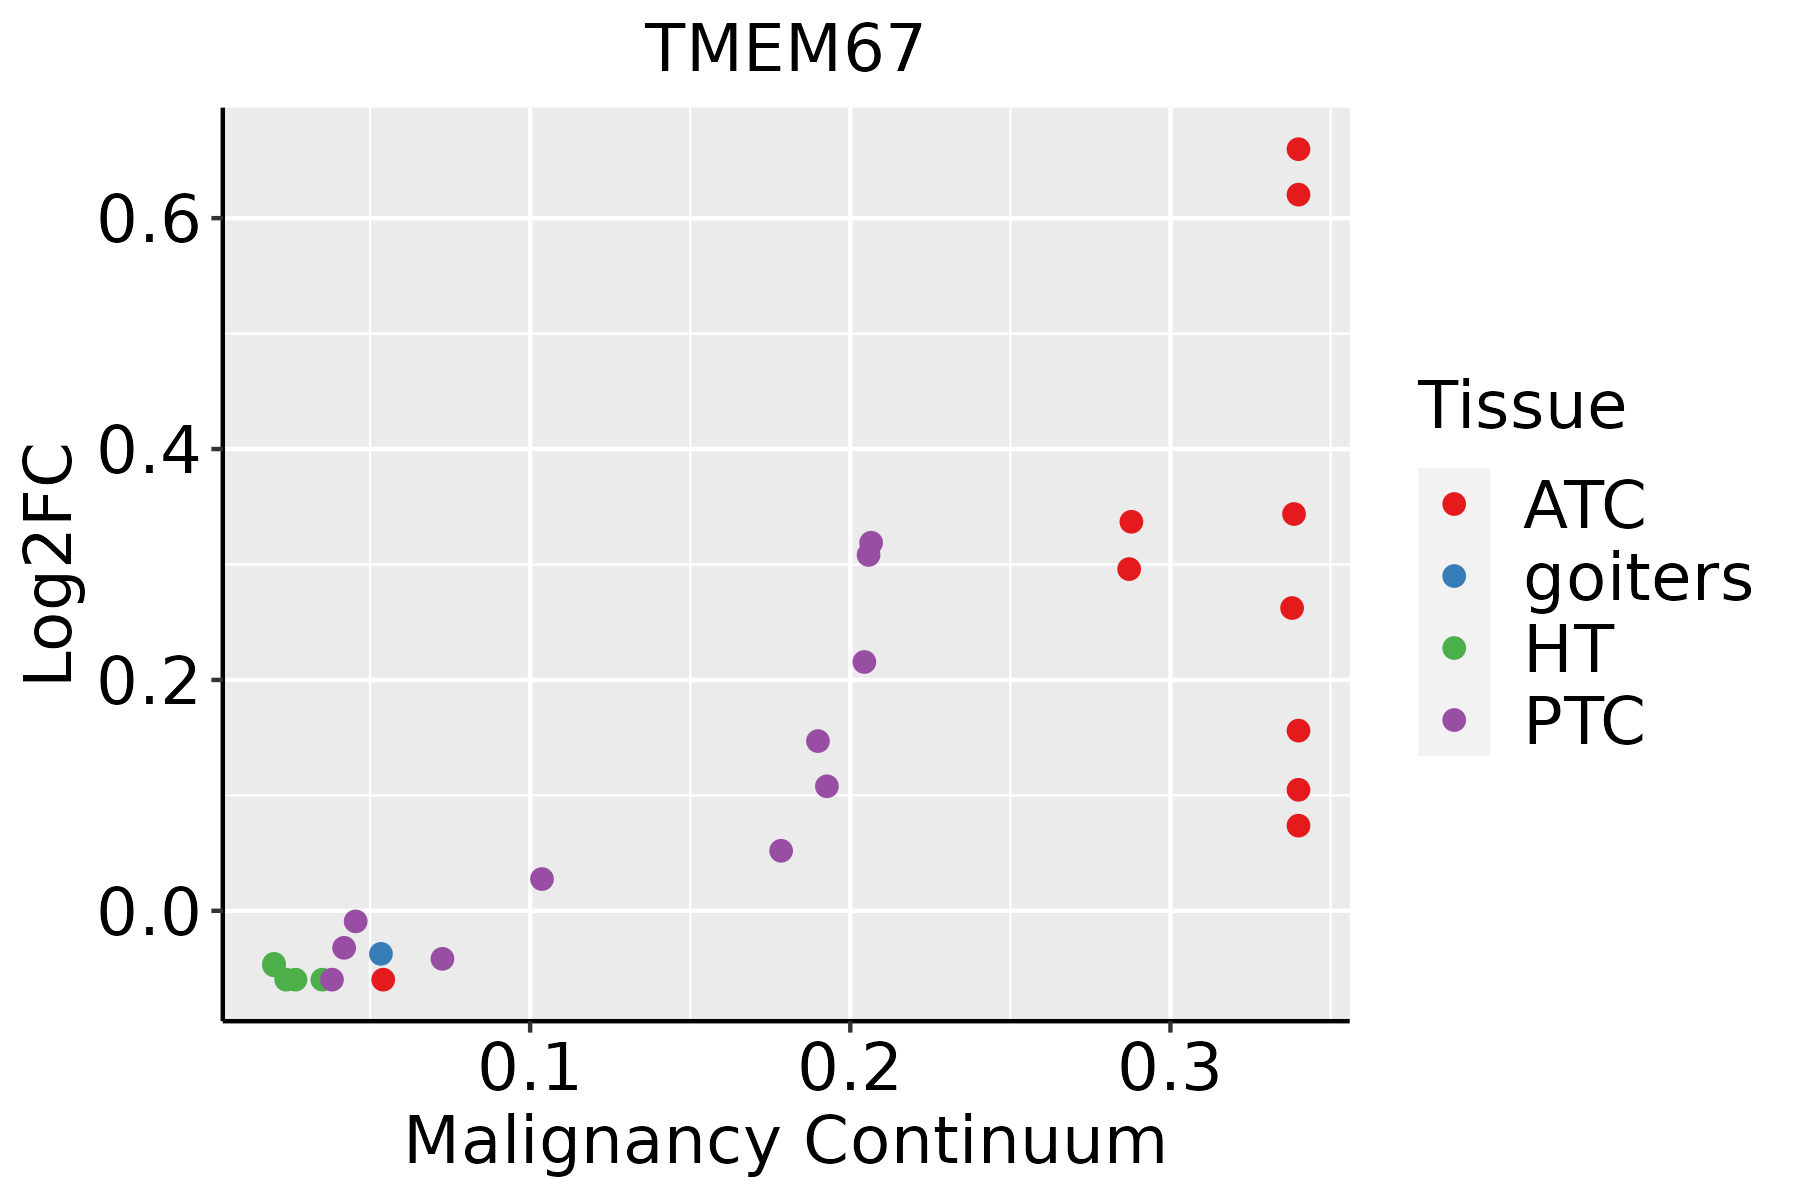 | ATC: Anaplastic thyroid cancer |
| HT: Hashimoto's thyroiditis | ||
| PTC: Papillary thyroid cancer |
| ∗log2FC in expression of this searched gene in stem-like cells from each diseased tissue sample relative to stem-like cells in normal samples in each tissue plotted against the malignancy continuum. Samples are colored based on if they are from different disease stage. |
Top |
Malignant transformation related pathway analysis |
| Find out the enriched GO biological processes and KEGG pathways involved in transition from healthy to precancer to cancer |
| Tissue | Disease Stage | Enriched GO biological Processes |
| Colorectum | AD |  |
| Colorectum | SER |  |
| Colorectum | MSS |  |
| Colorectum | MSI-H |  |
| Colorectum | FAP |  |
| ∗Top 15 enriched GO BP terms are showed in the bar plot of each disease state in each tissue. Each row represents a significant GO biological process which is colored according to the -log10(p.adjust). |
| Page: 1 2 3 4 5 6 7 8 9 |
| GO ID | Tissue | Disease Stage | Description | Gene Ratio | Bg Ratio | pvalue | p.adjust | Count |
| GO:001049822 | Liver | HCC | proteasomal protein catabolic process | 351/7958 | 490/18723 | 6.92e-40 | 1.46e-36 | 351 |
| GO:004316122 | Liver | HCC | proteasome-mediated ubiquitin-dependent protein catabolic process | 299/7958 | 412/18723 | 7.82e-36 | 8.27e-33 | 299 |
| GO:003497612 | Liver | HCC | response to endoplasmic reticulum stress | 189/7958 | 256/18723 | 1.43e-24 | 4.06e-22 | 189 |
| GO:003650311 | Liver | HCC | ERAD pathway | 88/7958 | 107/18723 | 2.87e-17 | 2.85e-15 | 88 |
| GO:00304331 | Liver | HCC | ubiquitin-dependent ERAD pathway | 72/7958 | 85/18723 | 9.78e-16 | 7.47e-14 | 72 |
| GO:001063912 | Liver | HCC | negative regulation of organelle organization | 204/7958 | 348/18723 | 7.67e-10 | 2.37e-08 | 204 |
| GO:0045786 | Liver | HCC | negative regulation of cell cycle | 204/7958 | 385/18723 | 1.84e-05 | 1.99e-04 | 204 |
| GO:0031023 | Liver | HCC | microtubule organizing center organization | 82/7958 | 143/18723 | 2.38e-04 | 1.79e-03 | 82 |
| GO:0007098 | Liver | HCC | centrosome cycle | 75/7958 | 130/18723 | 3.33e-04 | 2.34e-03 | 75 |
| GO:0010948 | Liver | HCC | negative regulation of cell cycle process | 152/7958 | 294/18723 | 8.50e-04 | 5.08e-03 | 152 |
| GO:0032886 | Liver | HCC | regulation of microtubule-based process | 123/7958 | 240/18723 | 3.69e-03 | 1.64e-02 | 123 |
| GO:00466052 | Liver | HCC | regulation of centrosome cycle | 30/7958 | 49/18723 | 6.31e-03 | 2.57e-02 | 30 |
| GO:00514946 | Liver | HCC | negative regulation of cytoskeleton organization | 84/7958 | 163/18723 | 1.22e-02 | 4.43e-02 | 84 |
| GO:0010498113 | Thyroid | PTC | proteasomal protein catabolic process | 297/5968 | 490/18723 | 4.58e-40 | 9.63e-37 | 297 |
| GO:0043161113 | Thyroid | PTC | proteasome-mediated ubiquitin-dependent protein catabolic process | 254/5968 | 412/18723 | 3.91e-36 | 4.54e-33 | 254 |
| GO:0034976113 | Thyroid | PTC | response to endoplasmic reticulum stress | 161/5968 | 256/18723 | 1.14e-24 | 3.27e-22 | 161 |
| GO:00365038 | Thyroid | PTC | ERAD pathway | 71/5968 | 107/18723 | 2.37e-13 | 1.22e-11 | 71 |
| GO:003043315 | Thyroid | PTC | ubiquitin-dependent ERAD pathway | 59/5968 | 85/18723 | 1.30e-12 | 5.91e-11 | 59 |
| GO:0010639112 | Thyroid | PTC | negative regulation of organelle organization | 163/5968 | 348/18723 | 3.04e-09 | 8.39e-08 | 163 |
| GO:00457867 | Thyroid | PTC | negative regulation of cell cycle | 166/5968 | 385/18723 | 1.93e-06 | 2.64e-05 | 166 |
| Page: 1 2 3 |
| Pathway ID | Tissue | Disease Stage | Description | Gene Ratio | Bg Ratio | pvalue | p.adjust | qvalue | Count |
| Page: 1 |
Top |
Cell-cell communication analysis |
| Identification of potential cell-cell interactions between two cell types and their ligand-receptor pairs for different disease states |
| Ligand | Receptor | LRpair | Pathway | Tissue | Disease Stage |
| Page: 1 |
Top |
Single-cell gene regulatory network inference analysis |
| Find out the significant the regulons (TFs) and the target genes of each regulon across cell types for different disease states |
| TF | Cell Type | Tissue | Disease Stage | Target Gene | RSS | Regulon Activity |
| ∗The dot plots of a searched regulon are shown for all cell subpopulations in each disease state of each tissue based on the regulon specific score inferred using pySCENIC and by calculating the average expression. |
| Page: 1 |
Top |
Somatic mutation of malignant transformation related genes |
| Annotation of somatic variants for genes involved in malignant transformation |
| Hugo Symbol | Variant Class | Variant Classification | dbSNP RS | HGVSc | HGVSp | HGVSp Short | SWISSPROT | BIOTYPE | SIFT | PolyPhen | Tumor Sample Barcode | Tissue | Histology | Sex | Age | Stage | Therapy Types | Drugs | Outcome |
| TMEM67 | SNV | Missense_Mutation | c.2250N>G | p.Phe750Leu | p.F750L | Q5HYA8 | protein_coding | deleterious(0) | possibly_damaging(0.686) | TCGA-5L-AAT1-01 | Breast | breast invasive carcinoma | Female | <65 | III/IV | Hormone Therapy | letrozol | SD | |
| TMEM67 | SNV | Missense_Mutation | c.2375N>T | p.Arg792Ile | p.R792I | Q5HYA8 | protein_coding | deleterious(0) | probably_damaging(0.992) | TCGA-A2-A0EQ-01 | Breast | breast invasive carcinoma | Female | <65 | I/II | Chemotherapy | adriamycin | SD | |
| TMEM67 | SNV | Missense_Mutation | c.367G>T | p.Ala123Ser | p.A123S | Q5HYA8 | protein_coding | tolerated(0.8) | benign(0.005) | TCGA-A2-A25A-01 | Breast | breast invasive carcinoma | Female | <65 | I/II | Unspecific | Cytoxan | SD | |
| TMEM67 | SNV | Missense_Mutation | c.670G>C | p.Glu224Gln | p.E224Q | Q5HYA8 | protein_coding | tolerated(0.3) | possibly_damaging(0.554) | TCGA-A8-A094-01 | Breast | breast invasive carcinoma | Female | >=65 | I/II | Unknown | Unknown | SD | |
| TMEM67 | SNV | Missense_Mutation | c.771N>A | p.Met257Ile | p.M257I | Q5HYA8 | protein_coding | deleterious(0.03) | benign(0.416) | TCGA-AC-A23H-01 | Breast | breast invasive carcinoma | Female | >=65 | I/II | Unknown | Unknown | PD | |
| TMEM67 | SNV | Missense_Mutation | c.2717N>A | p.Leu906His | p.L906H | Q5HYA8 | protein_coding | deleterious(0) | probably_damaging(0.985) | TCGA-AC-A23H-01 | Breast | breast invasive carcinoma | Female | >=65 | I/II | Unknown | Unknown | PD | |
| TMEM67 | SNV | Missense_Mutation | novel | c.94N>T | p.Arg32Cys | p.R32C | Q5HYA8 | protein_coding | tolerated_low_confidence(0.13) | benign(0.132) | TCGA-AR-A2LE-01 | Breast | breast invasive carcinoma | Female | >=65 | I/II | Hormone Therapy | tamoxiphen | PD |
| TMEM67 | SNV | Missense_Mutation | c.836N>T | p.Ala279Val | p.A279V | Q5HYA8 | protein_coding | tolerated(0.23) | benign(0.015) | TCGA-B6-A0X1-01 | Breast | breast invasive carcinoma | Female | <65 | I/II | Unknown | Unknown | PD | |
| TMEM67 | SNV | Missense_Mutation | c.275N>A | p.Gly92Glu | p.G92E | Q5HYA8 | protein_coding | tolerated(0.1) | probably_damaging(0.976) | TCGA-E2-A1LH-01 | Breast | breast invasive carcinoma | Female | <65 | I/II | Chemotherapy | adriamycin | SD | |
| TMEM67 | SNV | Missense_Mutation | novel | c.1288G>T | p.Asp430Tyr | p.D430Y | Q5HYA8 | protein_coding | deleterious(0.03) | possibly_damaging(0.832) | TCGA-EW-A1IZ-01 | Breast | breast invasive carcinoma | Female | <65 | III/IV | Chemotherapy | taxotere | SD |
| Page: 1 2 3 4 5 6 7 8 9 |
Top |
Related drugs of malignant transformation related genes |
| Identification of chemicals and drugs interact with genes involved in malignant transfromation |
| (DGIdb 4.0) |
| Entrez ID | Symbol | Category | Interaction Types | Drug Claim Name | Drug Name | PMIDs |
| Page: 1 |

Copyright 2023-Present -The University of Texas Health Science Center at Houston |