
|
|||||
|
 | |
| |
| |
| |
| |
| |
|
Gene: TMEM65 |
Gene summary for TMEM65 |
| Gene information | Species | Human | Gene symbol | TMEM65 | Gene ID | 157378 |
| Gene name | transmembrane protein 65 | |
| Gene Alias | TMEM65 | |
| Cytomap | 8q24.13 | |
| Gene Type | protein-coding | GO ID | GO:0003008 | UniProtAcc | Q6PI78 |
Top |
Malignant transformation analysis |
| Identification of the aberrant gene expression in precancerous and cancerous lesions by comparing the gene expression of stem-like cells in diseased tissues with normal stem cells |
| Entrez ID | Symbol | Replicates | Species | Organ | Tissue | Adj P-value | Log2FC | Malignancy |
| 157378 | TMEM65 | N_HPV_2 | Human | Cervix | N_HPV | 3.75e-02 | 2.93e-02 | -0.0131 |
| 157378 | TMEM65 | CCI_1 | Human | Cervix | CC | 4.94e-07 | 6.56e-01 | 0.528 |
| 157378 | TMEM65 | CCI_2 | Human | Cervix | CC | 3.31e-08 | 1.18e+00 | 0.5249 |
| 157378 | TMEM65 | LZE20T | Human | Esophagus | ESCC | 7.47e-04 | 2.36e-01 | 0.0662 |
| 157378 | TMEM65 | LZE24T | Human | Esophagus | ESCC | 9.08e-05 | 1.12e-01 | 0.0596 |
| 157378 | TMEM65 | P1T-E | Human | Esophagus | ESCC | 1.43e-05 | 1.56e-01 | 0.0875 |
| 157378 | TMEM65 | P2T-E | Human | Esophagus | ESCC | 1.14e-14 | 1.80e-01 | 0.1177 |
| 157378 | TMEM65 | P4T-E | Human | Esophagus | ESCC | 4.51e-08 | 2.01e-01 | 0.1323 |
| 157378 | TMEM65 | P5T-E | Human | Esophagus | ESCC | 1.10e-09 | 1.59e-01 | 0.1327 |
| 157378 | TMEM65 | P8T-E | Human | Esophagus | ESCC | 2.03e-05 | 8.04e-02 | 0.0889 |
| 157378 | TMEM65 | P9T-E | Human | Esophagus | ESCC | 1.27e-08 | 6.95e-02 | 0.1131 |
| 157378 | TMEM65 | P10T-E | Human | Esophagus | ESCC | 4.66e-05 | 7.59e-02 | 0.116 |
| 157378 | TMEM65 | P12T-E | Human | Esophagus | ESCC | 6.33e-13 | 2.01e-01 | 0.1122 |
| 157378 | TMEM65 | P15T-E | Human | Esophagus | ESCC | 7.53e-10 | 9.18e-02 | 0.1149 |
| 157378 | TMEM65 | P16T-E | Human | Esophagus | ESCC | 2.96e-07 | 5.60e-02 | 0.1153 |
| 157378 | TMEM65 | P17T-E | Human | Esophagus | ESCC | 3.45e-02 | 1.08e-01 | 0.1278 |
| 157378 | TMEM65 | P20T-E | Human | Esophagus | ESCC | 4.60e-02 | 2.24e-02 | 0.1124 |
| 157378 | TMEM65 | P21T-E | Human | Esophagus | ESCC | 3.82e-03 | 3.49e-02 | 0.1617 |
| 157378 | TMEM65 | P22T-E | Human | Esophagus | ESCC | 3.88e-09 | 4.49e-02 | 0.1236 |
| 157378 | TMEM65 | P23T-E | Human | Esophagus | ESCC | 5.17e-16 | 3.16e-01 | 0.108 |
| Page: 1 2 3 4 5 |
| Tissue | Expression Dynamics | Abbreviation |
| Cervix |  | CC: Cervix cancer |
| HSIL_HPV: HPV-infected high-grade squamous intraepithelial lesions | ||
| N_HPV: HPV-infected normal cervix | ||
| Esophagus |  | ESCC: Esophageal squamous cell carcinoma |
| HGIN: High-grade intraepithelial neoplasias | ||
| LGIN: Low-grade intraepithelial neoplasias | ||
| Liver |  | HCC: Hepatocellular carcinoma |
| NAFLD: Non-alcoholic fatty liver disease | ||
| Lung | 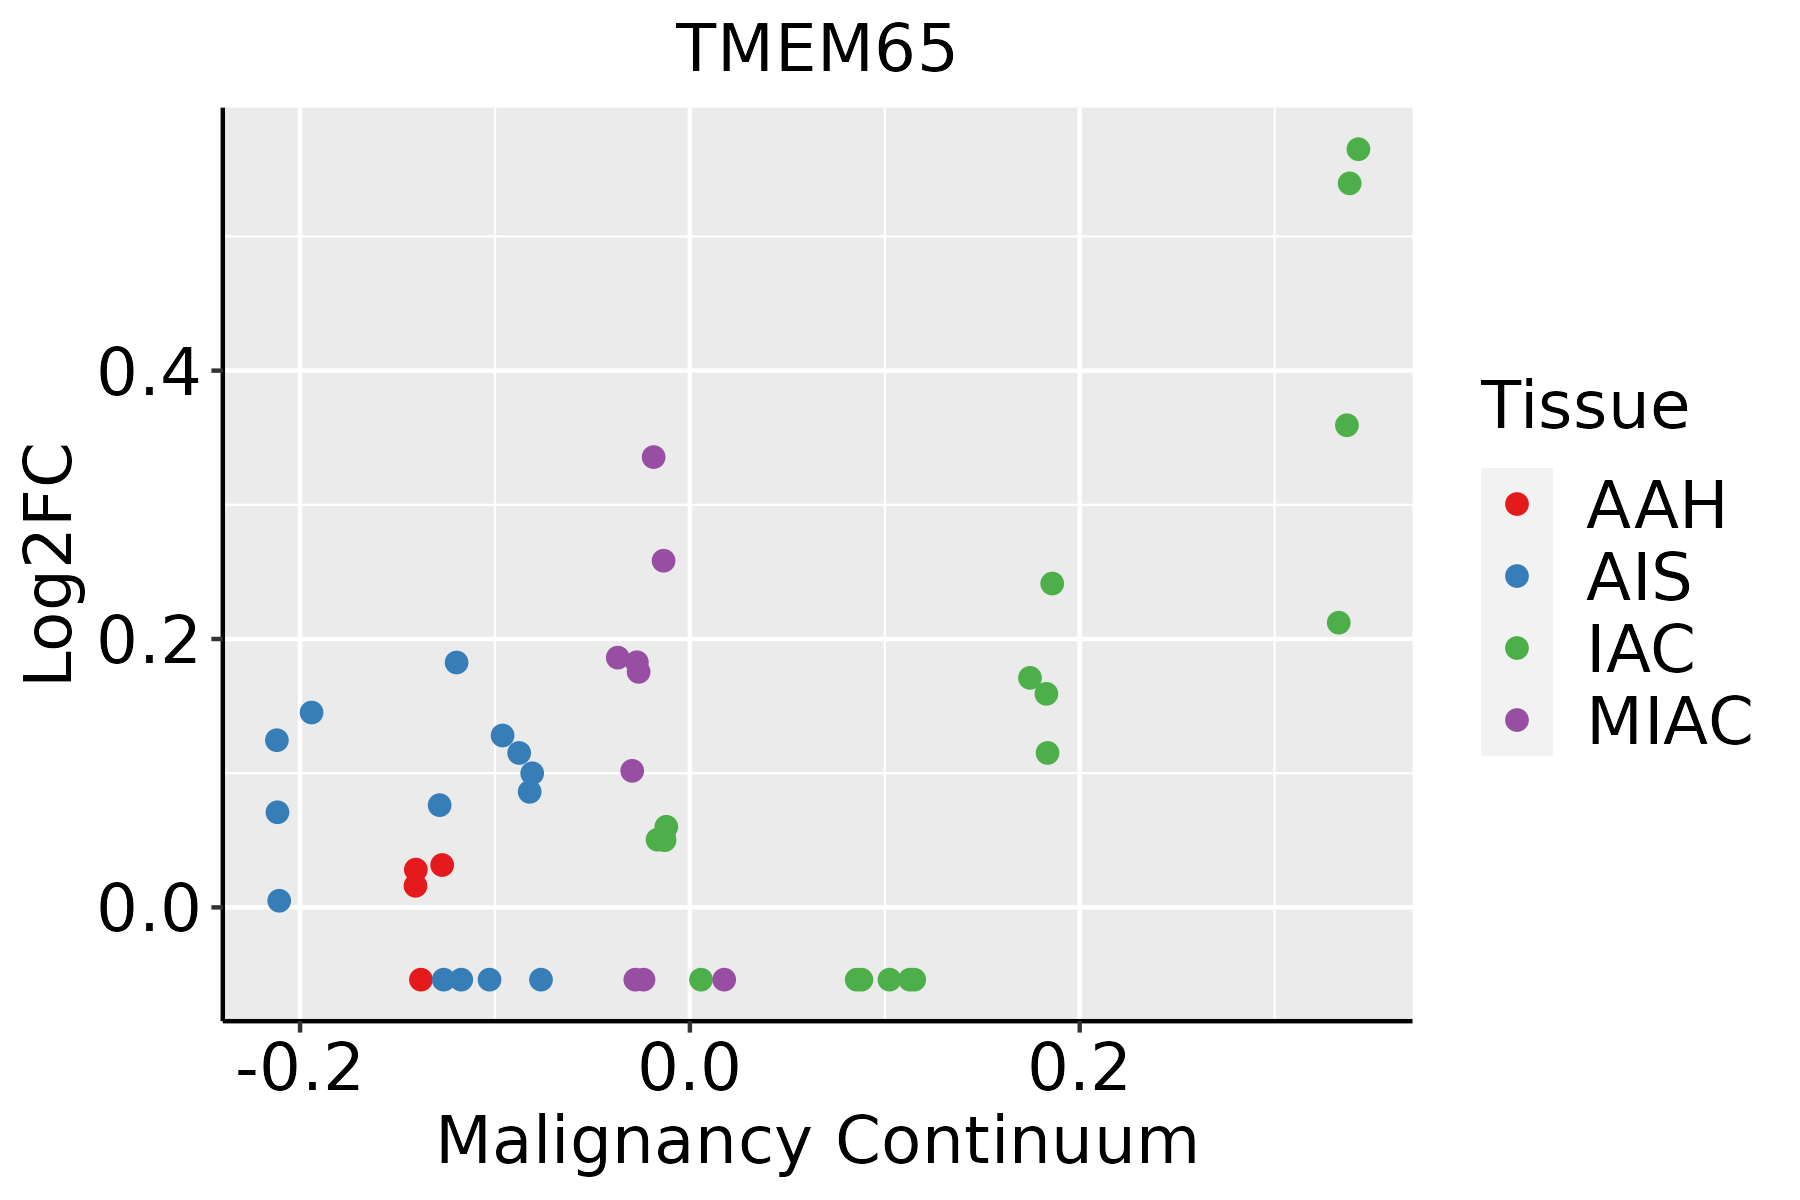 | AAH: Atypical adenomatous hyperplasia |
| AIS: Adenocarcinoma in situ | ||
| IAC: Invasive lung adenocarcinoma | ||
| MIA: Minimally invasive adenocarcinoma | ||
| Oral Cavity | 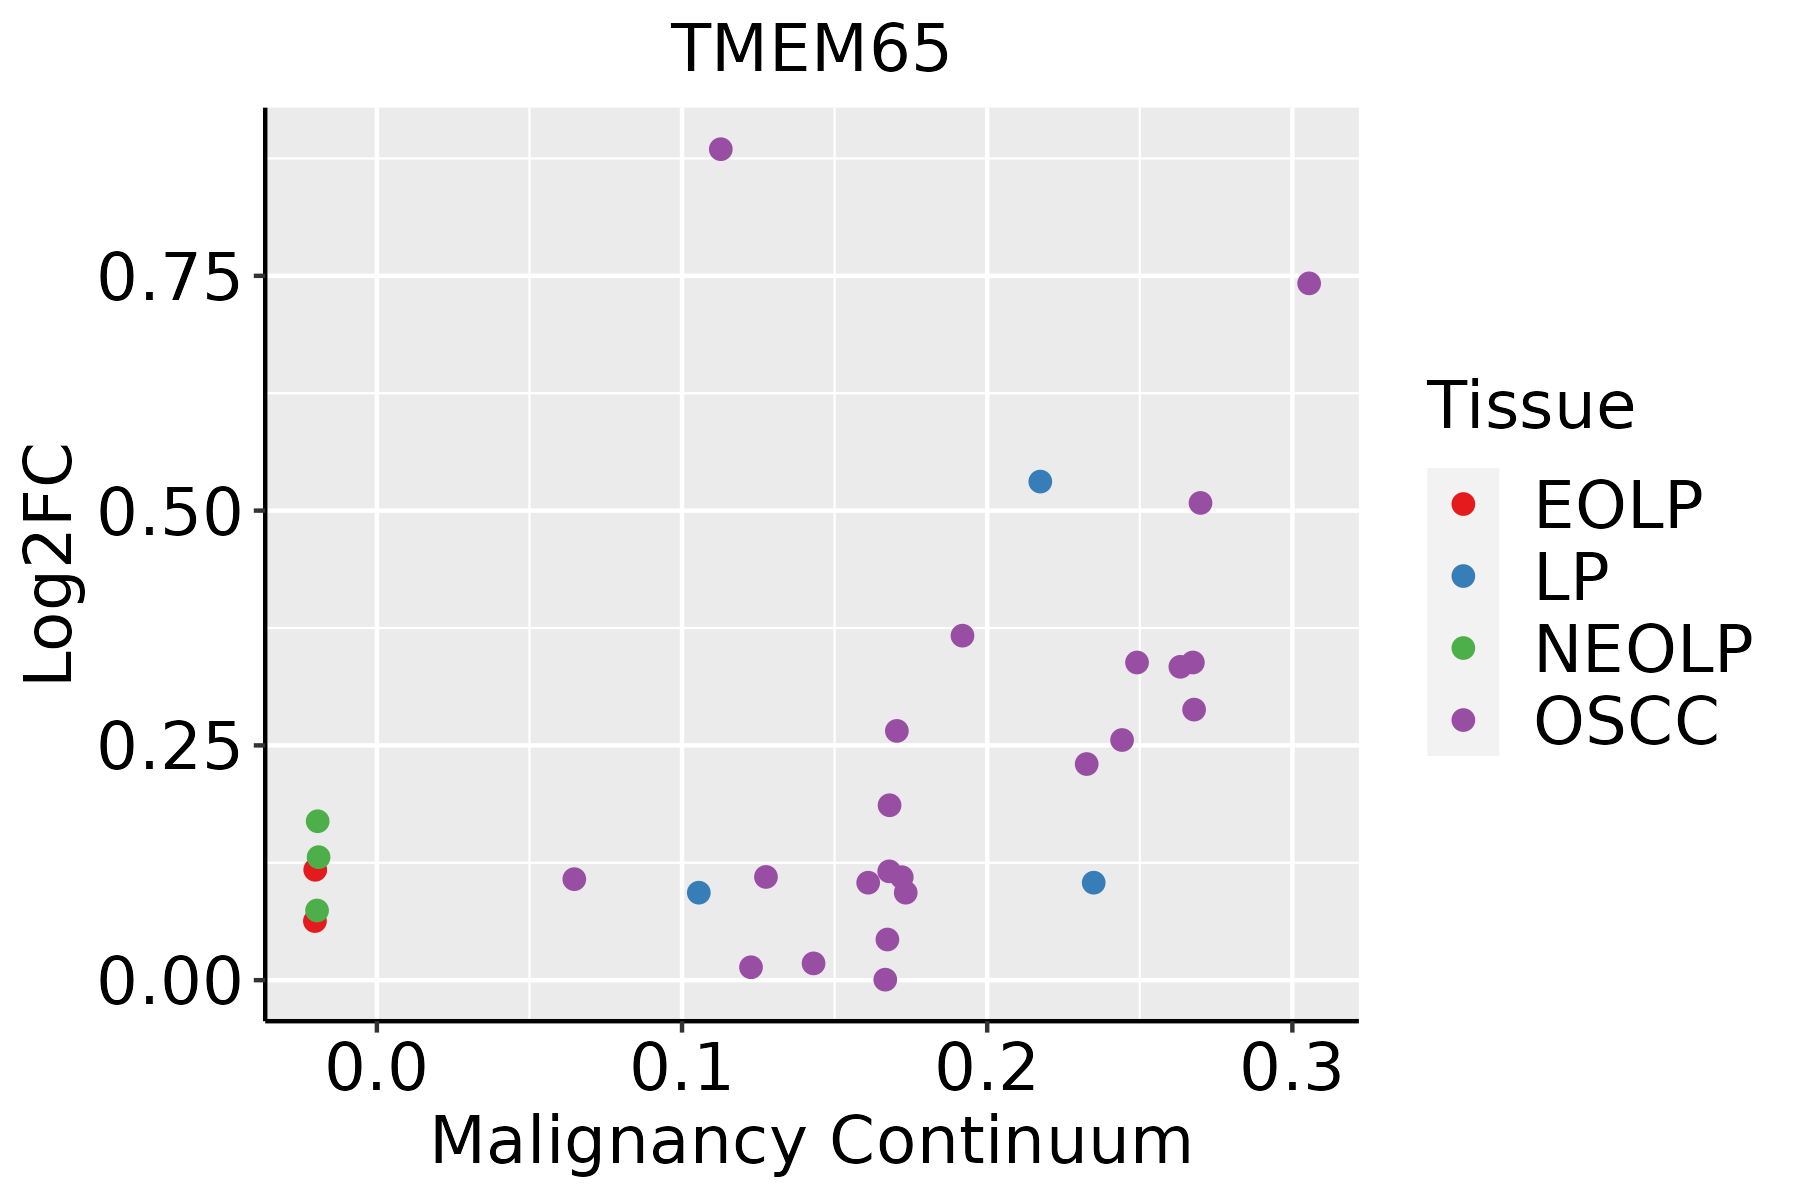 | EOLP: Erosive Oral lichen planus |
| LP: leukoplakia | ||
| NEOLP: Non-erosive oral lichen planus | ||
| OSCC: Oral squamous cell carcinoma | ||
| Thyroid |  | ATC: Anaplastic thyroid cancer |
| HT: Hashimoto's thyroiditis | ||
| PTC: Papillary thyroid cancer |
| ∗log2FC in expression of this searched gene in stem-like cells from each diseased tissue sample relative to stem-like cells in normal samples in each tissue plotted against the malignancy continuum. Samples are colored based on if they are from different disease stage. |
Top |
Malignant transformation related pathway analysis |
| Find out the enriched GO biological processes and KEGG pathways involved in transition from healthy to precancer to cancer |
| Tissue | Disease Stage | Enriched GO biological Processes |
| Colorectum | AD |  |
| Colorectum | SER |  |
| Colorectum | MSS |  |
| Colorectum | MSI-H |  |
| Colorectum | FAP |  |
| ∗Top 15 enriched GO BP terms are showed in the bar plot of each disease state in each tissue. Each row represents a significant GO biological process which is colored according to the -log10(p.adjust). |
| Page: 1 2 3 4 5 6 7 8 9 |
| GO ID | Tissue | Disease Stage | Description | Gene Ratio | Bg Ratio | pvalue | p.adjust | Count |
| GO:00613374 | Cervix | N_HPV | cardiac conduction | 8/534 | 98/18723 | 6.94e-03 | 4.59e-02 | 8 |
| GO:19035222 | Lung | IAC | regulation of blood circulation | 43/2061 | 256/18723 | 3.18e-03 | 2.77e-02 | 43 |
| GO:00032055 | Thyroid | PTC | cardiac chamber development | 72/5968 | 161/18723 | 4.13e-04 | 2.77e-03 | 72 |
| GO:00032314 | Thyroid | PTC | cardiac ventricle development | 55/5968 | 123/18723 | 1.87e-03 | 1.01e-02 | 55 |
| GO:000320512 | Thyroid | ATC | cardiac chamber development | 79/6293 | 161/18723 | 3.39e-05 | 2.80e-04 | 79 |
| GO:000323111 | Thyroid | ATC | cardiac ventricle development | 58/6293 | 123/18723 | 1.23e-03 | 6.46e-03 | 58 |
| Page: 1 |
| Pathway ID | Tissue | Disease Stage | Description | Gene Ratio | Bg Ratio | pvalue | p.adjust | qvalue | Count |
| Page: 1 |
Top |
Cell-cell communication analysis |
| Identification of potential cell-cell interactions between two cell types and their ligand-receptor pairs for different disease states |
| Ligand | Receptor | LRpair | Pathway | Tissue | Disease Stage |
| Page: 1 |
Top |
Single-cell gene regulatory network inference analysis |
| Find out the significant the regulons (TFs) and the target genes of each regulon across cell types for different disease states |
| TF | Cell Type | Tissue | Disease Stage | Target Gene | RSS | Regulon Activity |
| ∗The dot plots of a searched regulon are shown for all cell subpopulations in each disease state of each tissue based on the regulon specific score inferred using pySCENIC and by calculating the average expression. |
| Page: 1 |
Top |
Somatic mutation of malignant transformation related genes |
| Annotation of somatic variants for genes involved in malignant transformation |
| Hugo Symbol | Variant Class | Variant Classification | dbSNP RS | HGVSc | HGVSp | HGVSp Short | SWISSPROT | BIOTYPE | SIFT | PolyPhen | Tumor Sample Barcode | Tissue | Histology | Sex | Age | Stage | Therapy Types | Drugs | Outcome |
| TMEM65 | SNV | Missense_Mutation | c.697N>C | p.Asp233His | p.D233H | Q6PI78 | protein_coding | deleterious(0.01) | possibly_damaging(0.754) | TCGA-C8-A26Y-01 | Breast | breast invasive carcinoma | Female | >=65 | I/II | Unknown | Unknown | SD | |
| TMEM65 | SNV | Missense_Mutation | c.404T>G | p.Ile135Ser | p.I135S | Q6PI78 | protein_coding | tolerated(0.06) | benign(0.067) | TCGA-AA-A010-01 | Colorectum | colon adenocarcinoma | Female | <65 | I/II | Chemotherapy | folinic | CR | |
| TMEM65 | SNV | Missense_Mutation | rs146112743 | c.365N>T | p.Ala122Val | p.A122V | Q6PI78 | protein_coding | tolerated(0.05) | probably_damaging(0.996) | TCGA-F4-6570-01 | Colorectum | colon adenocarcinoma | Female | >=65 | I/II | Unknown | Unknown | SD |
| TMEM65 | SNV | Missense_Mutation | rs779556138 | c.604N>T | p.Arg202Cys | p.R202C | Q6PI78 | protein_coding | deleterious(0) | benign(0.165) | TCGA-AG-A002-01 | Colorectum | rectum adenocarcinoma | Male | <65 | I/II | Unknown | Unknown | SD |
| TMEM65 | SNV | Missense_Mutation | novel | c.575C>T | p.Thr192Ile | p.T192I | Q6PI78 | protein_coding | deleterious(0) | possibly_damaging(0.724) | TCGA-AP-A1DK-01 | Endometrium | uterine corpus endometrioid carcinoma | Female | <65 | I/II | Unknown | Unknown | SD |
| TMEM65 | SNV | Missense_Mutation | novel | c.488N>C | p.Asn163Thr | p.N163T | Q6PI78 | protein_coding | deleterious(0) | probably_damaging(0.997) | TCGA-AP-A1E0-01 | Endometrium | uterine corpus endometrioid carcinoma | Female | <65 | III/IV | Chemotherapy | paclitaxel | SD |
| TMEM65 | SNV | Missense_Mutation | c.470C>T | p.Ala157Val | p.A157V | Q6PI78 | protein_coding | deleterious(0) | benign(0.405) | TCGA-AX-A05Y-01 | Endometrium | uterine corpus endometrioid carcinoma | Female | <65 | I/II | Unknown | Unknown | PD | |
| TMEM65 | SNV | Missense_Mutation | novel | c.703N>C | p.Lys235Gln | p.K235Q | Q6PI78 | protein_coding | deleterious(0.04) | probably_damaging(0.994) | TCGA-AX-A06F-01 | Endometrium | uterine corpus endometrioid carcinoma | Female | <65 | III/IV | Chemotherapy | carboplatin | SD |
| TMEM65 | SNV | Missense_Mutation | c.587N>G | p.Val196Gly | p.V196G | Q6PI78 | protein_coding | deleterious(0.01) | benign(0.341) | TCGA-AX-A2HA-01 | Endometrium | uterine corpus endometrioid carcinoma | Female | <65 | I/II | Unknown | Unknown | SD | |
| TMEM65 | SNV | Missense_Mutation | c.490N>G | p.Leu164Val | p.L164V | Q6PI78 | protein_coding | deleterious(0.01) | probably_damaging(0.998) | TCGA-BG-A0M8-01 | Endometrium | uterine corpus endometrioid carcinoma | Female | <65 | I/II | Unknown | Unknown | SD |
| Page: 1 2 |
Top |
Related drugs of malignant transformation related genes |
| Identification of chemicals and drugs interact with genes involved in malignant transfromation |
| (DGIdb 4.0) |
| Entrez ID | Symbol | Category | Interaction Types | Drug Claim Name | Drug Name | PMIDs |
| Page: 1 |

Copyright 2023-Present -The University of Texas Health Science Center at Houston |