
|
|||||
|
 | |
| |
| |
| |
| |
| |
|
Gene: TMEM64 |
Gene summary for TMEM64 |
| Gene information | Species | Human | Gene symbol | TMEM64 | Gene ID | 169200 |
| Gene name | transmembrane protein 64 | |
| Gene Alias | TMEM64 | |
| Cytomap | 8q21.3 | |
| Gene Type | protein-coding | GO ID | GO:0001503 | UniProtAcc | Q6YI46 |
Top |
Malignant transformation analysis |
| Identification of the aberrant gene expression in precancerous and cancerous lesions by comparing the gene expression of stem-like cells in diseased tissues with normal stem cells |
| Entrez ID | Symbol | Replicates | Species | Organ | Tissue | Adj P-value | Log2FC | Malignancy |
| 169200 | TMEM64 | GSM4909281 | Human | Breast | IDC | 2.94e-14 | 3.23e-01 | 0.21 |
| 169200 | TMEM64 | GSM4909309 | Human | Breast | IDC | 1.01e-13 | 5.62e-01 | 0.0483 |
| 169200 | TMEM64 | GSM4909313 | Human | Breast | IDC | 3.10e-06 | 3.99e-01 | 0.0391 |
| 169200 | TMEM64 | P3 | Human | Breast | IDC | 6.93e-07 | 6.63e-01 | 0.1542 |
| 169200 | TMEM64 | DCIS2 | Human | Breast | DCIS | 6.94e-19 | 1.11e-01 | 0.0085 |
| 169200 | TMEM64 | P2T-E | Human | Esophagus | ESCC | 2.60e-07 | 9.21e-02 | 0.1177 |
| 169200 | TMEM64 | P4T-E | Human | Esophagus | ESCC | 1.30e-09 | 2.21e-01 | 0.1323 |
| 169200 | TMEM64 | P5T-E | Human | Esophagus | ESCC | 1.23e-08 | 4.76e-02 | 0.1327 |
| 169200 | TMEM64 | P8T-E | Human | Esophagus | ESCC | 2.31e-04 | -4.00e-02 | 0.0889 |
| 169200 | TMEM64 | P9T-E | Human | Esophagus | ESCC | 6.14e-05 | 1.88e-02 | 0.1131 |
| 169200 | TMEM64 | P10T-E | Human | Esophagus | ESCC | 1.91e-16 | 3.66e-01 | 0.116 |
| 169200 | TMEM64 | P12T-E | Human | Esophagus | ESCC | 7.86e-14 | 3.23e-01 | 0.1122 |
| 169200 | TMEM64 | P15T-E | Human | Esophagus | ESCC | 4.03e-10 | 1.58e-01 | 0.1149 |
| 169200 | TMEM64 | P16T-E | Human | Esophagus | ESCC | 1.65e-13 | 1.59e-01 | 0.1153 |
| 169200 | TMEM64 | P20T-E | Human | Esophagus | ESCC | 5.70e-07 | 7.74e-02 | 0.1124 |
| 169200 | TMEM64 | P21T-E | Human | Esophagus | ESCC | 2.73e-05 | 3.88e-02 | 0.1617 |
| 169200 | TMEM64 | P22T-E | Human | Esophagus | ESCC | 1.58e-15 | 3.66e-02 | 0.1236 |
| 169200 | TMEM64 | P23T-E | Human | Esophagus | ESCC | 9.36e-06 | 1.92e-02 | 0.108 |
| 169200 | TMEM64 | P24T-E | Human | Esophagus | ESCC | 8.89e-04 | 2.57e-03 | 0.1287 |
| 169200 | TMEM64 | P26T-E | Human | Esophagus | ESCC | 5.63e-25 | 1.94e-01 | 0.1276 |
| Page: 1 2 3 4 |
| Tissue | Expression Dynamics | Abbreviation |
| Breast | 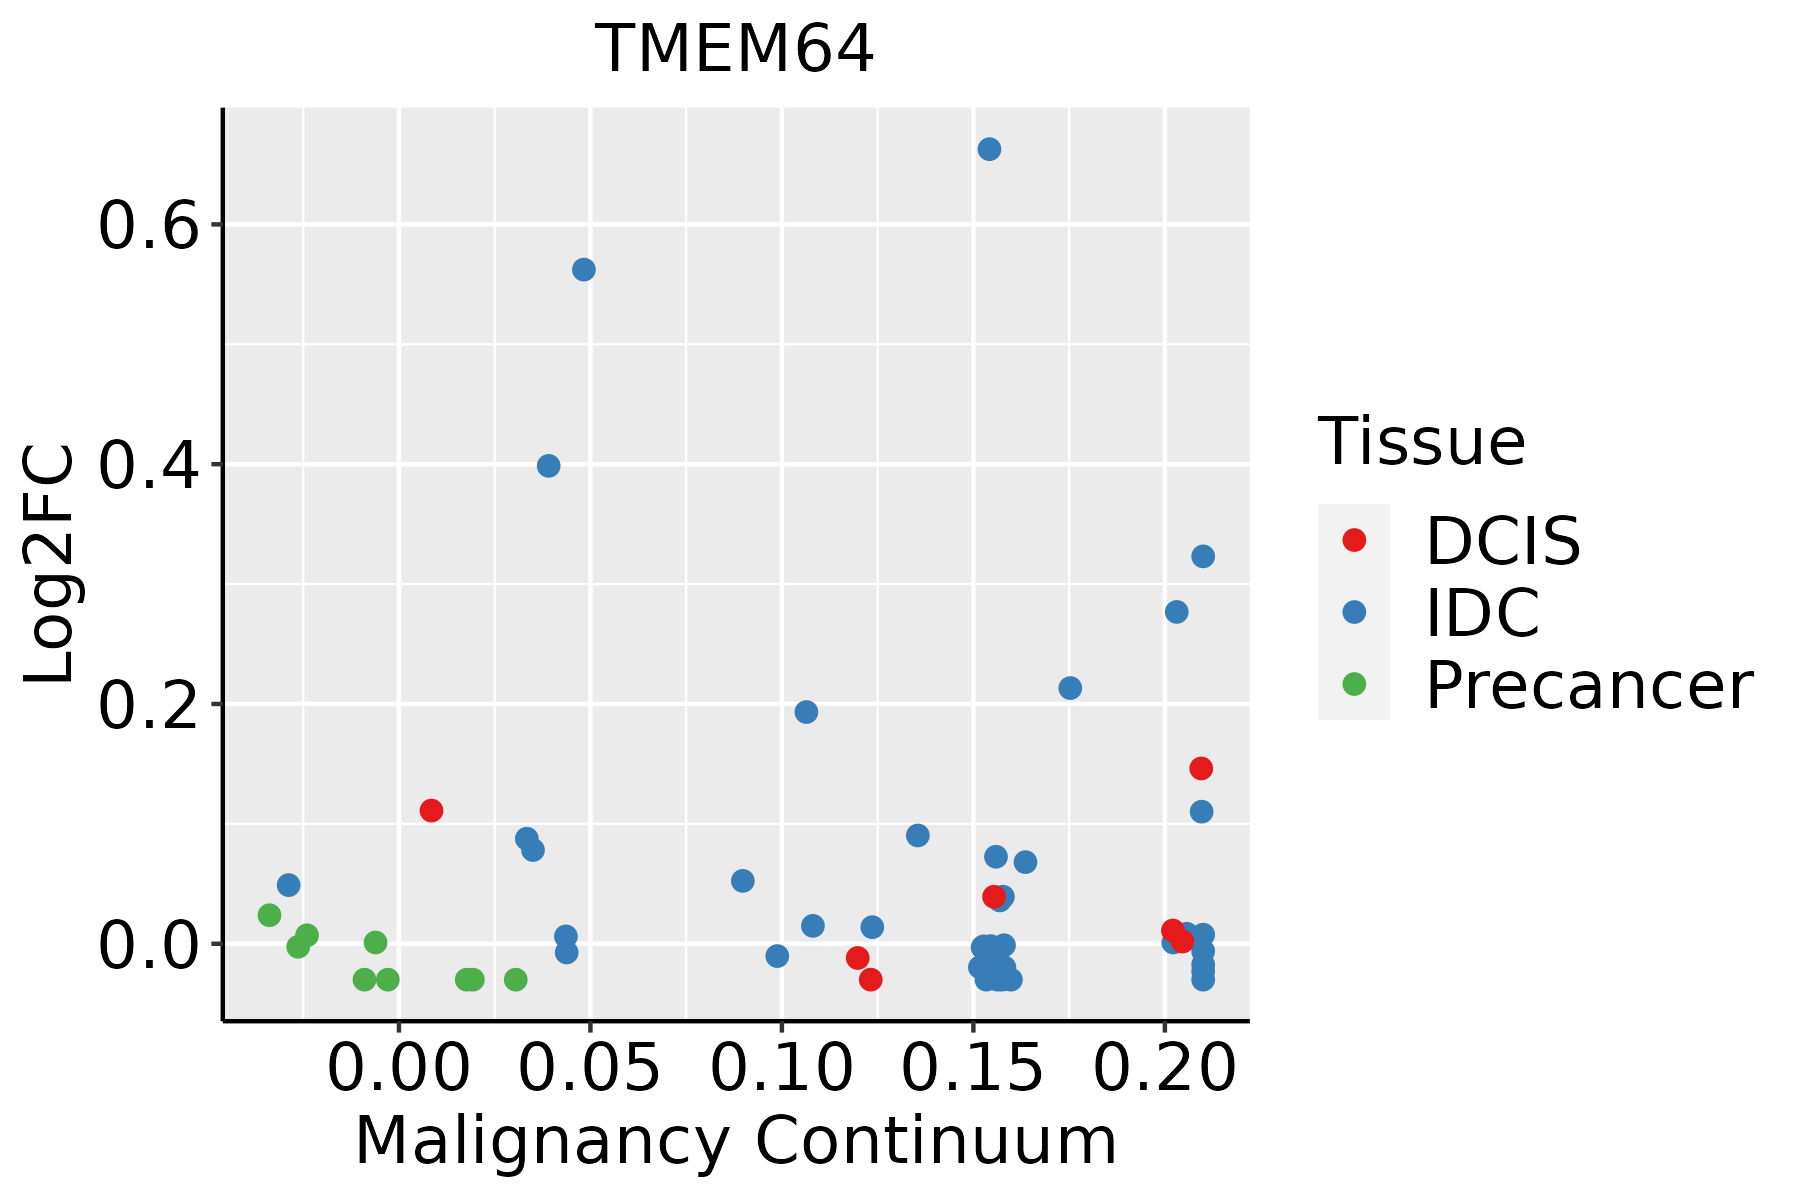 | IDC: Invasive ductal carcinoma |
| DCIS: Ductal carcinoma in situ | ||
| Precancer(BRCA1-mut): Precancerous lesion from BRCA1 mutation carriers | ||
| Esophagus | 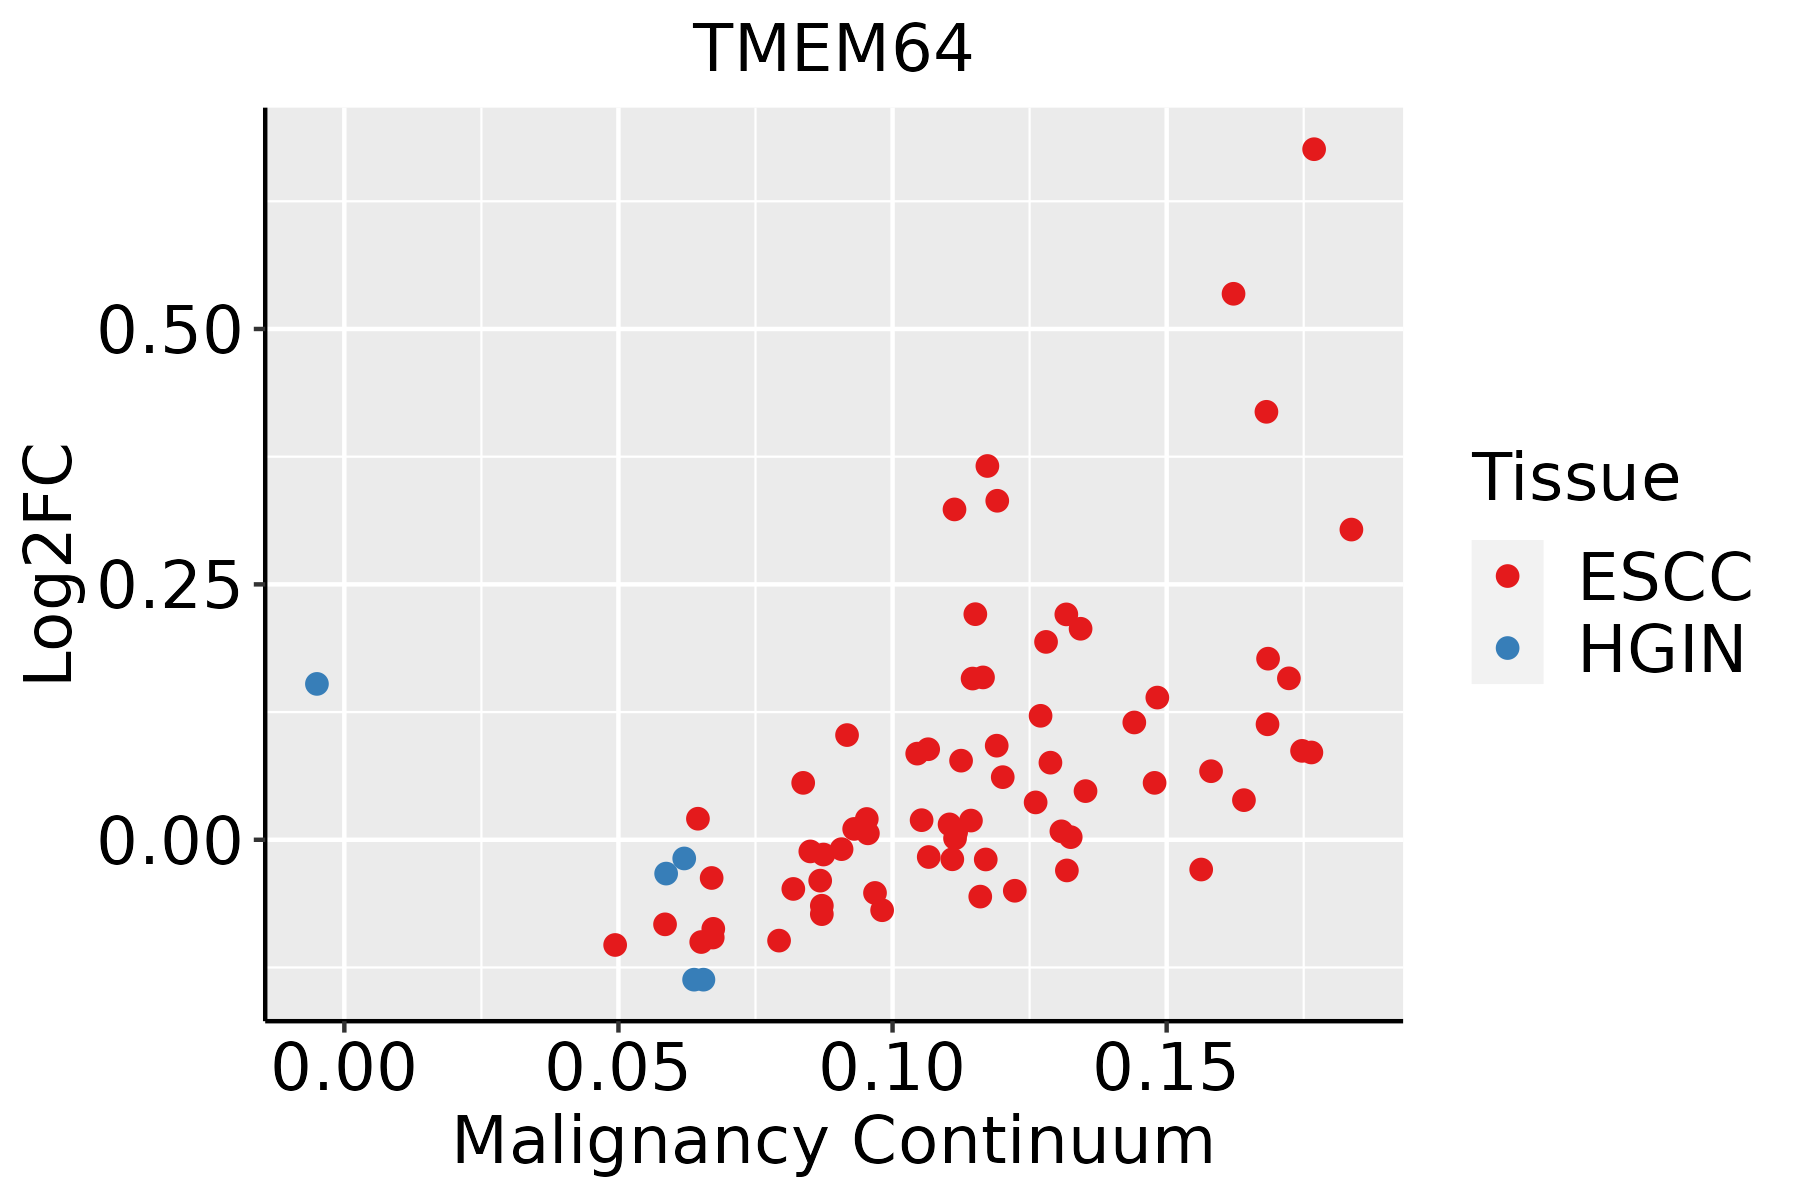 | ESCC: Esophageal squamous cell carcinoma |
| HGIN: High-grade intraepithelial neoplasias | ||
| LGIN: Low-grade intraepithelial neoplasias | ||
| Liver |  | HCC: Hepatocellular carcinoma |
| NAFLD: Non-alcoholic fatty liver disease | ||
| Oral Cavity | 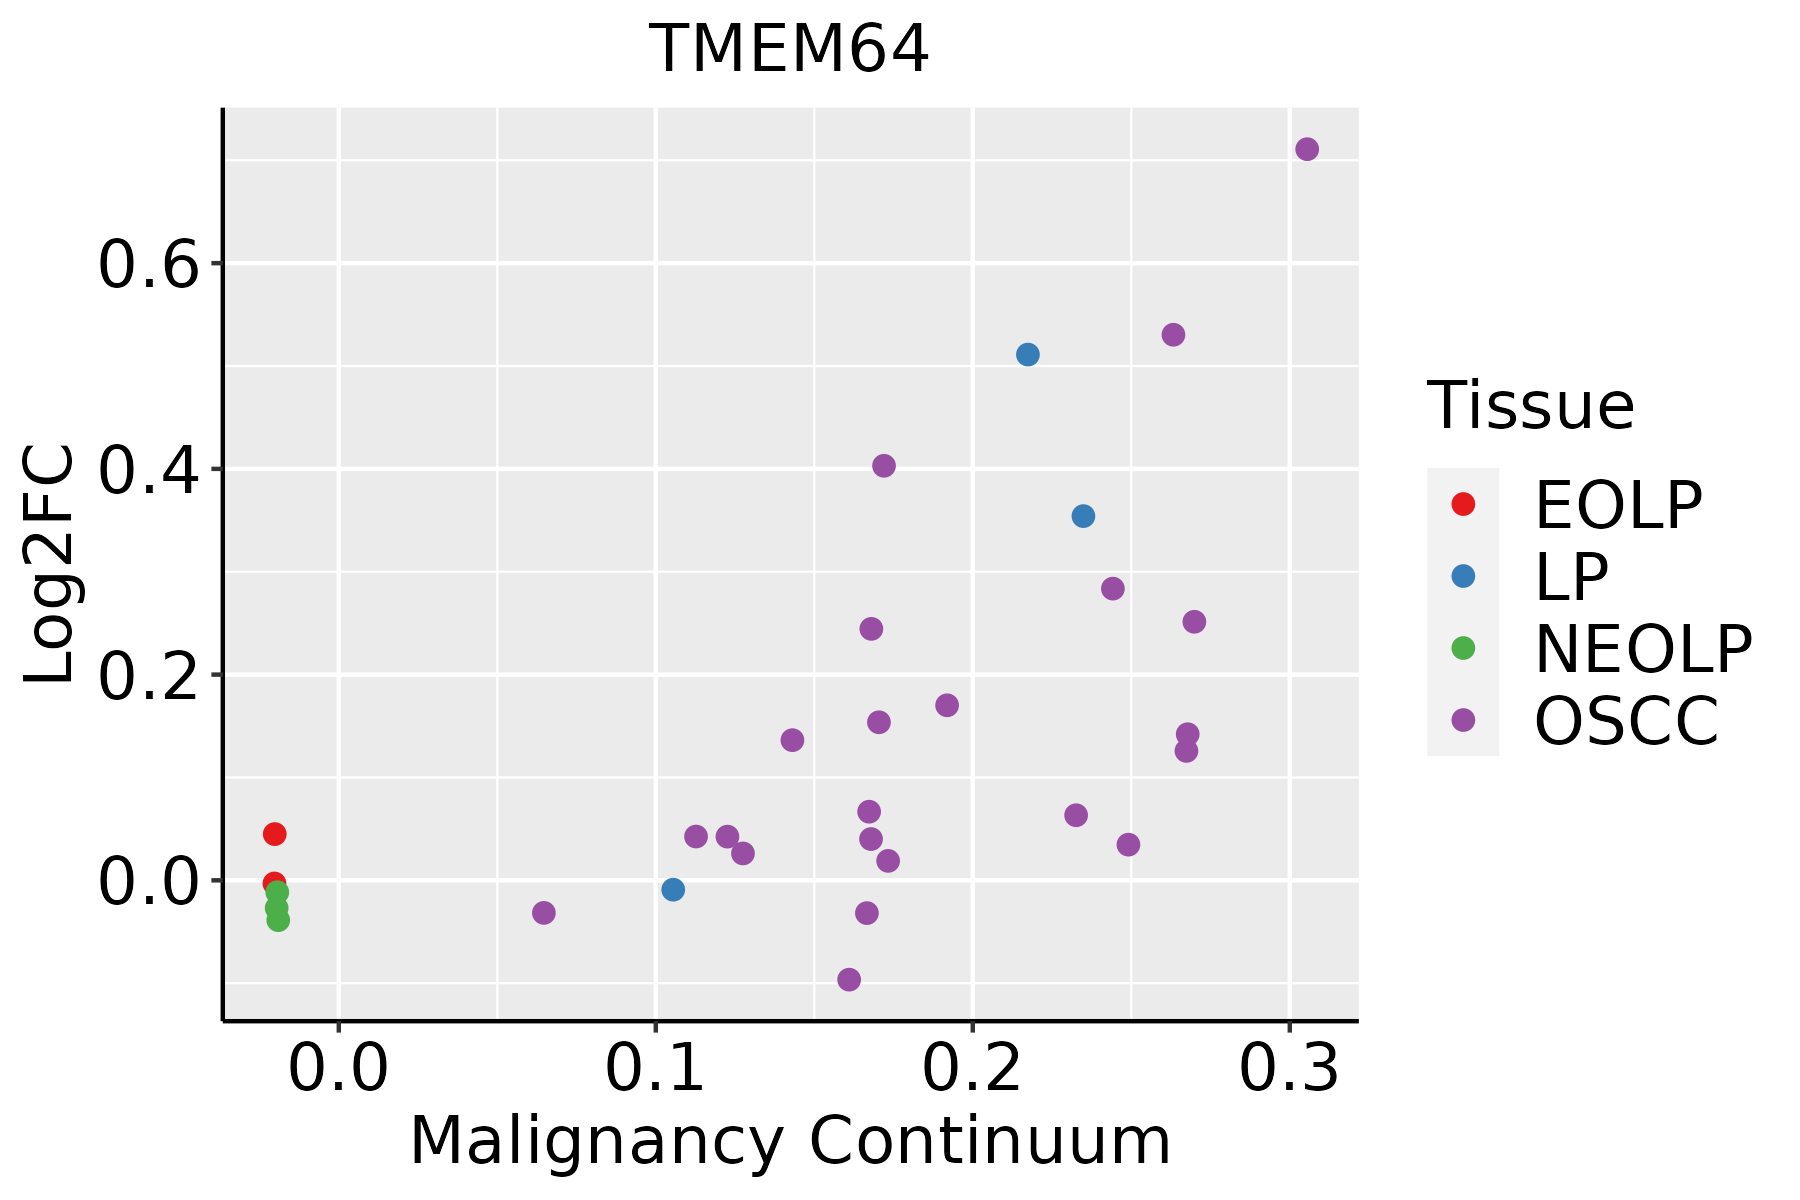 | EOLP: Erosive Oral lichen planus |
| LP: leukoplakia | ||
| NEOLP: Non-erosive oral lichen planus | ||
| OSCC: Oral squamous cell carcinoma |
| ∗log2FC in expression of this searched gene in stem-like cells from each diseased tissue sample relative to stem-like cells in normal samples in each tissue plotted against the malignancy continuum. Samples are colored based on if they are from different disease stage. |
Top |
Malignant transformation related pathway analysis |
| Find out the enriched GO biological processes and KEGG pathways involved in transition from healthy to precancer to cancer |
| Tissue | Disease Stage | Enriched GO biological Processes |
| Colorectum | AD |  |
| Colorectum | SER |  |
| Colorectum | MSS |  |
| Colorectum | MSI-H |  |
| Colorectum | FAP |  |
| ∗Top 15 enriched GO BP terms are showed in the bar plot of each disease state in each tissue. Each row represents a significant GO biological process which is colored according to the -log10(p.adjust). |
| Page: 1 2 3 4 5 6 7 8 9 |
| GO ID | Tissue | Disease Stage | Description | Gene Ratio | Bg Ratio | pvalue | p.adjust | Count |
| GO:003009914 | Breast | IDC | myeloid cell differentiation | 54/1434 | 381/18723 | 8.07e-06 | 2.39e-04 | 54 |
| GO:000257312 | Breast | IDC | myeloid leukocyte differentiation | 33/1434 | 208/18723 | 5.02e-05 | 1.09e-03 | 33 |
| GO:000164912 | Breast | IDC | osteoblast differentiation | 35/1434 | 229/18723 | 6.64e-05 | 1.35e-03 | 35 |
| GO:190370612 | Breast | IDC | regulation of hemopoiesis | 49/1434 | 367/18723 | 9.74e-05 | 1.86e-03 | 49 |
| GO:004346212 | Breast | IDC | regulation of ATPase activity | 12/1434 | 46/18723 | 1.31e-04 | 2.37e-03 | 12 |
| GO:004563714 | Breast | IDC | regulation of myeloid cell differentiation | 32/1434 | 210/18723 | 1.41e-04 | 2.50e-03 | 32 |
| GO:000150311 | Breast | IDC | ossification | 50/1434 | 408/18723 | 6.51e-04 | 8.04e-03 | 50 |
| GO:004563912 | Breast | IDC | positive regulation of myeloid cell differentiation | 18/1434 | 103/18723 | 7.77e-04 | 9.37e-03 | 18 |
| GO:190210511 | Breast | IDC | regulation of leukocyte differentiation | 36/1434 | 279/18723 | 1.44e-03 | 1.47e-02 | 36 |
| GO:000189413 | Breast | IDC | tissue homeostasis | 34/1434 | 268/18723 | 2.54e-03 | 2.28e-02 | 34 |
| GO:004544412 | Breast | IDC | fat cell differentiation | 30/1434 | 229/18723 | 2.72e-03 | 2.41e-02 | 30 |
| GO:004560011 | Breast | IDC | positive regulation of fat cell differentiation | 12/1434 | 66/18723 | 3.99e-03 | 3.23e-02 | 12 |
| GO:000276111 | Breast | IDC | regulation of myeloid leukocyte differentiation | 18/1434 | 120/18723 | 4.48e-03 | 3.47e-02 | 18 |
| GO:003009924 | Breast | DCIS | myeloid cell differentiation | 55/1390 | 381/18723 | 1.50e-06 | 5.68e-05 | 55 |
| GO:000257321 | Breast | DCIS | myeloid leukocyte differentiation | 34/1390 | 208/18723 | 1.08e-05 | 2.83e-04 | 34 |
| GO:004563722 | Breast | DCIS | regulation of myeloid cell differentiation | 34/1390 | 210/18723 | 1.33e-05 | 3.32e-04 | 34 |
| GO:190370622 | Breast | DCIS | regulation of hemopoiesis | 50/1390 | 367/18723 | 2.21e-05 | 5.23e-04 | 50 |
| GO:004346221 | Breast | DCIS | regulation of ATPase activity | 12/1390 | 46/18723 | 9.70e-05 | 1.78e-03 | 12 |
| GO:004563921 | Breast | DCIS | positive regulation of myeloid cell differentiation | 19/1390 | 103/18723 | 1.86e-04 | 3.03e-03 | 19 |
| GO:000164921 | Breast | DCIS | osteoblast differentiation | 32/1390 | 229/18723 | 4.00e-04 | 5.48e-03 | 32 |
| Page: 1 2 3 4 5 |
| Pathway ID | Tissue | Disease Stage | Description | Gene Ratio | Bg Ratio | pvalue | p.adjust | qvalue | Count |
| Page: 1 |
Top |
Cell-cell communication analysis |
| Identification of potential cell-cell interactions between two cell types and their ligand-receptor pairs for different disease states |
| Ligand | Receptor | LRpair | Pathway | Tissue | Disease Stage |
| Page: 1 |
Top |
Single-cell gene regulatory network inference analysis |
| Find out the significant the regulons (TFs) and the target genes of each regulon across cell types for different disease states |
| TF | Cell Type | Tissue | Disease Stage | Target Gene | RSS | Regulon Activity |
| ∗The dot plots of a searched regulon are shown for all cell subpopulations in each disease state of each tissue based on the regulon specific score inferred using pySCENIC and by calculating the average expression. |
| Page: 1 |
Top |
Somatic mutation of malignant transformation related genes |
| Annotation of somatic variants for genes involved in malignant transformation |
| Hugo Symbol | Variant Class | Variant Classification | dbSNP RS | HGVSc | HGVSp | HGVSp Short | SWISSPROT | BIOTYPE | SIFT | PolyPhen | Tumor Sample Barcode | Tissue | Histology | Sex | Age | Stage | Therapy Types | Drugs | Outcome |
| TMEM64 | SNV | Missense_Mutation | rs749307686 | c.992N>A | p.Arg331Gln | p.R331Q | Q6YI46 | protein_coding | deleterious(0) | possibly_damaging(0.548) | TCGA-AN-A046-01 | Breast | breast invasive carcinoma | Female | >=65 | I/II | Unknown | Unknown | SD |
| TMEM64 | SNV | Missense_Mutation | novel | c.463N>C | p.Asp155His | p.D155H | Q6YI46 | protein_coding | deleterious(0) | possibly_damaging(0.503) | TCGA-AN-A0AM-01 | Breast | breast invasive carcinoma | Female | <65 | I/II | Unknown | Unknown | SD |
| TMEM64 | SNV | Missense_Mutation | c.1009N>T | p.Asn337Tyr | p.N337Y | Q6YI46 | protein_coding | deleterious(0) | probably_damaging(0.986) | TCGA-E9-A1RF-01 | Breast | breast invasive carcinoma | Female | >=65 | III/IV | Hormone Therapy | tamoxiphen | SD | |
| TMEM64 | SNV | Missense_Mutation | novel | c.413N>T | p.Ala138Val | p.A138V | Q6YI46 | protein_coding | tolerated(0.33) | benign(0.438) | TCGA-5M-AAT6-01 | Colorectum | colon adenocarcinoma | Female | <65 | III/IV | Unknown | Unknown | PD |
| TMEM64 | SNV | Missense_Mutation | c.599N>C | p.Val200Ala | p.V200A | Q6YI46 | protein_coding | deleterious(0.04) | benign(0.046) | TCGA-AA-3663-01 | Colorectum | colon adenocarcinoma | Male | <65 | I/II | Unknown | Unknown | SD | |
| TMEM64 | SNV | Missense_Mutation | rs373266981 | c.836N>T | p.Ser279Leu | p.S279L | Q6YI46 | protein_coding | tolerated(0.27) | probably_damaging(0.998) | TCGA-CA-6718-01 | Colorectum | colon adenocarcinoma | Male | <65 | I/II | Unknown | Unknown | PD |
| TMEM64 | SNV | Missense_Mutation | c.541C>T | p.Leu181Phe | p.L181F | Q6YI46 | protein_coding | deleterious(0.03) | probably_damaging(0.999) | TCGA-CM-5861-01 | Colorectum | colon adenocarcinoma | Female | <65 | I/II | Unknown | Unknown | PD | |
| TMEM64 | SNV | Missense_Mutation | rs747707548 | c.889C>T | p.Arg297Trp | p.R297W | Q6YI46 | protein_coding | deleterious(0) | probably_damaging(0.999) | TCGA-CM-6162-01 | Colorectum | colon adenocarcinoma | Female | <65 | III/IV | Chemotherapy | oxaliplatin | SD |
| TMEM64 | SNV | Missense_Mutation | novel | c.412N>A | p.Ala138Thr | p.A138T | Q6YI46 | protein_coding | tolerated(0.19) | benign(0.137) | TCGA-F4-6570-01 | Colorectum | colon adenocarcinoma | Female | >=65 | I/II | Unknown | Unknown | SD |
| TMEM64 | SNV | Missense_Mutation | c.976N>C | p.Phe326Leu | p.F326L | Q6YI46 | protein_coding | tolerated(0.12) | benign(0.023) | TCGA-G4-6314-01 | Colorectum | colon adenocarcinoma | Female | >=65 | III/IV | Ancillary | leucovorin | SD |
| Page: 1 2 3 4 |
Top |
Related drugs of malignant transformation related genes |
| Identification of chemicals and drugs interact with genes involved in malignant transfromation |
| (DGIdb 4.0) |
| Entrez ID | Symbol | Category | Interaction Types | Drug Claim Name | Drug Name | PMIDs |
| Page: 1 |

Copyright 2023-Present -The University of Texas Health Science Center at Houston |