
|
|||||
|
 | |
| |
| |
| |
| |
| |
|
Gene: TMEM63A |
Gene summary for TMEM63A |
| Gene information | Species | Human | Gene symbol | TMEM63A | Gene ID | 9725 |
| Gene name | transmembrane protein 63A | |
| Gene Alias | HLD19 | |
| Cytomap | 1q42.12 | |
| Gene Type | protein-coding | GO ID | GO:0006810 | UniProtAcc | A0A024R3T3 |
Top |
Malignant transformation analysis |
| Identification of the aberrant gene expression in precancerous and cancerous lesions by comparing the gene expression of stem-like cells in diseased tissues with normal stem cells |
| Entrez ID | Symbol | Replicates | Species | Organ | Tissue | Adj P-value | Log2FC | Malignancy |
| 9725 | TMEM63A | HTA11_3410_2000001011 | Human | Colorectum | AD | 4.65e-02 | -1.88e-01 | 0.0155 |
| 9725 | TMEM63A | HTA11_866_3004761011 | Human | Colorectum | AD | 4.21e-02 | 3.68e-01 | 0.096 |
| 9725 | TMEM63A | HTA11_10711_2000001011 | Human | Colorectum | AD | 9.08e-03 | 4.21e-01 | 0.0338 |
| 9725 | TMEM63A | HTA11_7696_3000711011 | Human | Colorectum | AD | 3.94e-08 | 5.62e-01 | 0.0674 |
| 9725 | TMEM63A | HTA11_99999965062_69753 | Human | Colorectum | MSI-H | 1.47e-02 | 9.66e-01 | 0.3487 |
| 9725 | TMEM63A | HTA11_99999965104_69814 | Human | Colorectum | MSS | 1.88e-08 | 7.20e-01 | 0.281 |
| 9725 | TMEM63A | F007 | Human | Colorectum | FAP | 2.86e-02 | -1.91e-01 | 0.1176 |
| 9725 | TMEM63A | A015-C-203 | Human | Colorectum | FAP | 3.37e-21 | -1.92e-01 | -0.1294 |
| 9725 | TMEM63A | A015-C-204 | Human | Colorectum | FAP | 1.68e-04 | -1.37e-01 | -0.0228 |
| 9725 | TMEM63A | A014-C-040 | Human | Colorectum | FAP | 3.28e-03 | 1.54e-01 | -0.1184 |
| 9725 | TMEM63A | A002-C-201 | Human | Colorectum | FAP | 2.14e-12 | -2.47e-01 | 0.0324 |
| 9725 | TMEM63A | A002-C-203 | Human | Colorectum | FAP | 4.81e-02 | 4.17e-03 | 0.2786 |
| 9725 | TMEM63A | A001-C-119 | Human | Colorectum | FAP | 1.51e-08 | 2.42e-01 | -0.1557 |
| 9725 | TMEM63A | A001-C-108 | Human | Colorectum | FAP | 3.12e-14 | 6.62e-02 | -0.0272 |
| 9725 | TMEM63A | A002-C-021 | Human | Colorectum | FAP | 2.92e-02 | 2.53e-01 | 0.1171 |
| 9725 | TMEM63A | A002-C-205 | Human | Colorectum | FAP | 1.79e-19 | -5.96e-02 | -0.1236 |
| 9725 | TMEM63A | A001-C-104 | Human | Colorectum | FAP | 5.46e-03 | 2.02e-01 | 0.0184 |
| 9725 | TMEM63A | A015-C-005 | Human | Colorectum | FAP | 3.17e-02 | 1.28e-01 | -0.0336 |
| 9725 | TMEM63A | A015-C-006 | Human | Colorectum | FAP | 1.66e-14 | -1.95e-02 | -0.0994 |
| 9725 | TMEM63A | A015-C-106 | Human | Colorectum | FAP | 8.64e-09 | 6.51e-02 | -0.0511 |
| Page: 1 2 3 4 5 6 |
| Tissue | Expression Dynamics | Abbreviation |
| Colorectum (GSE201348) | 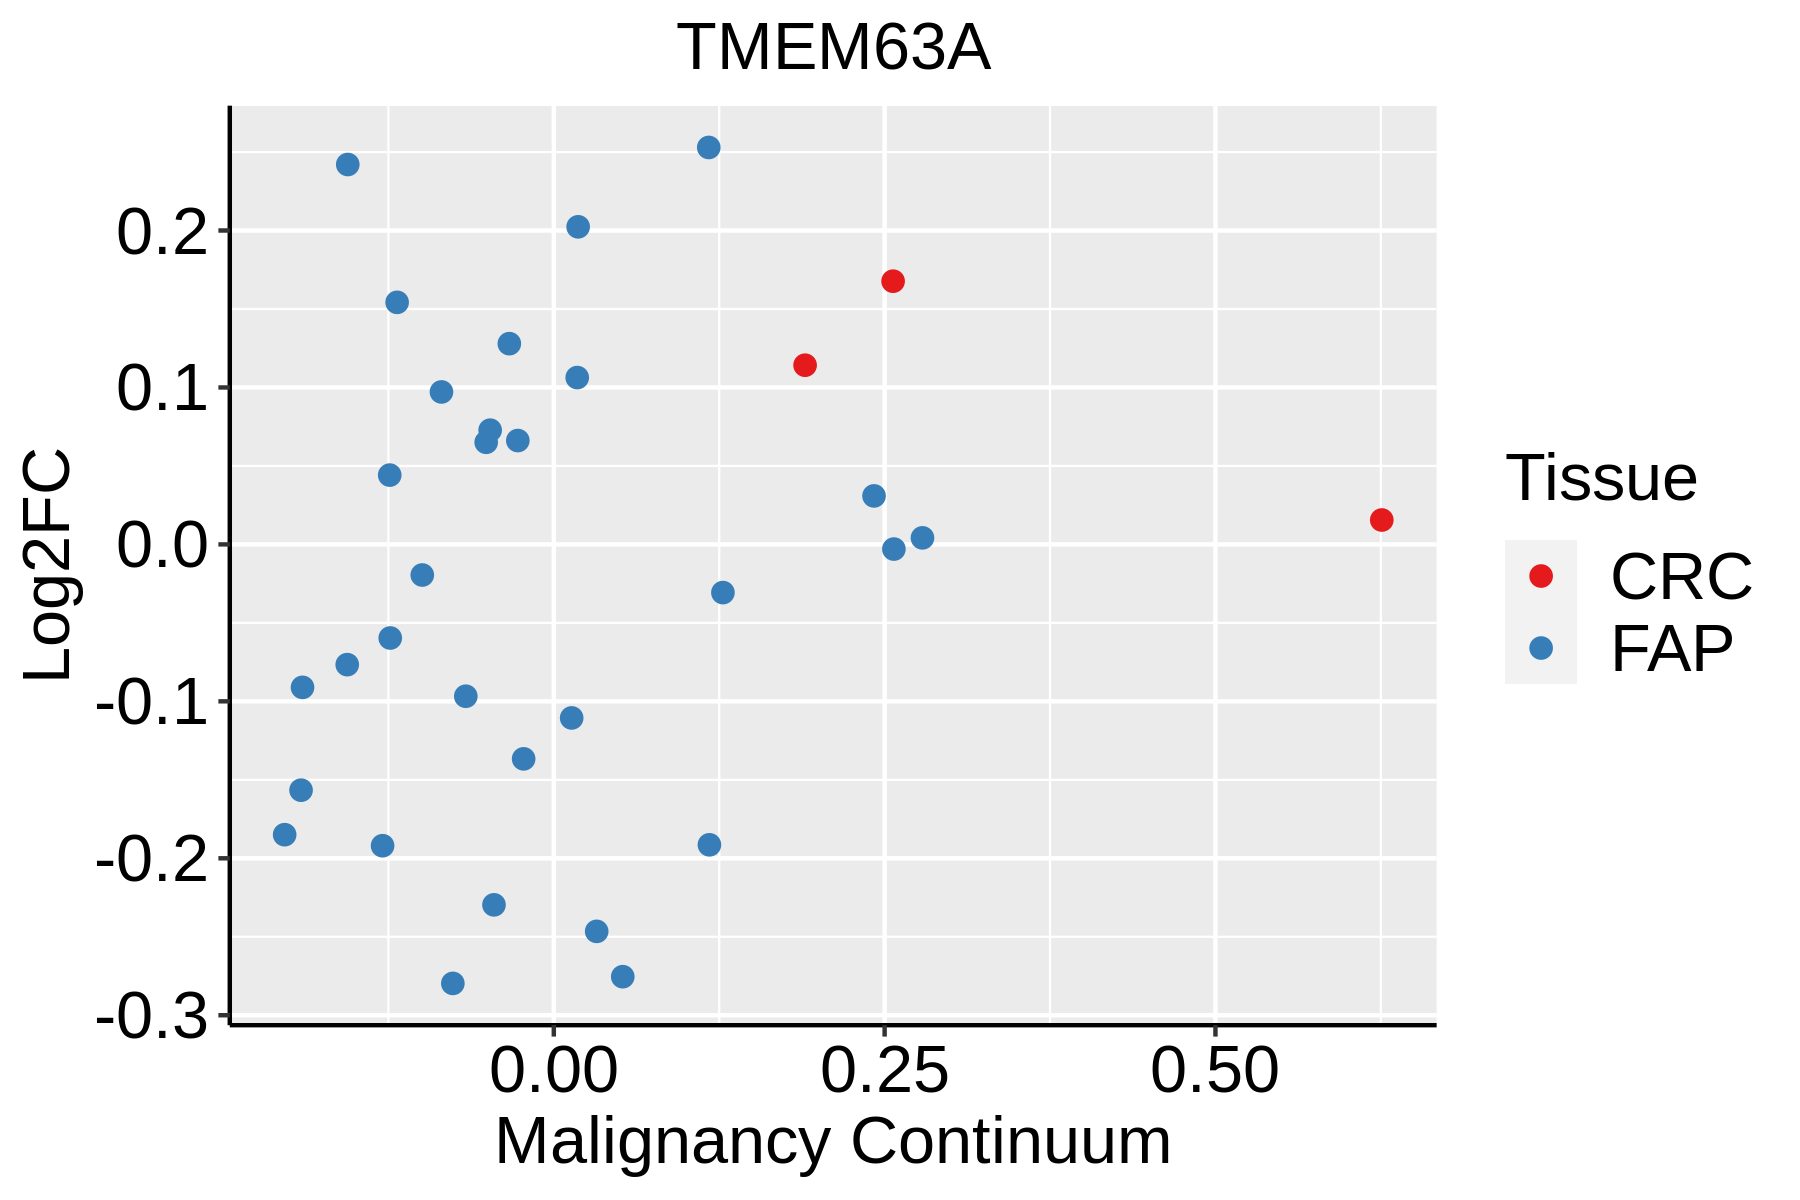 | FAP: Familial adenomatous polyposis |
| CRC: Colorectal cancer | ||
| Colorectum (HTA11) |  | AD: Adenomas |
| SER: Sessile serrated lesions | ||
| MSI-H: Microsatellite-high colorectal cancer | ||
| MSS: Microsatellite stable colorectal cancer | ||
| Esophagus | 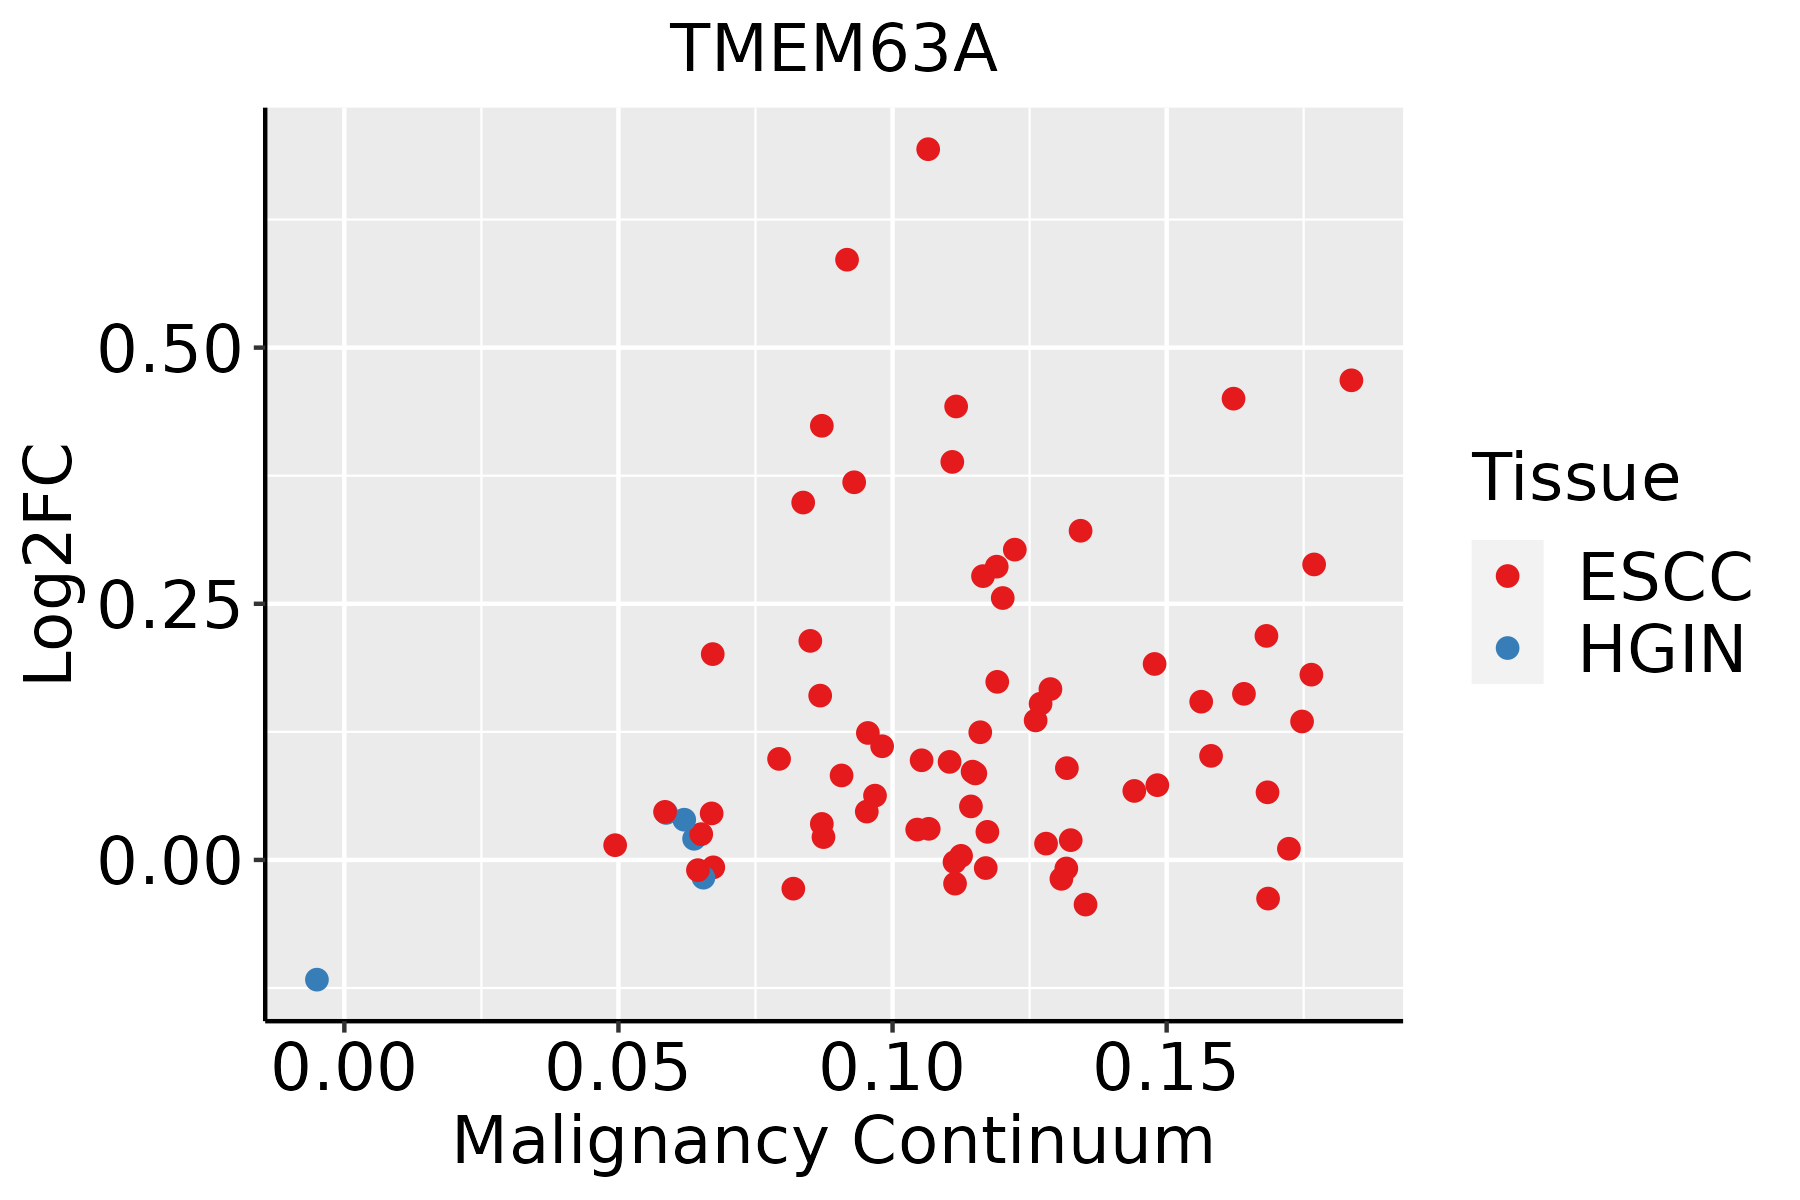 | ESCC: Esophageal squamous cell carcinoma |
| HGIN: High-grade intraepithelial neoplasias | ||
| LGIN: Low-grade intraepithelial neoplasias | ||
| Liver | 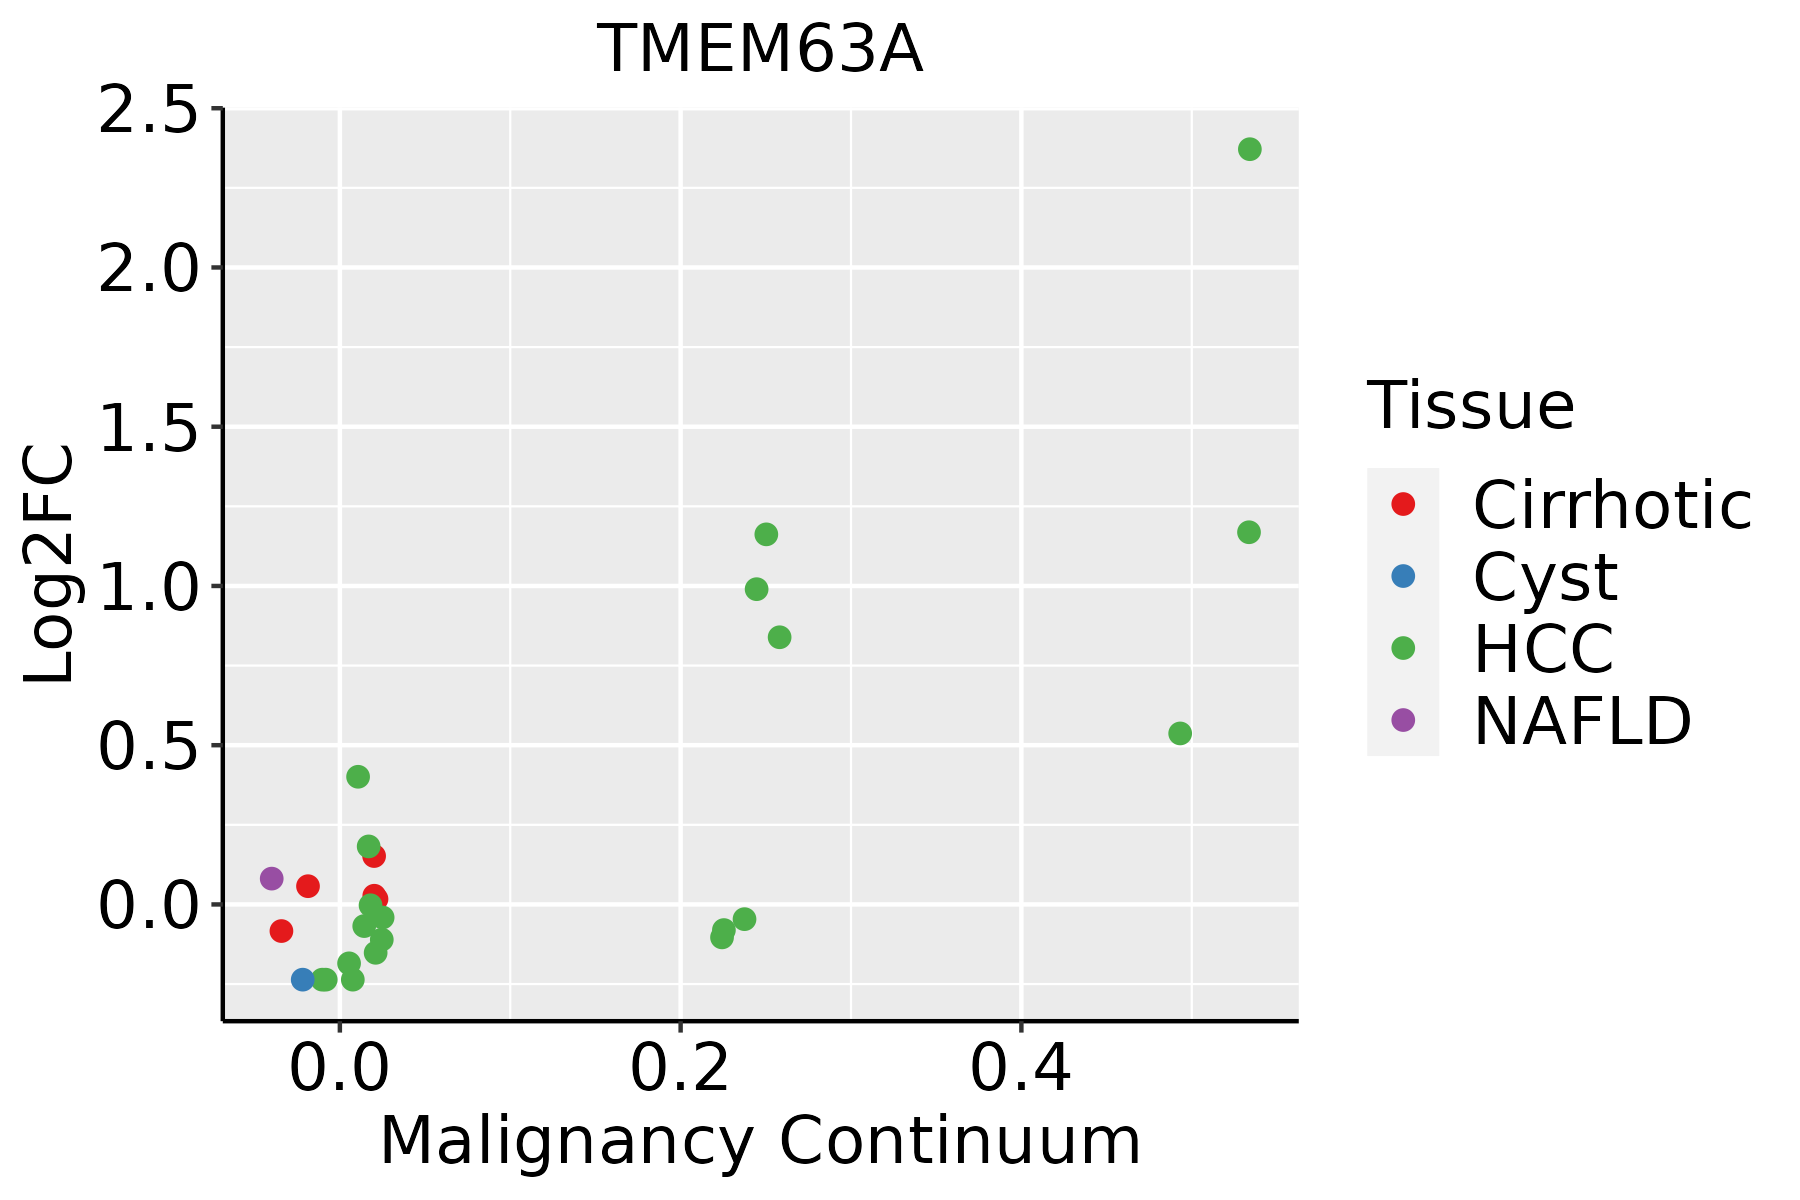 | HCC: Hepatocellular carcinoma |
| NAFLD: Non-alcoholic fatty liver disease | ||
| Oral Cavity |  | EOLP: Erosive Oral lichen planus |
| LP: leukoplakia | ||
| NEOLP: Non-erosive oral lichen planus | ||
| OSCC: Oral squamous cell carcinoma |
| ∗log2FC in expression of this searched gene in stem-like cells from each diseased tissue sample relative to stem-like cells in normal samples in each tissue plotted against the malignancy continuum. Samples are colored based on if they are from different disease stage. |
Top |
Malignant transformation related pathway analysis |
| Find out the enriched GO biological processes and KEGG pathways involved in transition from healthy to precancer to cancer |
| Tissue | Disease Stage | Enriched GO biological Processes |
| Colorectum | AD |  |
| Colorectum | SER |  |
| Colorectum | MSS |  |
| Colorectum | MSI-H |  |
| Colorectum | FAP |  |
| ∗Top 15 enriched GO BP terms are showed in the bar plot of each disease state in each tissue. Each row represents a significant GO biological process which is colored according to the -log10(p.adjust). |
| Page: 1 2 3 4 5 6 7 8 9 |
| GO ID | Tissue | Disease Stage | Description | Gene Ratio | Bg Ratio | pvalue | p.adjust | Count |
| Page: 1 |
| Pathway ID | Tissue | Disease Stage | Description | Gene Ratio | Bg Ratio | pvalue | p.adjust | qvalue | Count |
| Page: 1 |
Top |
Cell-cell communication analysis |
| Identification of potential cell-cell interactions between two cell types and their ligand-receptor pairs for different disease states |
| Ligand | Receptor | LRpair | Pathway | Tissue | Disease Stage |
| Page: 1 |
Top |
Single-cell gene regulatory network inference analysis |
| Find out the significant the regulons (TFs) and the target genes of each regulon across cell types for different disease states |
| TF | Cell Type | Tissue | Disease Stage | Target Gene | RSS | Regulon Activity |
| ∗The dot plots of a searched regulon are shown for all cell subpopulations in each disease state of each tissue based on the regulon specific score inferred using pySCENIC and by calculating the average expression. |
| Page: 1 |
Top |
Somatic mutation of malignant transformation related genes |
| Annotation of somatic variants for genes involved in malignant transformation |
| Hugo Symbol | Variant Class | Variant Classification | dbSNP RS | HGVSc | HGVSp | HGVSp Short | SWISSPROT | BIOTYPE | SIFT | PolyPhen | Tumor Sample Barcode | Tissue | Histology | Sex | Age | Stage | Therapy Types | Drugs | Outcome |
| TMEM63A | SNV | Missense_Mutation | novel | c.1096G>T | p.Asp366Tyr | p.D366Y | O94886 | protein_coding | deleterious(0) | probably_damaging(0.99) | TCGA-AN-A046-01 | Breast | breast invasive carcinoma | Female | >=65 | I/II | Unknown | Unknown | SD |
| TMEM63A | SNV | Missense_Mutation | rs376648031 | c.2086G>A | p.Ala696Thr | p.A696T | O94886 | protein_coding | tolerated(1) | benign(0) | TCGA-BH-A18G-01 | Breast | breast invasive carcinoma | Female | >=65 | I/II | Unknown | Unknown | SD |
| TMEM63A | SNV | Missense_Mutation | rs760750326 | c.1751N>A | p.Arg584His | p.R584H | O94886 | protein_coding | deleterious(0) | probably_damaging(0.998) | TCGA-D8-A1Y1-01 | Breast | breast invasive carcinoma | Female | >=65 | III/IV | Hormone Therapy | tamoxiphen | PD |
| TMEM63A | insertion | Nonsense_Mutation | novel | c.975_976insTCTGAGAGAATAATTGTTCCCTCTGAGCTCTTGGGGACCTAAG | p.Arg326SerfsTer14 | p.R326Sfs*14 | O94886 | protein_coding | TCGA-AO-A0J9-01 | Breast | breast invasive carcinoma | Female | <65 | III/IV | Chemotherapy | cyclophosphamide | PD | ||
| TMEM63A | insertion | Frame_Shift_Ins | novel | c.790_791insGCAA | p.Tyr264CysfsTer18 | p.Y264Cfs*18 | O94886 | protein_coding | TCGA-BH-A0B1-01 | Breast | breast invasive carcinoma | Female | >=65 | I/II | Chemotherapy | adriamycin | SD | ||
| TMEM63A | insertion | In_Frame_Ins | novel | c.789_790insAAGTGTCAGAGCCTTCAG | p.Cys263_Tyr264insLysCysGlnSerLeuGln | p.C263_Y264insKCQSLQ | O94886 | protein_coding | TCGA-BH-A0B1-01 | Breast | breast invasive carcinoma | Female | >=65 | I/II | Chemotherapy | adriamycin | SD | ||
| TMEM63A | deletion | Frame_Shift_Del | c.505delG | p.Asp169ThrfsTer15 | p.D169Tfs*15 | O94886 | protein_coding | TCGA-D8-A27V-01 | Breast | breast invasive carcinoma | Female | <65 | I/II | Hormone Therapy | tamoxiphen | SD | |||
| TMEM63A | SNV | Missense_Mutation | novel | c.1523T>C | p.Ile508Thr | p.I508T | O94886 | protein_coding | tolerated(0.47) | benign(0.124) | TCGA-2W-A8YY-01 | Cervix | cervical & endocervical cancer | Female | <65 | I/II | Chemotherapy | cisplatin | CR |
| TMEM63A | SNV | Missense_Mutation | novel | c.2362C>A | p.Pro788Thr | p.P788T | O94886 | protein_coding | tolerated(0.53) | benign(0.025) | TCGA-MA-AA42-01 | Cervix | cervical & endocervical cancer | Female | >=65 | I/II | Unknown | Unknown | SD |
| TMEM63A | SNV | Missense_Mutation | rs753026260 | c.1474C>T | p.His492Tyr | p.H492Y | O94886 | protein_coding | deleterious(0) | probably_damaging(0.997) | TCGA-UC-A7PG-06 | Cervix | cervical & endocervical cancer | Female | <65 | III/IV | Chemotherapy | cisplatin | PD |
| Page: 1 2 3 4 5 6 7 8 |
Top |
Related drugs of malignant transformation related genes |
| Identification of chemicals and drugs interact with genes involved in malignant transfromation |
| (DGIdb 4.0) |
| Entrez ID | Symbol | Category | Interaction Types | Drug Claim Name | Drug Name | PMIDs |
| Page: 1 |

Copyright 2023-Present -The University of Texas Health Science Center at Houston |