
|
|||||
|
 | |
| |
| |
| |
| |
| |
|
Gene: TMEM54 |
Gene summary for TMEM54 |
| Gene information | Species | Human | Gene symbol | TMEM54 | Gene ID | 113452 |
| Gene name | transmembrane protein 54 | |
| Gene Alias | BCLP | |
| Cytomap | 1p35.1 | |
| Gene Type | protein-coding | GO ID | GO:0008150 | UniProtAcc | Q969K7 |
Top |
Malignant transformation analysis |
| Identification of the aberrant gene expression in precancerous and cancerous lesions by comparing the gene expression of stem-like cells in diseased tissues with normal stem cells |
| Entrez ID | Symbol | Replicates | Species | Organ | Tissue | Adj P-value | Log2FC | Malignancy |
| 113452 | TMEM54 | GSM4909281 | Human | Breast | IDC | 2.94e-17 | 6.39e-01 | 0.21 |
| 113452 | TMEM54 | GSM4909282 | Human | Breast | IDC | 2.35e-24 | 7.17e-01 | -0.0288 |
| 113452 | TMEM54 | GSM4909286 | Human | Breast | IDC | 2.17e-22 | 6.80e-01 | 0.1081 |
| 113452 | TMEM54 | GSM4909291 | Human | Breast | IDC | 1.02e-02 | 3.36e-01 | 0.1753 |
| 113452 | TMEM54 | GSM4909296 | Human | Breast | IDC | 4.10e-05 | -1.26e-01 | 0.1524 |
| 113452 | TMEM54 | GSM4909297 | Human | Breast | IDC | 1.52e-09 | 2.62e-01 | 0.1517 |
| 113452 | TMEM54 | GSM4909311 | Human | Breast | IDC | 2.00e-17 | -3.71e-02 | 0.1534 |
| 113452 | TMEM54 | GSM4909312 | Human | Breast | IDC | 1.18e-04 | 1.53e-01 | 0.1552 |
| 113452 | TMEM54 | GSM4909319 | Human | Breast | IDC | 6.20e-21 | -1.07e-01 | 0.1563 |
| 113452 | TMEM54 | GSM4909321 | Human | Breast | IDC | 6.01e-07 | 8.32e-02 | 0.1559 |
| 113452 | TMEM54 | P1 | Human | Breast | IDC | 7.91e-07 | -1.60e-01 | 0.1527 |
| 113452 | TMEM54 | DCIS2 | Human | Breast | DCIS | 2.31e-63 | 2.86e-01 | 0.0085 |
| 113452 | TMEM54 | CA_HPV_1 | Human | Cervix | CC | 1.93e-03 | -1.32e-01 | 0.0264 |
| 113452 | TMEM54 | CA_HPV_3 | Human | Cervix | CC | 2.39e-03 | 1.86e-01 | 0.0414 |
| 113452 | TMEM54 | HSIL_HPV_2 | Human | Cervix | HSIL_HPV | 2.27e-09 | 3.78e-01 | 0.0208 |
| 113452 | TMEM54 | Tumor | Human | Cervix | CC | 6.28e-51 | 8.74e-01 | 0.1241 |
| 113452 | TMEM54 | sample3 | Human | Cervix | CC | 8.06e-59 | 8.75e-01 | 0.1387 |
| 113452 | TMEM54 | T3 | Human | Cervix | CC | 3.50e-52 | 8.22e-01 | 0.1389 |
| 113452 | TMEM54 | HTA11_2487_2000001011 | Human | Colorectum | SER | 4.35e-20 | 1.08e+00 | -0.1808 |
| 113452 | TMEM54 | HTA11_1938_2000001011 | Human | Colorectum | AD | 7.99e-03 | 2.84e-01 | -0.0811 |
| Page: 1 2 3 4 5 6 7 8 9 10 |
| Tissue | Expression Dynamics | Abbreviation |
| Breast | 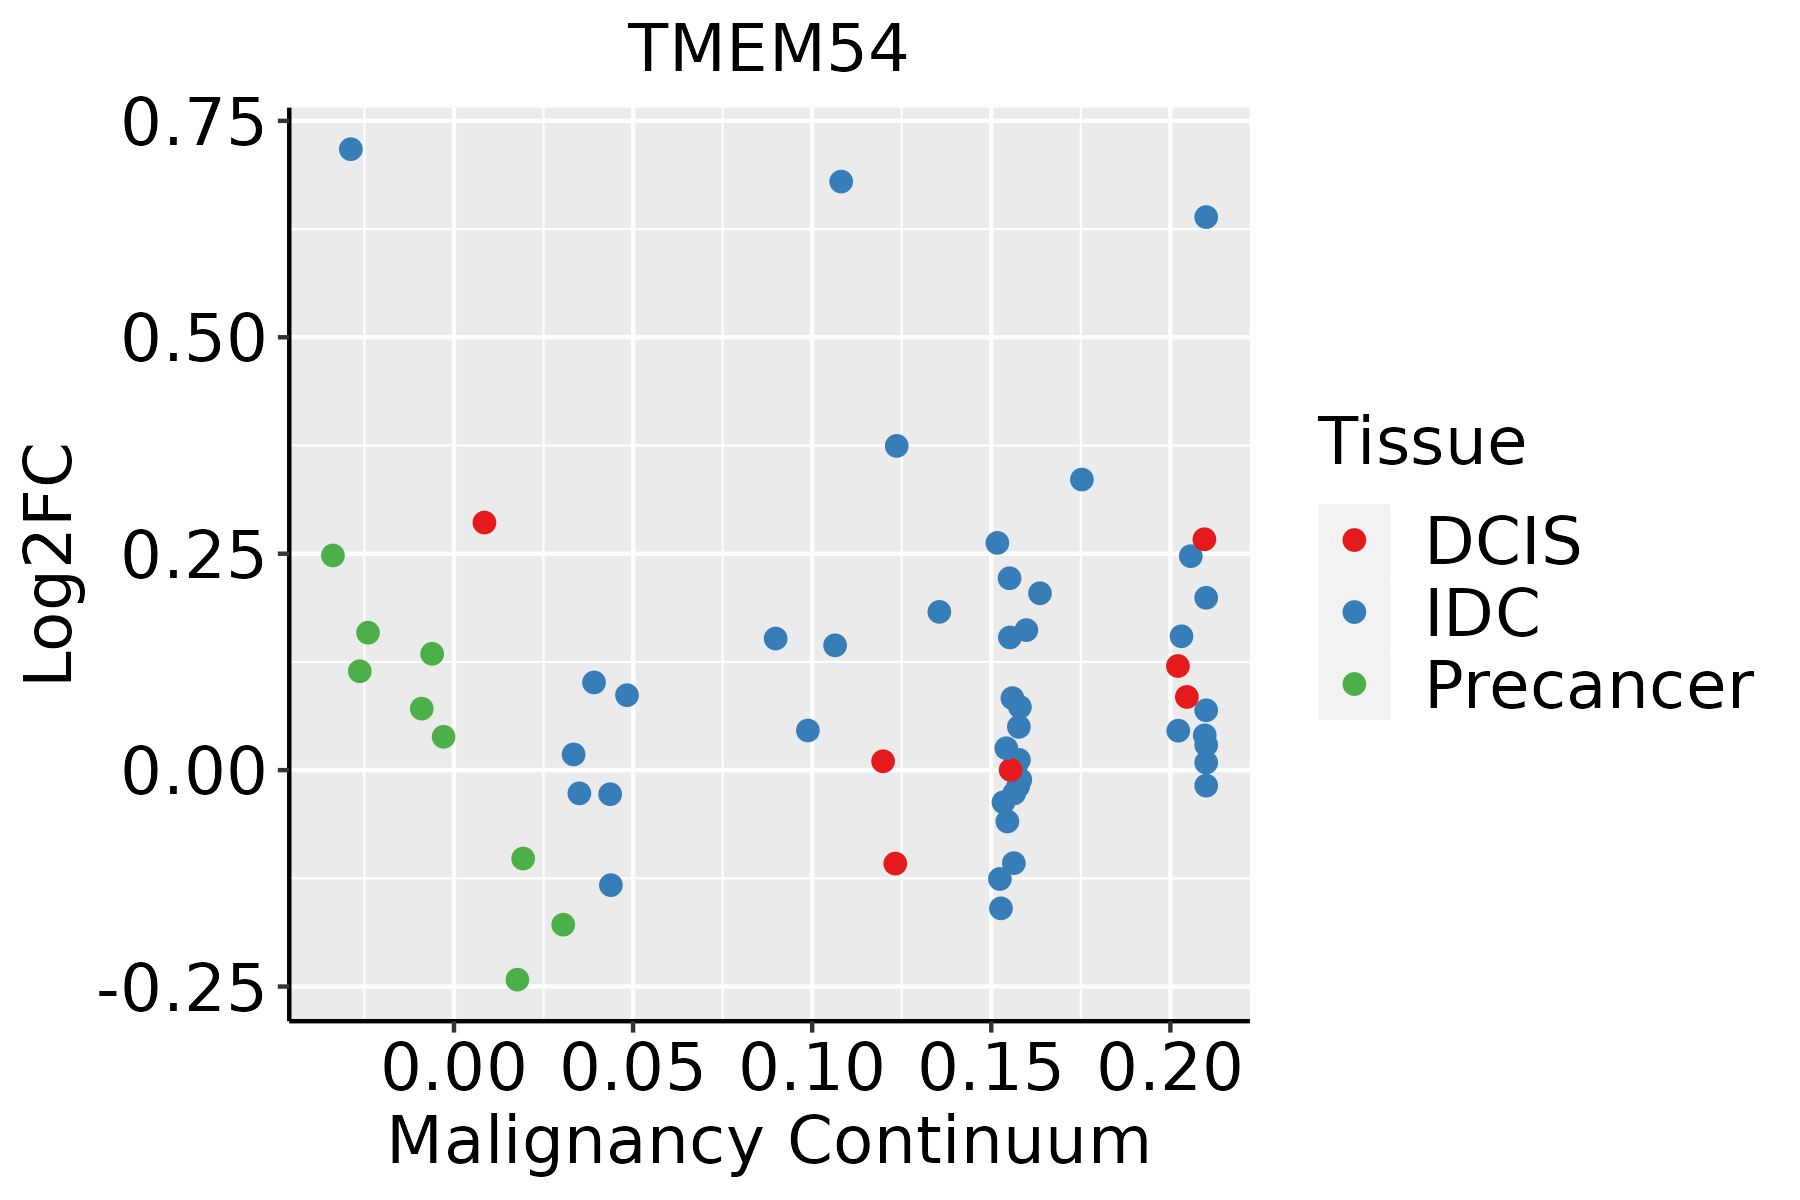 | IDC: Invasive ductal carcinoma |
| DCIS: Ductal carcinoma in situ | ||
| Precancer(BRCA1-mut): Precancerous lesion from BRCA1 mutation carriers | ||
| Cervix | 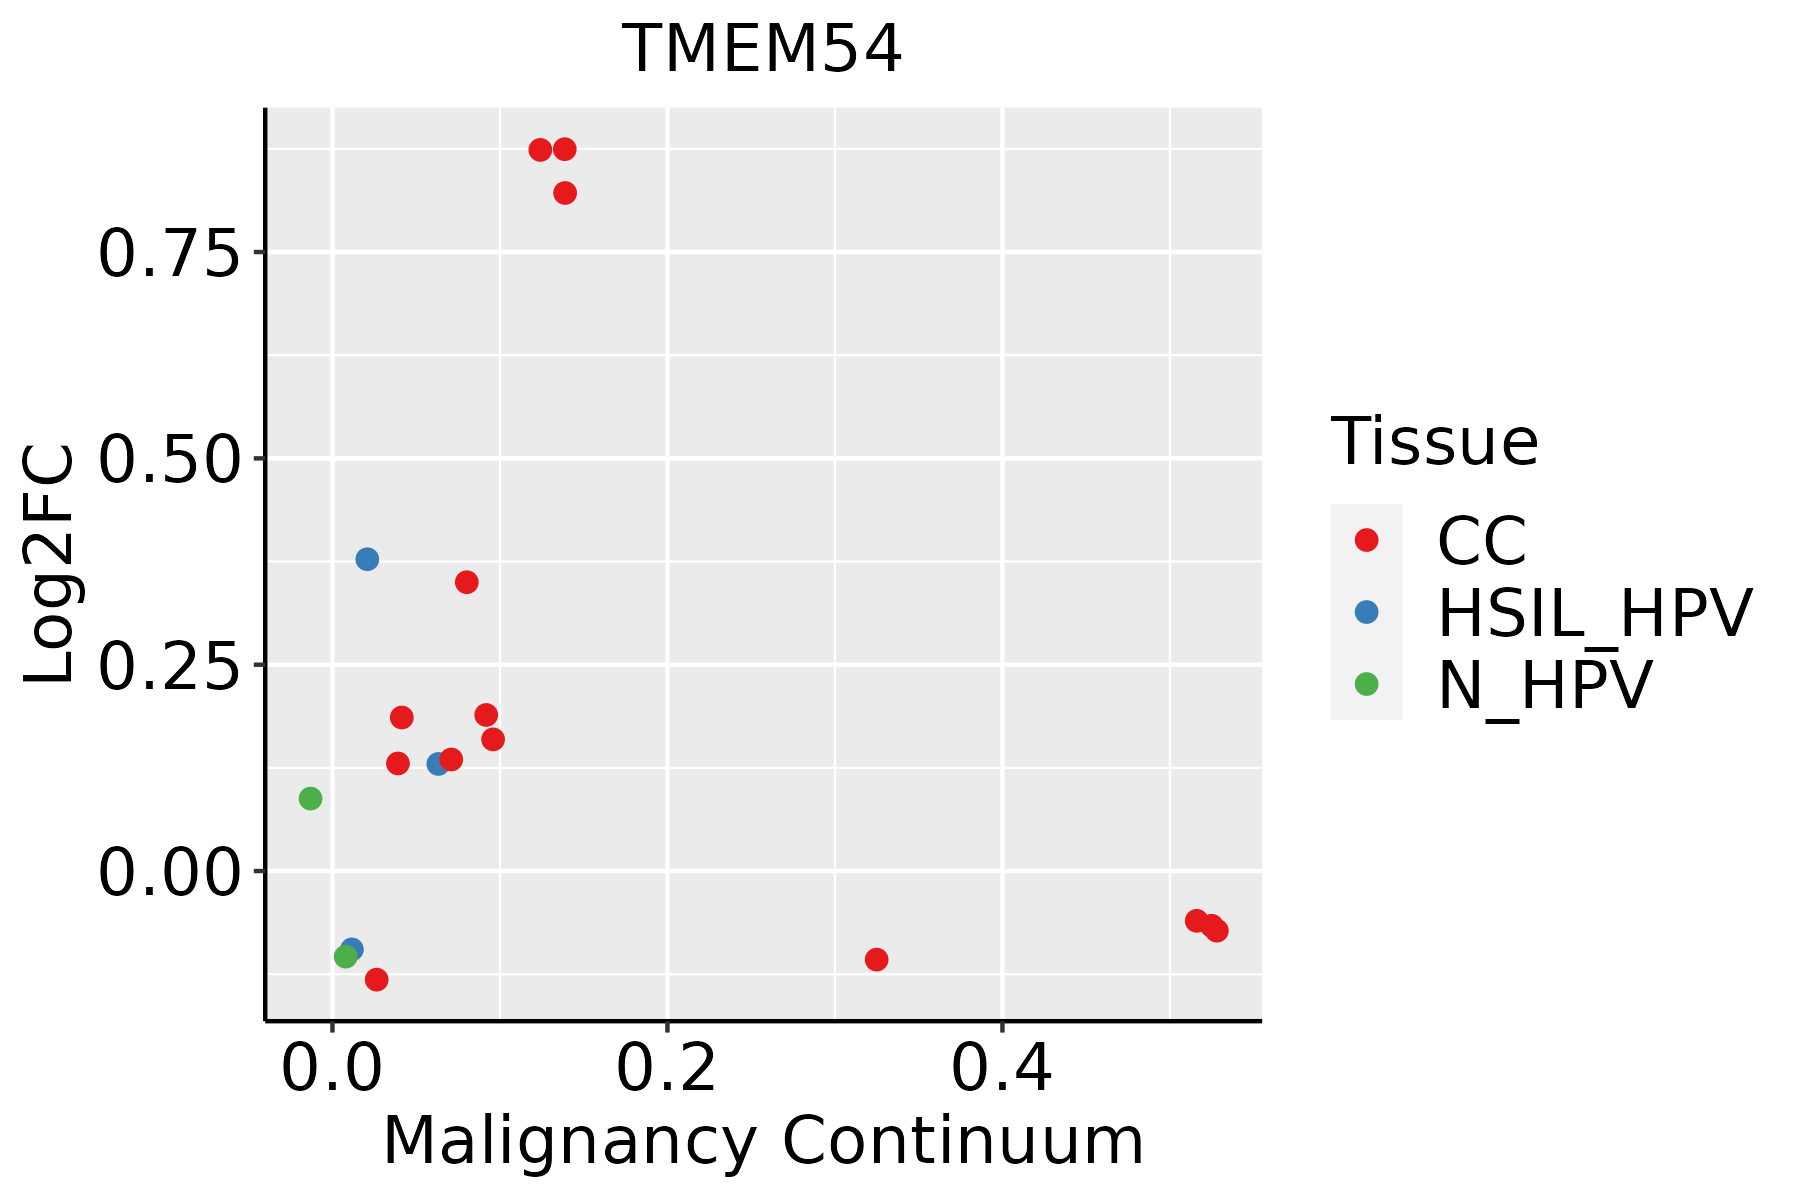 | CC: Cervix cancer |
| HSIL_HPV: HPV-infected high-grade squamous intraepithelial lesions | ||
| N_HPV: HPV-infected normal cervix | ||
| Colorectum (GSE201348) |  | FAP: Familial adenomatous polyposis |
| CRC: Colorectal cancer | ||
| Colorectum (HTA11) |  | AD: Adenomas |
| SER: Sessile serrated lesions | ||
| MSI-H: Microsatellite-high colorectal cancer | ||
| MSS: Microsatellite stable colorectal cancer | ||
| Esophagus | 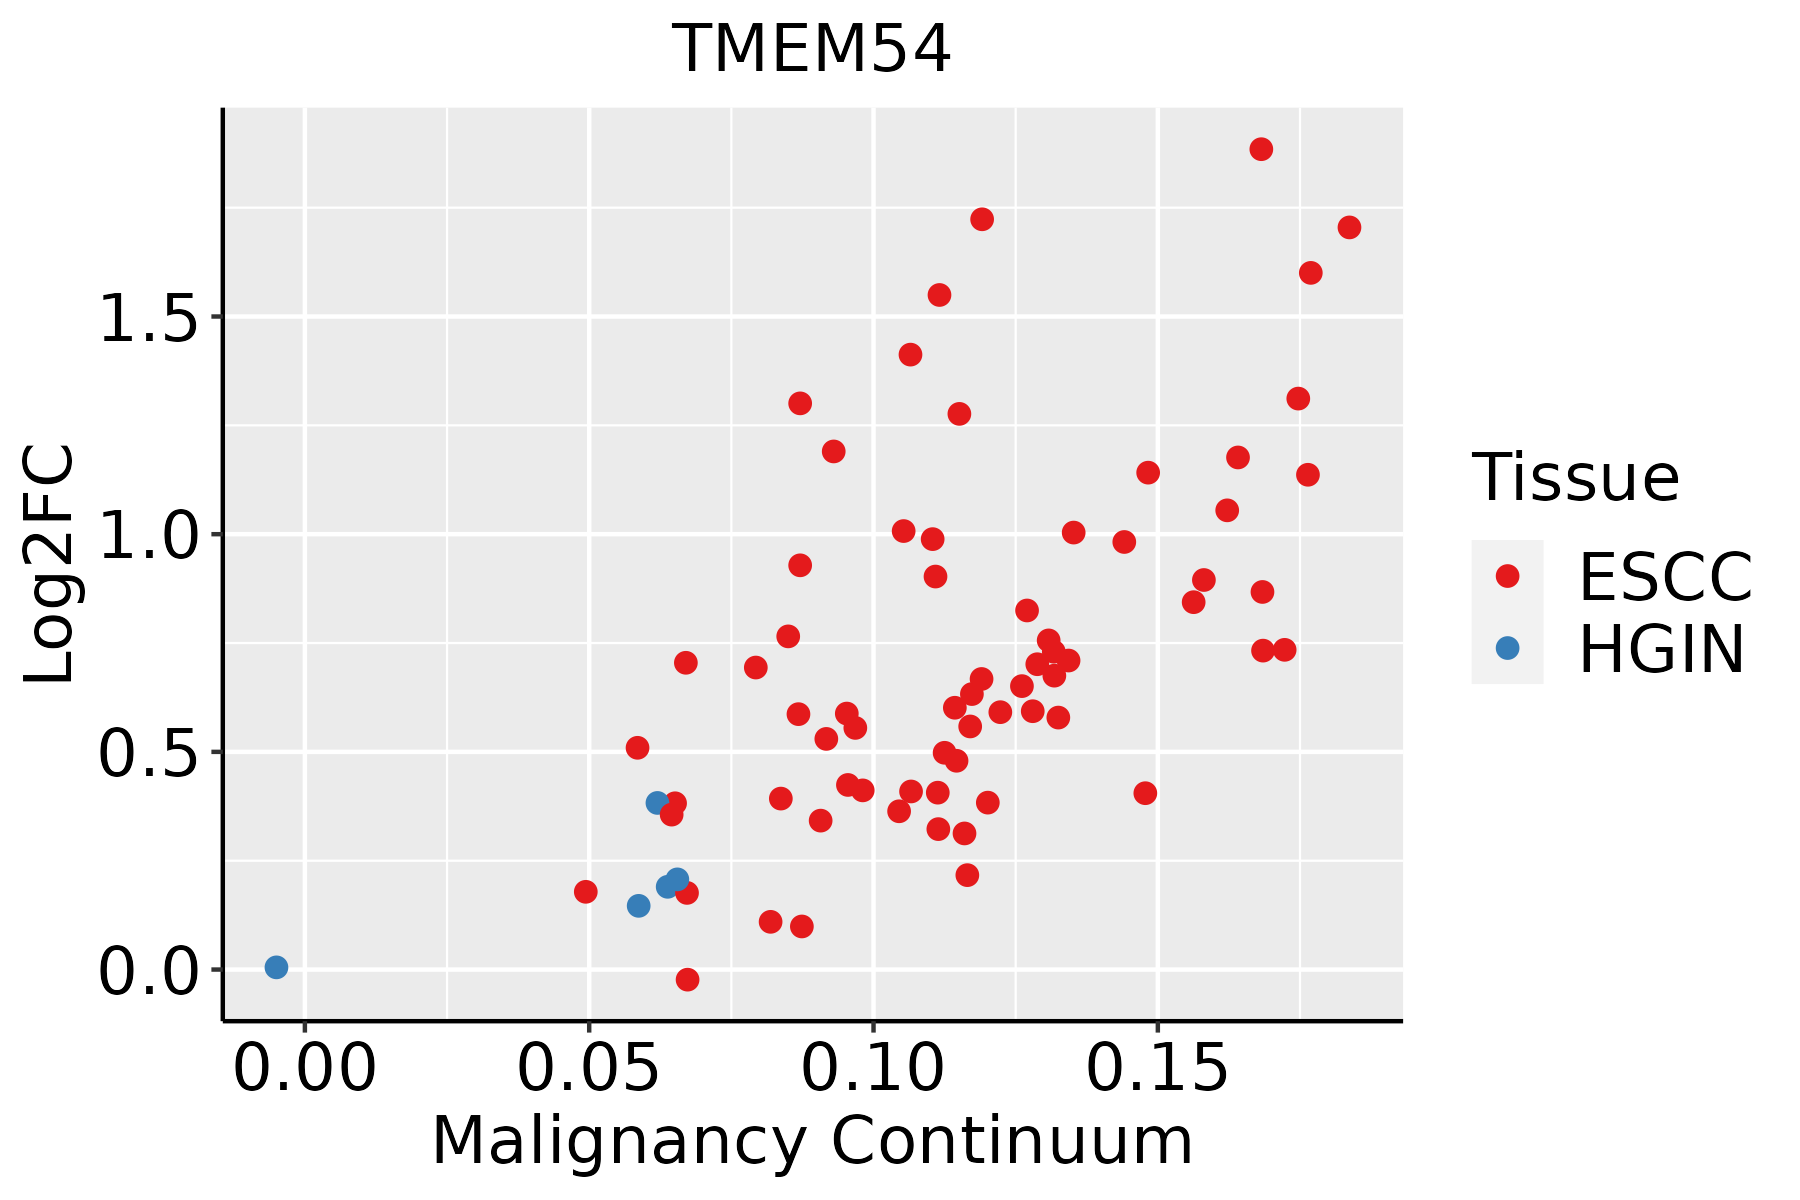 | ESCC: Esophageal squamous cell carcinoma |
| HGIN: High-grade intraepithelial neoplasias | ||
| LGIN: Low-grade intraepithelial neoplasias | ||
| GC | 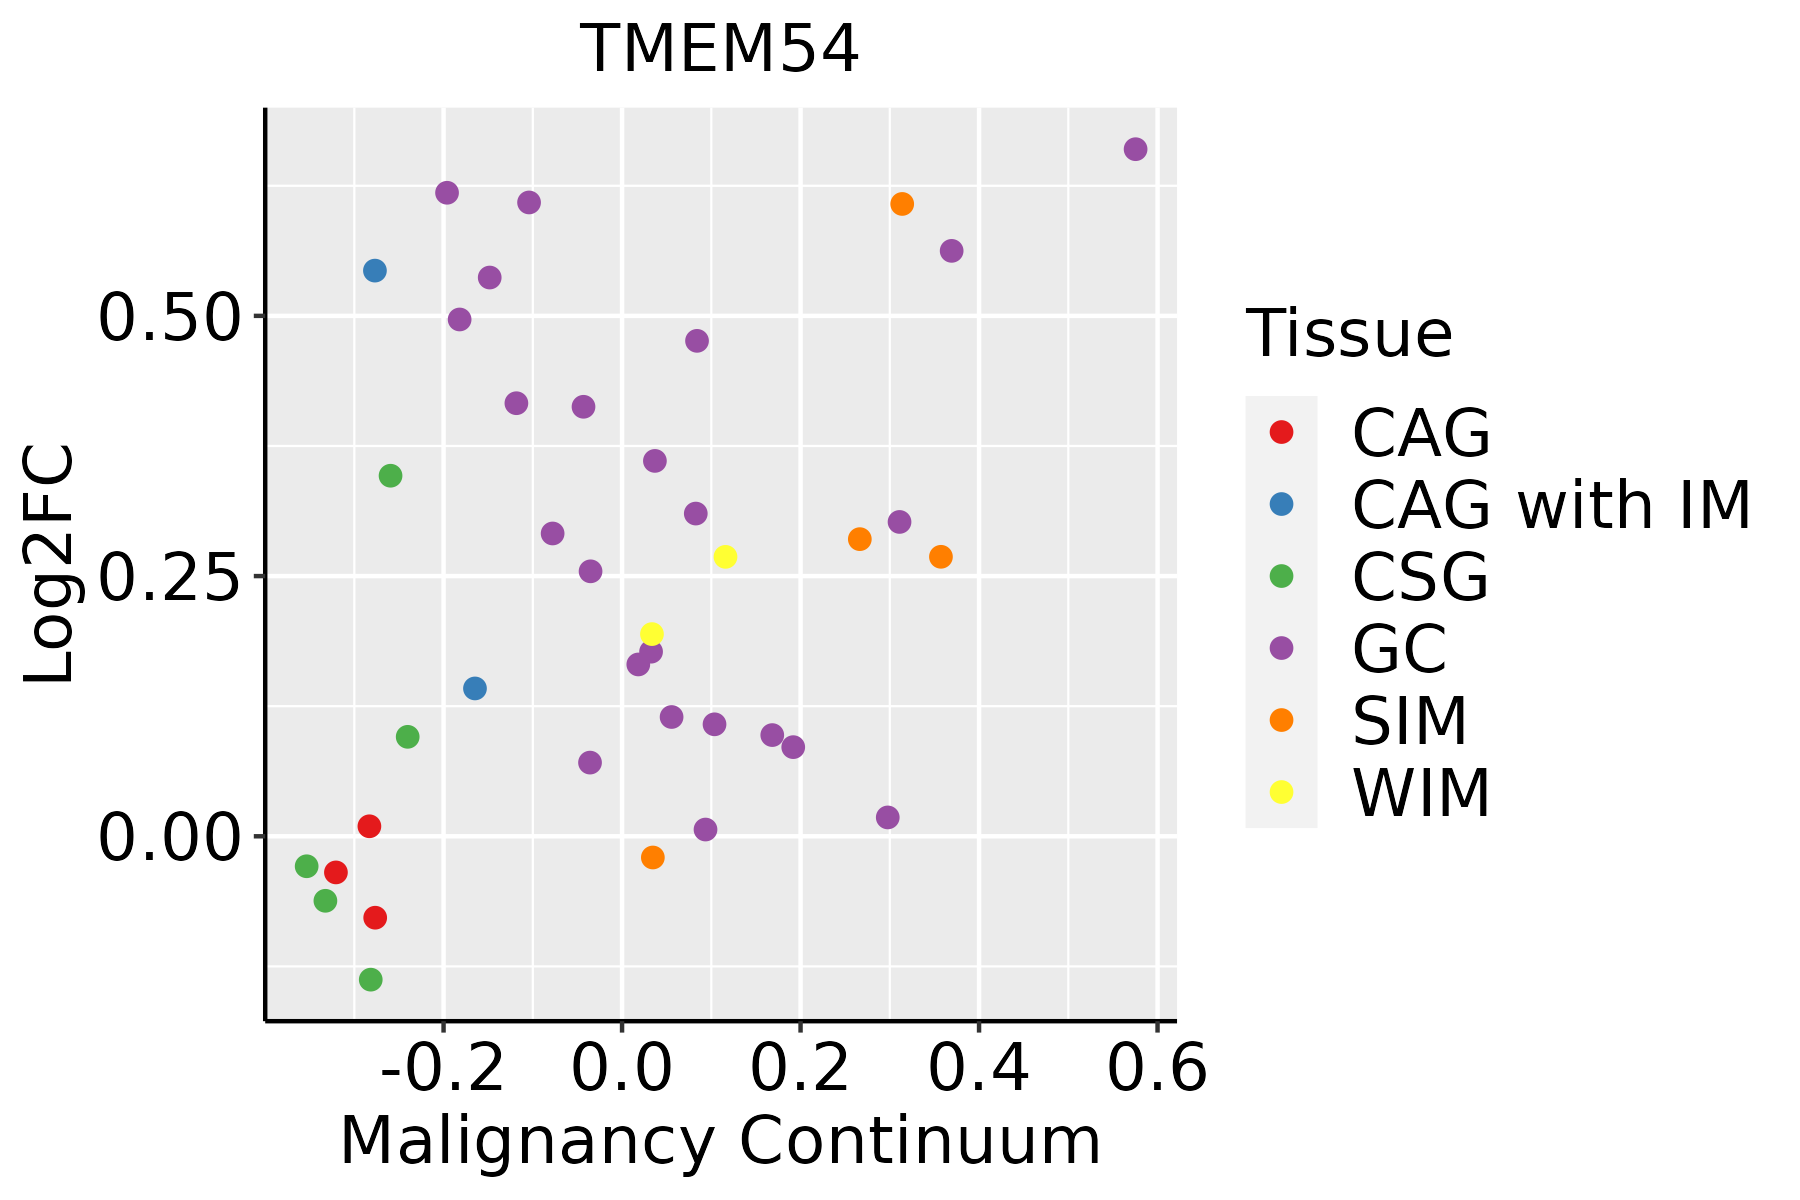 | CAG: Chronic atrophic gastritis |
| CAG with IM: Chronic atrophic gastritis with intestinal metaplasia | ||
| CSG: Chronic superficial gastritis | ||
| GC: Gastric cancer | ||
| SIM: Severe intestinal metaplasia | ||
| WIM: Wild intestinal metaplasia | ||
| Liver | 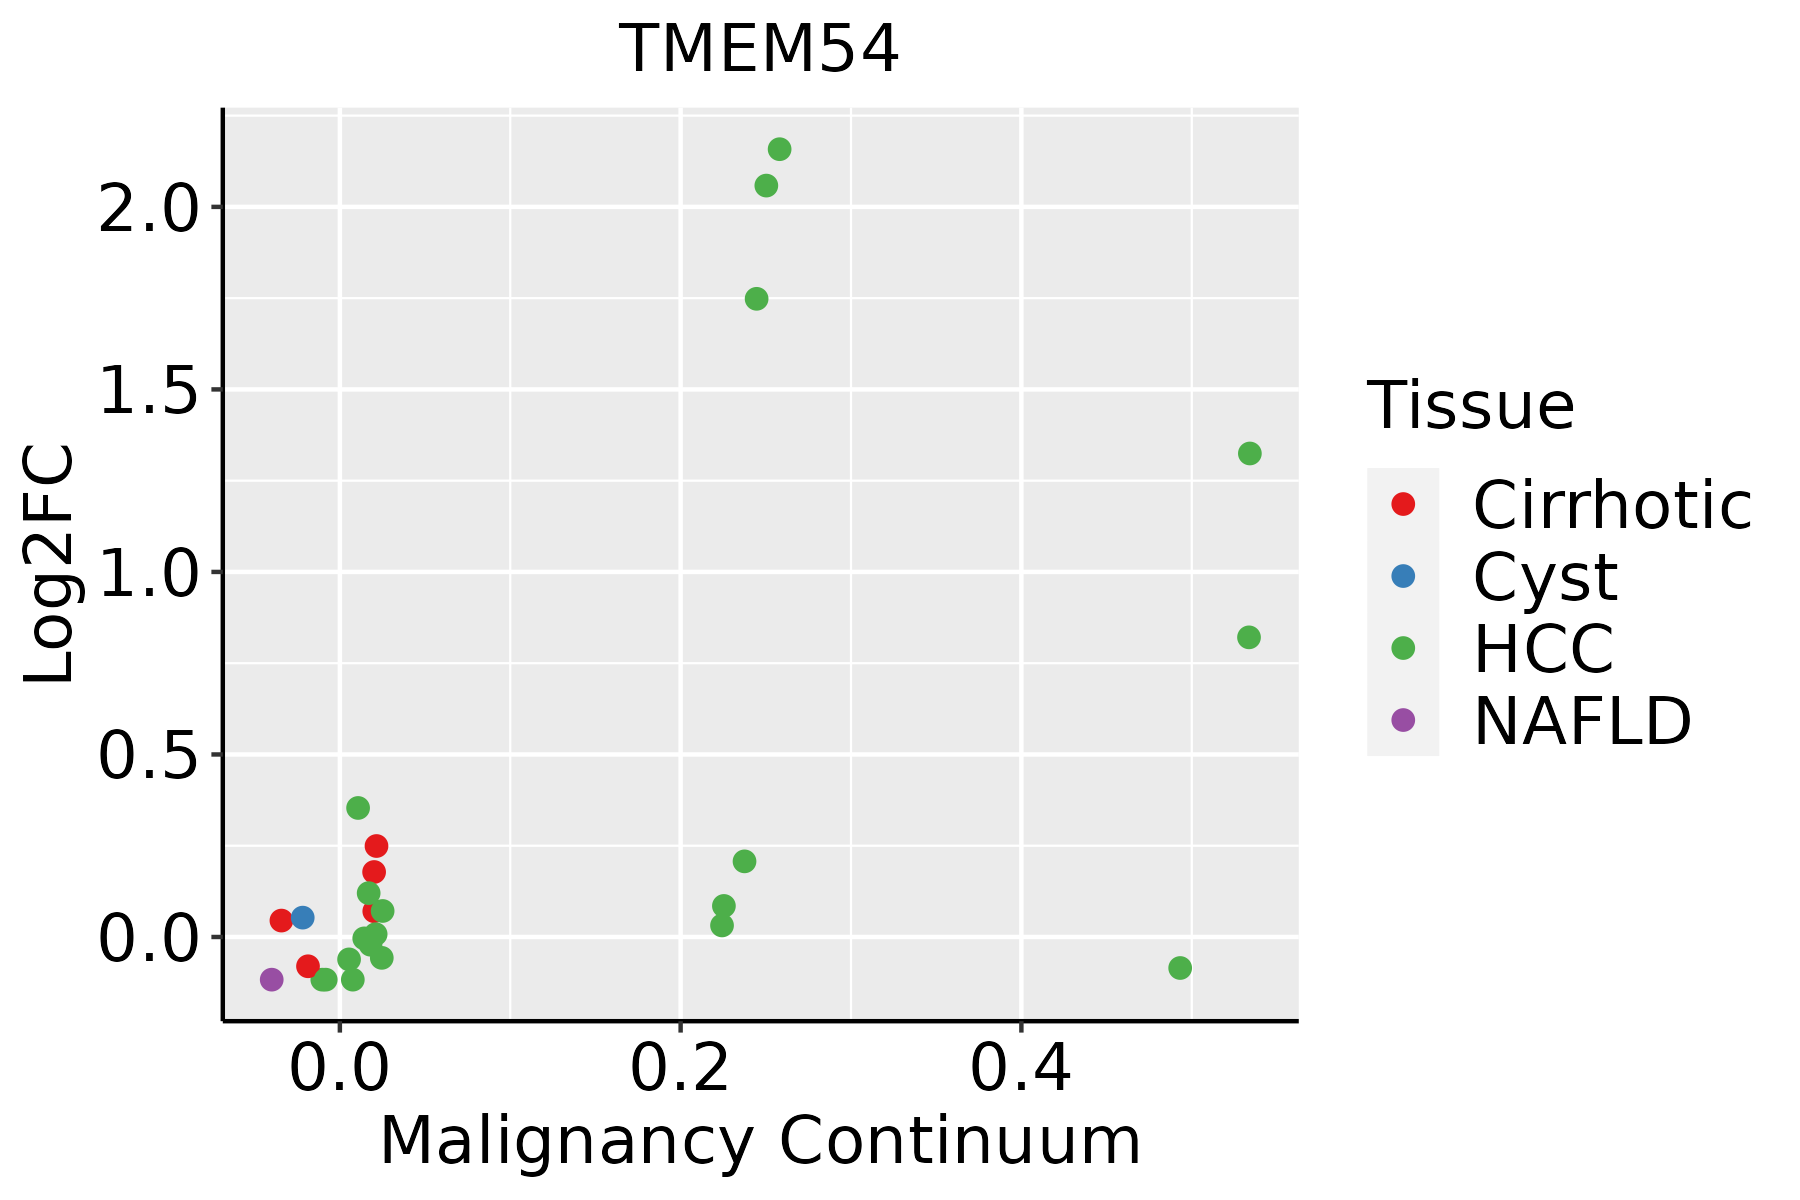 | HCC: Hepatocellular carcinoma |
| NAFLD: Non-alcoholic fatty liver disease | ||
| Oral Cavity |  | EOLP: Erosive Oral lichen planus |
| LP: leukoplakia | ||
| NEOLP: Non-erosive oral lichen planus | ||
| OSCC: Oral squamous cell carcinoma | ||
| Skin | 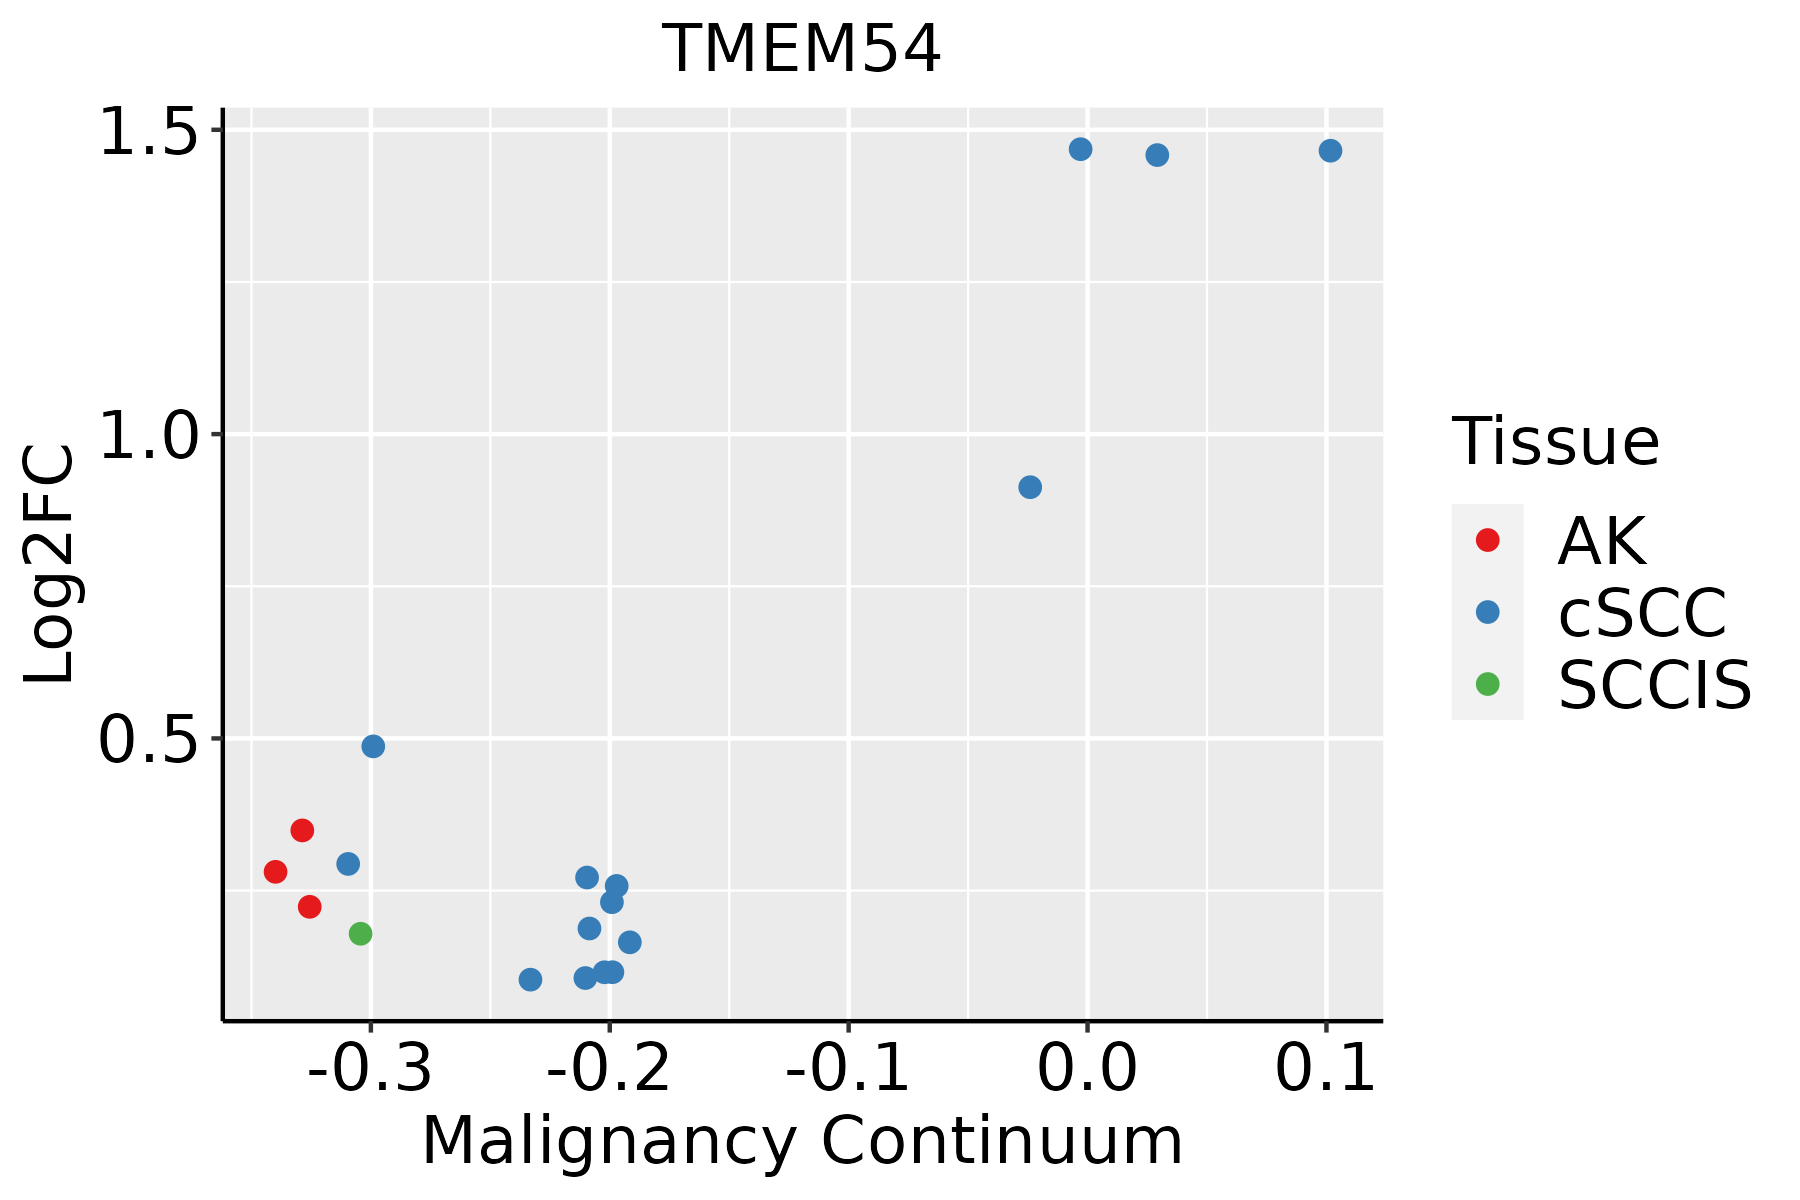 | AK: Actinic keratosis |
| cSCC: Cutaneous squamous cell carcinoma | ||
| SCCIS:squamous cell carcinoma in situ | ||
| Thyroid | 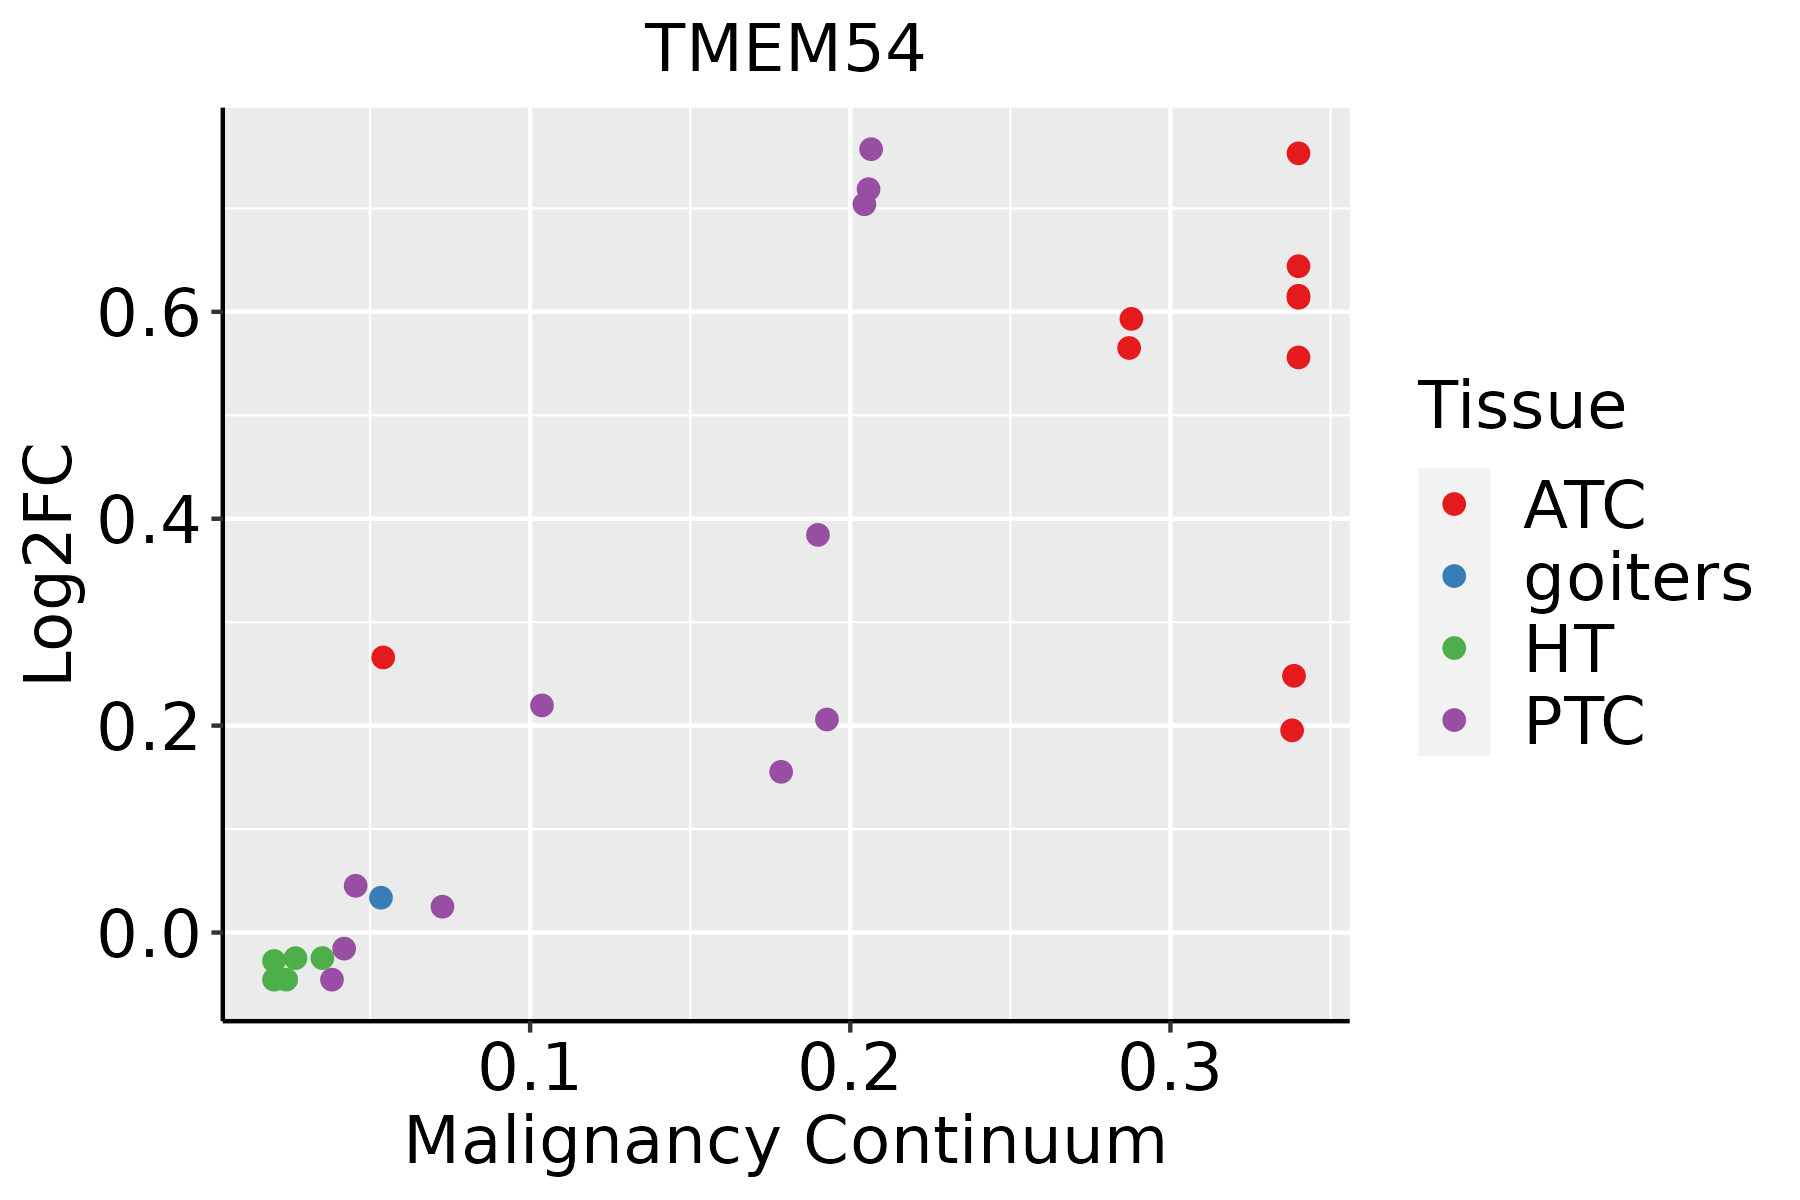 | ATC: Anaplastic thyroid cancer |
| HT: Hashimoto's thyroiditis | ||
| PTC: Papillary thyroid cancer |
| ∗log2FC in expression of this searched gene in stem-like cells from each diseased tissue sample relative to stem-like cells in normal samples in each tissue plotted against the malignancy continuum. Samples are colored based on if they are from different disease stage. |
Top |
Malignant transformation related pathway analysis |
| Find out the enriched GO biological processes and KEGG pathways involved in transition from healthy to precancer to cancer |
| Tissue | Disease Stage | Enriched GO biological Processes |
| Colorectum | AD |  |
| Colorectum | SER |  |
| Colorectum | MSS |  |
| Colorectum | MSI-H |  |
| Colorectum | FAP |  |
| ∗Top 15 enriched GO BP terms are showed in the bar plot of each disease state in each tissue. Each row represents a significant GO biological process which is colored according to the -log10(p.adjust). |
| Page: 1 2 3 4 5 6 7 8 9 |
| GO ID | Tissue | Disease Stage | Description | Gene Ratio | Bg Ratio | pvalue | p.adjust | Count |
| Page: 1 |
| Pathway ID | Tissue | Disease Stage | Description | Gene Ratio | Bg Ratio | pvalue | p.adjust | qvalue | Count |
| Page: 1 |
Top |
Cell-cell communication analysis |
| Identification of potential cell-cell interactions between two cell types and their ligand-receptor pairs for different disease states |
| Ligand | Receptor | LRpair | Pathway | Tissue | Disease Stage |
| Page: 1 |
Top |
Single-cell gene regulatory network inference analysis |
| Find out the significant the regulons (TFs) and the target genes of each regulon across cell types for different disease states |
| TF | Cell Type | Tissue | Disease Stage | Target Gene | RSS | Regulon Activity |
| ∗The dot plots of a searched regulon are shown for all cell subpopulations in each disease state of each tissue based on the regulon specific score inferred using pySCENIC and by calculating the average expression. |
| Page: 1 |
Top |
Somatic mutation of malignant transformation related genes |
| Annotation of somatic variants for genes involved in malignant transformation |
| Hugo Symbol | Variant Class | Variant Classification | dbSNP RS | HGVSc | HGVSp | HGVSp Short | SWISSPROT | BIOTYPE | SIFT | PolyPhen | Tumor Sample Barcode | Tissue | Histology | Sex | Age | Stage | Therapy Types | Drugs | Outcome |
| TMEM54 | SNV | Missense_Mutation | rs751814809 | c.208N>A | p.Val70Met | p.V70M | Q969K7 | protein_coding | deleterious(0.05) | benign(0.054) | TCGA-AN-A0AK-01 | Breast | breast invasive carcinoma | Female | >=65 | I/II | Unknown | Unknown | SD |
| TMEM54 | SNV | Missense_Mutation | rs746007733 | c.625N>T | p.Arg209Cys | p.R209C | Q969K7 | protein_coding | deleterious(0.01) | benign(0) | TCGA-AA-3506-01 | Colorectum | colon adenocarcinoma | Male | >=65 | I/II | Unknown | Unknown | SD |
| TMEM54 | SNV | Missense_Mutation | novel | c.575N>A | p.Gly192Glu | p.G192E | Q969K7 | protein_coding | deleterious(0.02) | probably_damaging(0.971) | TCGA-A5-A0G1-01 | Endometrium | uterine corpus endometrioid carcinoma | Female | >=65 | I/II | Unknown | Unknown | SD |
| TMEM54 | SNV | Missense_Mutation | rs779851836 | c.155N>T | p.Ala52Val | p.A52V | Q969K7 | protein_coding | tolerated(0.06) | probably_damaging(0.919) | TCGA-AX-A06F-01 | Endometrium | uterine corpus endometrioid carcinoma | Female | <65 | III/IV | Chemotherapy | carboplatin | SD |
| TMEM54 | SNV | Missense_Mutation | novel | c.293G>T | p.Ser98Ile | p.S98I | Q969K7 | protein_coding | deleterious(0) | possibly_damaging(0.745) | TCGA-AX-A2HD-01 | Endometrium | uterine corpus endometrioid carcinoma | Female | >=65 | III/IV | Unknown | Unknown | SD |
| TMEM54 | SNV | Missense_Mutation | c.449N>T | p.Thr150Ile | p.T150I | Q969K7 | protein_coding | deleterious(0) | probably_damaging(0.999) | TCGA-BS-A0TJ-01 | Endometrium | uterine corpus endometrioid carcinoma | Female | <65 | I/II | Unknown | Unknown | SD | |
| TMEM54 | SNV | Missense_Mutation | rs775486263 | c.247N>T | p.Arg83Cys | p.R83C | Q969K7 | protein_coding | deleterious(0) | probably_damaging(0.999) | TCGA-EO-A22U-01 | Endometrium | uterine corpus endometrioid carcinoma | Female | >=65 | I/II | Unknown | Unknown | SD |
| TMEM54 | SNV | Missense_Mutation | rs779851836 | c.155N>T | p.Ala52Val | p.A52V | Q969K7 | protein_coding | tolerated(0.06) | probably_damaging(0.919) | TCGA-EO-A22U-01 | Endometrium | uterine corpus endometrioid carcinoma | Female | >=65 | I/II | Unknown | Unknown | SD |
| TMEM54 | SNV | Missense_Mutation | c.127C>G | p.Leu43Val | p.L43V | Q969K7 | protein_coding | deleterious(0) | probably_damaging(0.998) | TCGA-55-A57B-01 | Lung | lung adenocarcinoma | Female | >=65 | I/II | Unknown | Unknown | SD | |
| TMEM54 | SNV | Missense_Mutation | novel | c.626N>T | p.Arg209Leu | p.R209L | Q969K7 | protein_coding | tolerated(0.07) | benign(0.029) | TCGA-D6-8569-01 | Oral cavity | head & neck squamous cell carcinoma | Male | <65 | I/II | Unknown | Unknown | SD |
| Page: 1 2 |
Top |
Related drugs of malignant transformation related genes |
| Identification of chemicals and drugs interact with genes involved in malignant transfromation |
| (DGIdb 4.0) |
| Entrez ID | Symbol | Category | Interaction Types | Drug Claim Name | Drug Name | PMIDs |
| Page: 1 |

Copyright 2023-Present -The University of Texas Health Science Center at Houston |